
Scatter Plot
Don’t just tell. Show.

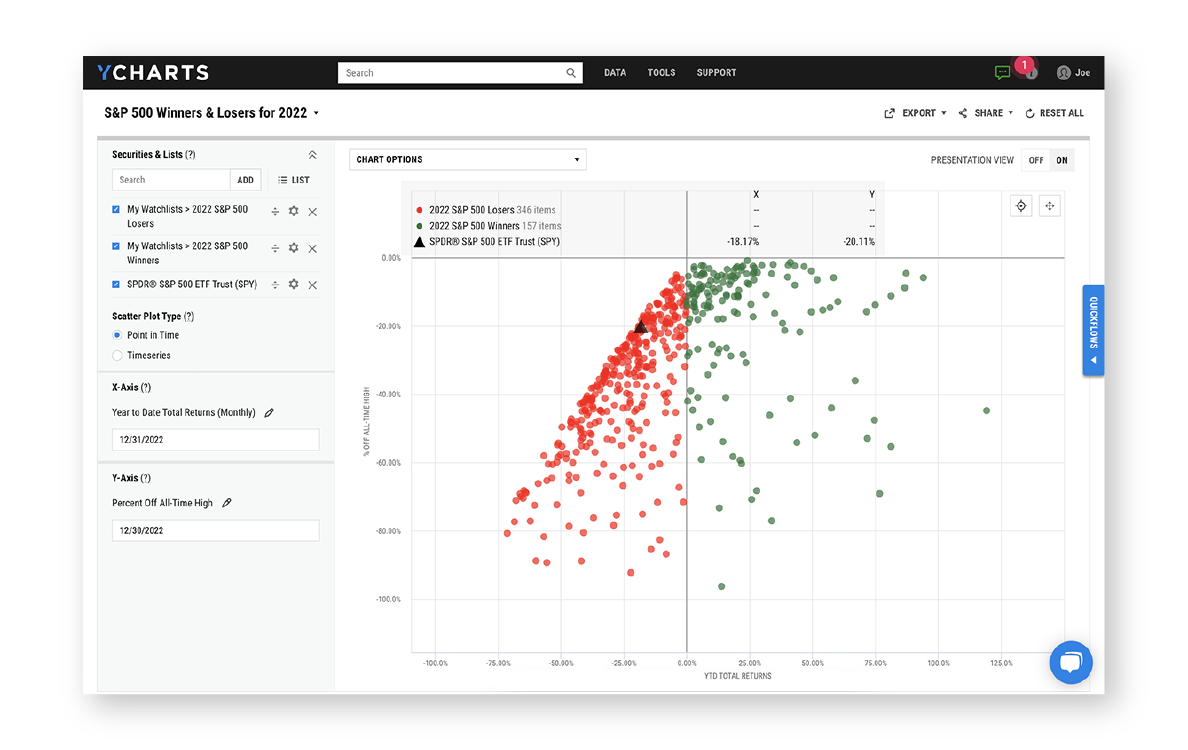
Visualize risk vs. reward, or any metric combination
Validate your research process by using the Scatter Plot maker to compare and contrast a basket of stocks, funds, or other securities. Clean, intuitive visuals that are downloadable as PNG images create a compelling conversation point with clients.
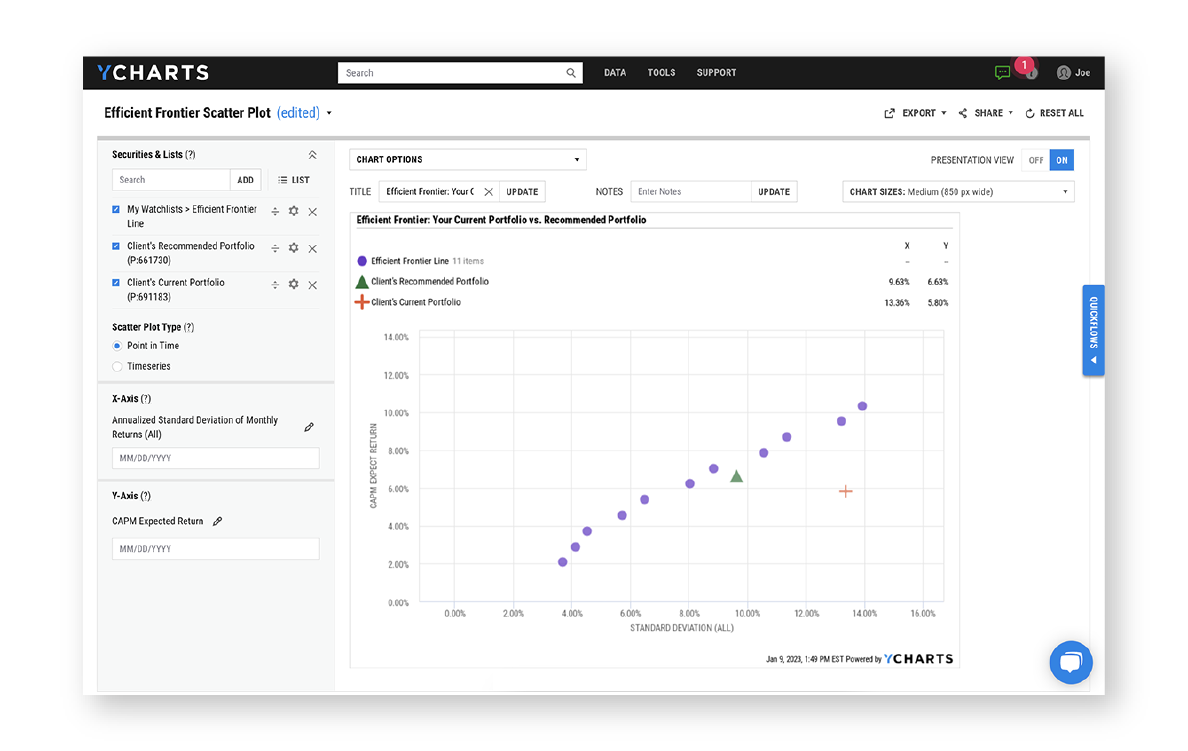
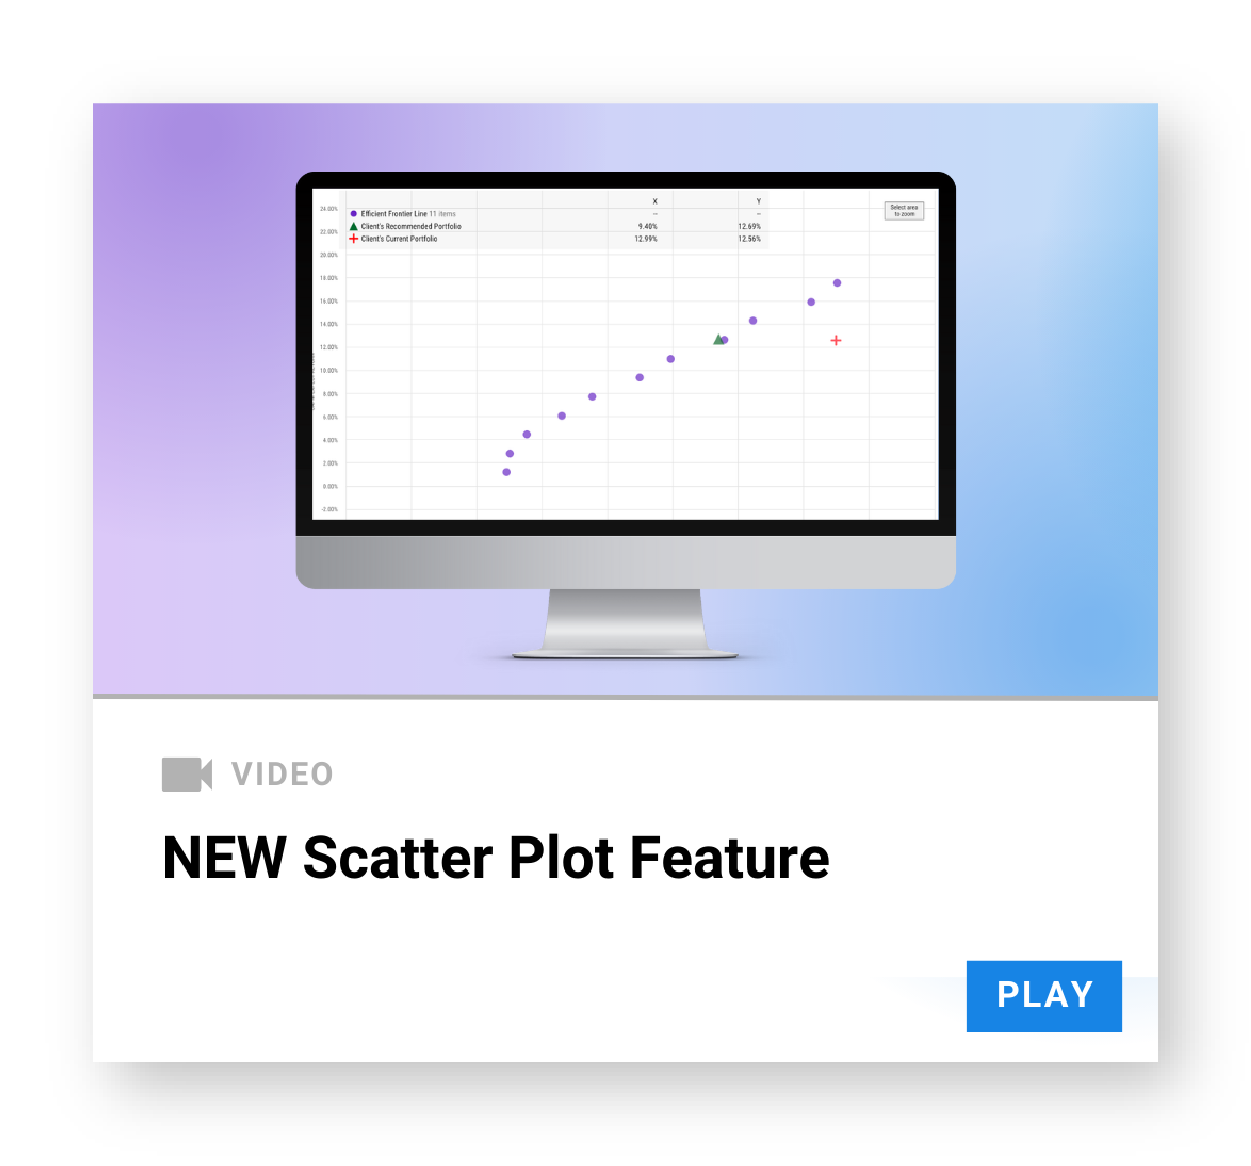
Compare portfolios to an efficient frontier proxy
Spot opportunities to minimize portfolio risk and enhance returns by comparing your strategies to an efficient frontier proxy. Win new business and exceed client expectations by recommending optimal allocations, relative to those of competitors.
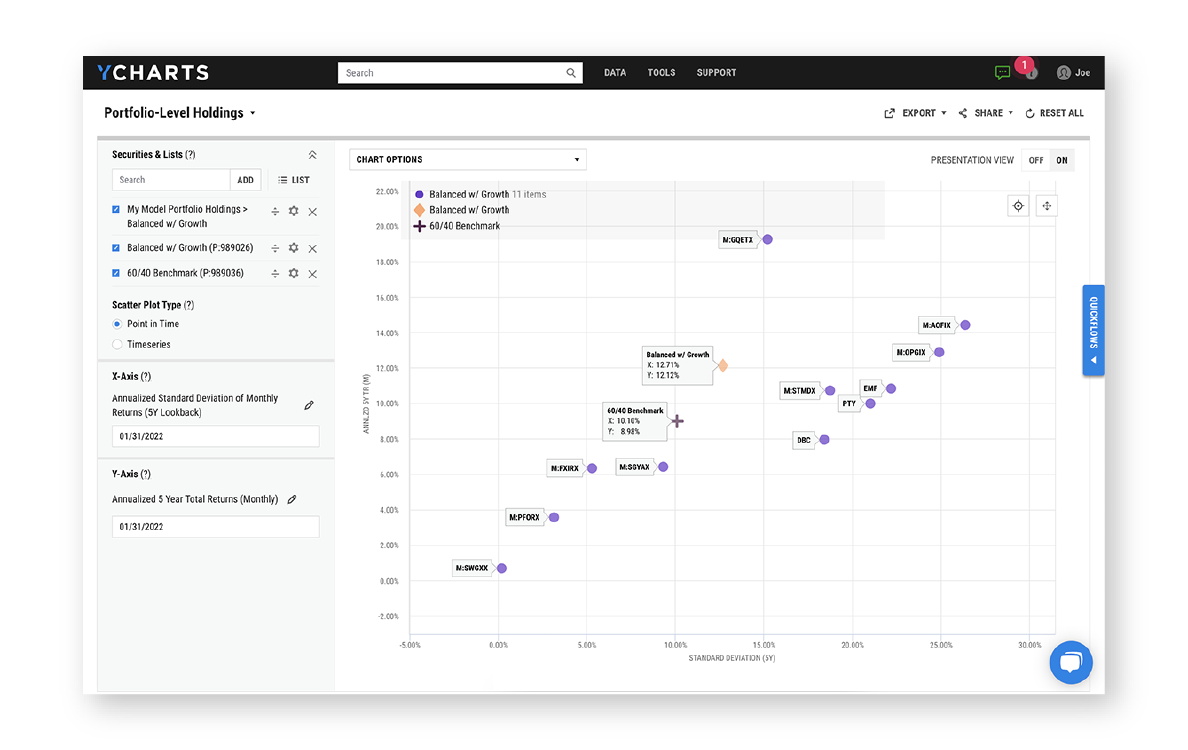
See how individual holdings affect portfolio-level metrics
Take a look “under the hood” to see what’s really driving portfolio performance. With our Scatter Plot creator, you and your clients can understand how each holding impacts portfolio level metrics, and pinpoint which ones are driving or dragging-on ideal outcomes.
Learn how Scatter Plot can help you make smarter investing decisions
![]()