Hedging Geopolitical Risk & the GPR Index with ETFs
As tensions on the Russia-Ukraine border increase and parts of the Middle East experience continued unrest, we are all reminded that the world can be a shaky place—and its leaders can be unpredictable.
Put into investing terms, these uncertainties are commonly referred to as “geopolitical risk”.
Even in portfolios that are supposedly 100% US-invested, US multinational companies can see their bottom lines negatively impacted when instability rocks their global operations or customer base.
So is there a way to hedge against this geopolitical risk? Are there asset classes that can reduce drawdowns, or even improve total return during unstable times? Does the usual “flight to safety” strategy apply to unstable geopolitics?
To better answer these questions, we looked at how different hedging strategies performed during historically significant periods of geopolitical risk. Our findings spell out some of the potential pros and cons of hedging with certain ETFs when added to a hypothetical, balanced portfolio of 60% equity, 40% fixed income.
Download the new White Paper—which also looks into hedging inflation, market crashes, geopolitical risk, and climate change using ETFs—for our full findings:
The Best Geopolitical Risk Hedges in 2018 and 2020
Our full Can You Hedge It with an ETF? white paper uses three distinct periods of geopolitical risk to measure the efficacy of hedging with different ETFs. Here, we focus on a recent saga of geopolitical risk that included missile strikes in Syria and Iraq.
The Caldara and Iacoviello Geopolitical Risk Index (GPR) measures threats and acts related to wars, terrorism, and other tensions among countries and international actors. Developed by Federal Reserve Board of Governor members Dario Caldara and Matteo Iacoviello, the index doubled from a decade low in February 2018 in response to missile strikes involving the US and adversaries. Interestingly, the GPR index remained elevated until it spiked in February 2020, at the onset of COVID-19, then fell dramatically to indicate relative geopolitical stability.
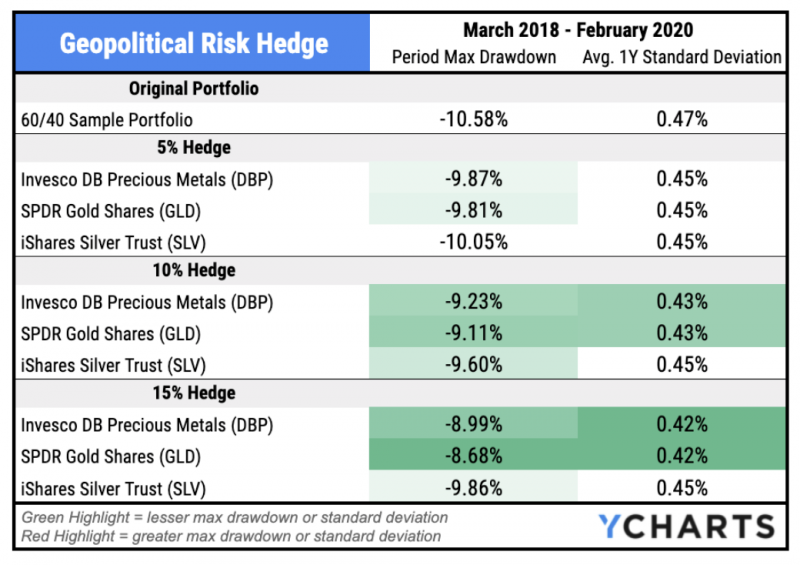
Precious metals are the most commonly used hedges against geopolitical risk, and two of them stood out during the period.
From March 2018 through February 2020, both the Invesco DB Precious Metals ETF (DBP) and SPDR Gold Shares ETF (GLD) reduced the 60/40 portfolio’s max drawdown and average 1-year standard deviation. In fact, both risk metrics decreased as the hedge weights increased incrementally from 5% to 15%.
Download Visual | See the Full White Paper
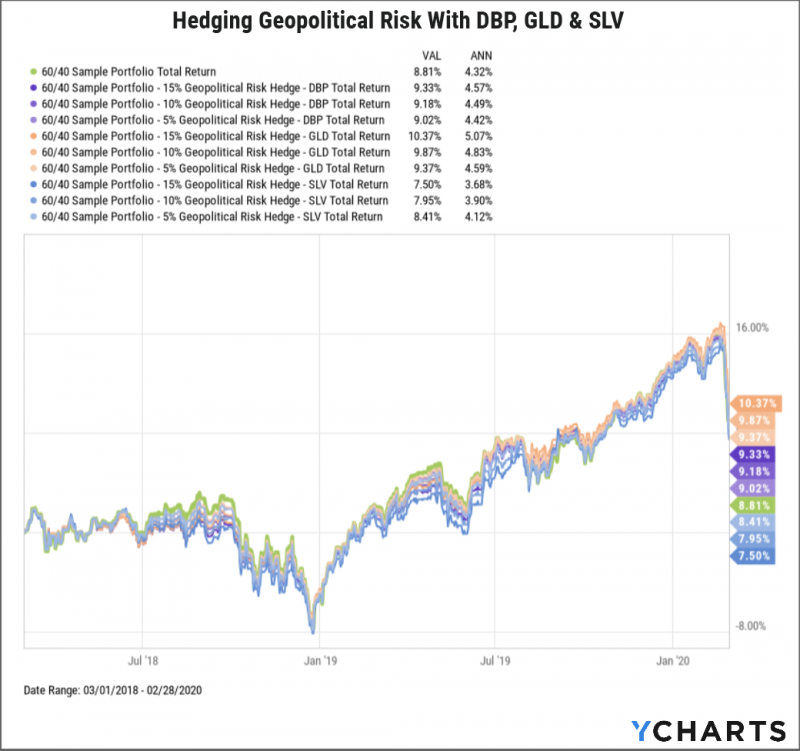
A portfolio hedged with GLD also outperformed the field in total returns over the period. Allocating 5% to GLD improved the 60/40 portfolio’s annualized total returns by 27 basis points, while a 15% GLD hedge added 75 bps.
On the other hand, hedging with SLV caused a lag in the portfolio’s total returns and provided less downside protection. Just like the Olympic podium, Gold stood atop Silver for hedging against geopolitical risk during this particular period.
Download Visual | See the Full White Paper
To see whether ETF hedges were effective across other historical periods of geopolitical instability, including during the annexation of Crimea by Russia in 2014 and Libya’s civil war in 2010, download the FREE white paper:
Connect With YCharts
To get in touch, contact YCharts via email at hello@ycharts.com or by phone at (866) 965-7552
Interested in adding YCharts to your technology stack? Sign up for a 7-Day Free Trial.
Disclaimer
©2022 YCharts, Inc. All Rights Reserved. YCharts, Inc. (“YCharts”) is not registered with the U.S. Securities and Exchange Commission (or with the securities regulatory authority or body of any state or any other jurisdiction) as an investment adviser, broker-dealer or in any other capacity, and does not purport to provide investment advice or make investment recommendations. This report has been generated through application of the analytical tools and data provided through ycharts.com and is intended solely to assist you or your investment or other adviser(s) in conducting investment research. You should not construe this report as an offer to buy or sell, as a solicitation of an offer to buy or sell, or as a recommendation to buy, sell, hold or trade, any security or other financial instrument. For further information regarding your use of this report, please go to: ycharts.com/about/disclosure
Next Article
$ARKK, Shopify & Tesla’s PE - What’s Trending on YCharts?Read More →