The Inverted Yield Curve: What It Means and How to Navigate It
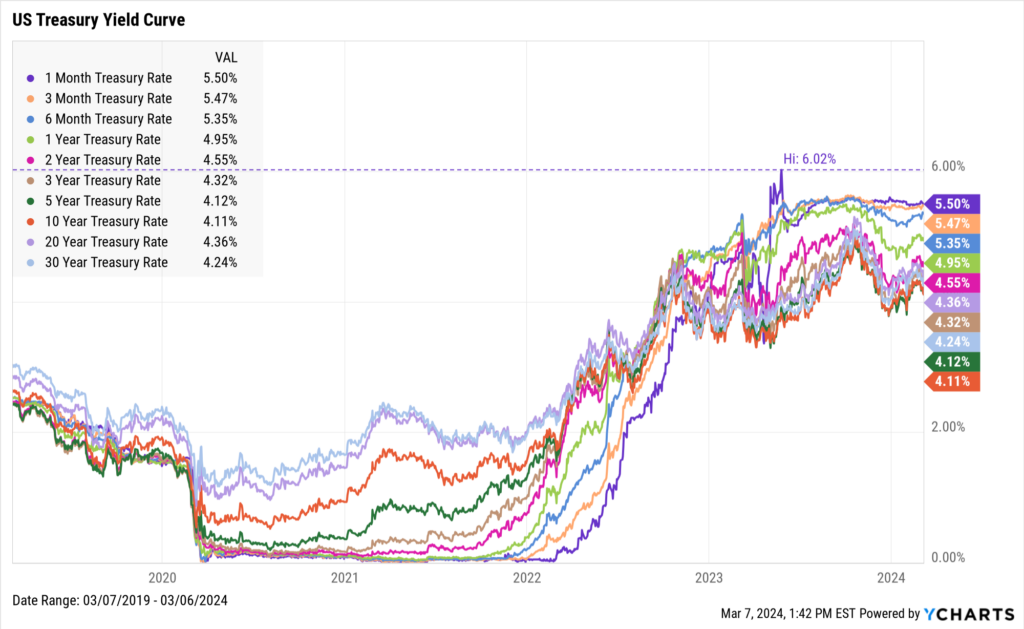
The 1-Month Treasury Bill’s rate of 5.50% is currently the highest among US treasuries as of March 6th, 2024. It was near 0% for a two-year stretch between March 2020 and March 2022.
The 1-month rate is currently higher than the 10-year by 139 basis points. At the end of May 2023, the 1-Month T-Bill eclipsed 6% for the first time ever, and was the first treasury instrument to do so since 2002.
Download Visual | Modify in YCharts
This is a situation known as an inverted yield curve. An inverted yield curve is when shorter-term notes pay higher effective yields than longer-term bonds. The yield curve is considered “normal” when longer-term bonds yield more than shorter-term ones.
Much like your favorite (or most hated) theme park roller coaster, an inverted yield curve signals that the broader economy might be headed for some twists and turns. Yield curve inversions are regarded by many as warning signs of a recession, as they have consistently preceded US recessions. They also indicate uncertainty in equity markets.
How much should you worry about this yield curve inversion? Is a recession coming? And if so, how soon? Who tends to be the winners and losers of an inverted yield curve?
What Inverted Yield Curves Mean for Recessions
Generally, investors receive higher returns when they agree to commit their cash for longer time periods. So the fact that an investor today could lock in a 5.50% effective annual yield with principal paid back in one month, but just 4.11% for one decade, doesn’t sound quite right, does it?
An inverted yield curve occurs when near-term risks increase. Investors demand greater compensation from shorter-term treasuries when long-term expectations for the economy sour.
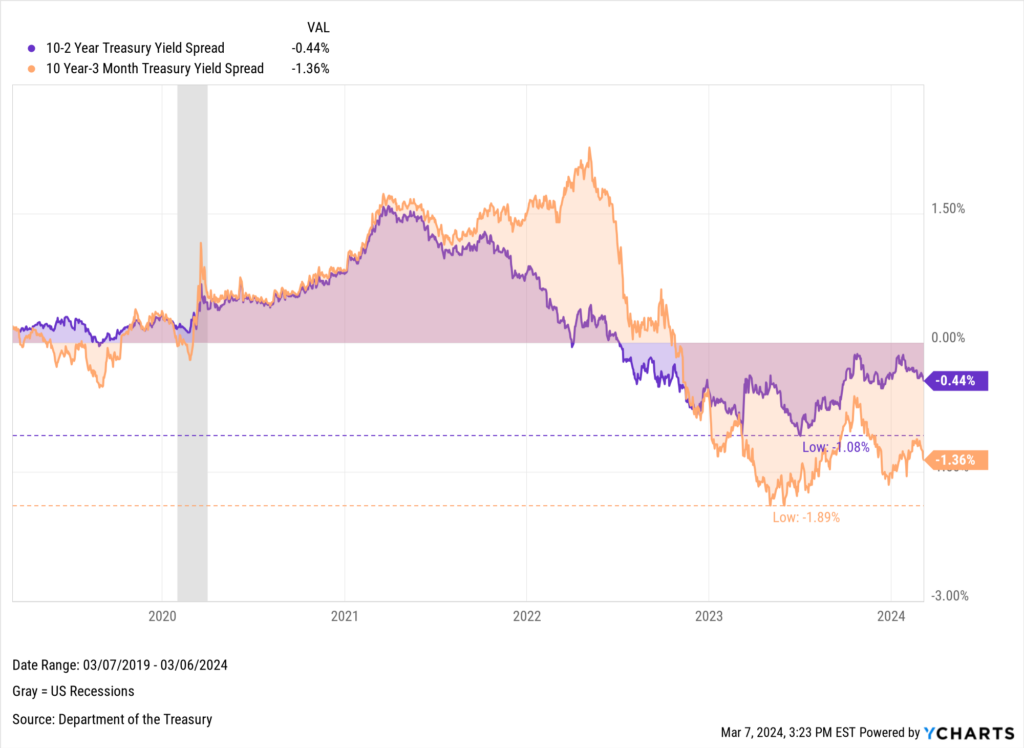
Inverted yield curves can be more clearly illustrated through yield spreads. Two of the most closely followed spreads are the 10-2 Year Treasury Yield Spread and the 10 Year-3 Month Treasury Yield Spread. The 10-2 year spread inverted at the beginning of July last year and has stayed negative since, stirring up fears of a recession.
At the same time, the technical definition of a recession was met early last year when two consecutive quarters of negative GDP growth were logged between Q1 and Q2 2022. No recession has materialized since.
The 10 year-3 month spread is also a popular recession indicator and represents the relationship between long-term bonds and what’s often considered the risk-free interest rate. In late October, the 10 year-3 month spread turned negative for the first time since February 2020. It is now almost twice as negative as the 10-2 year spread.
Download Visual | Modify in YCharts
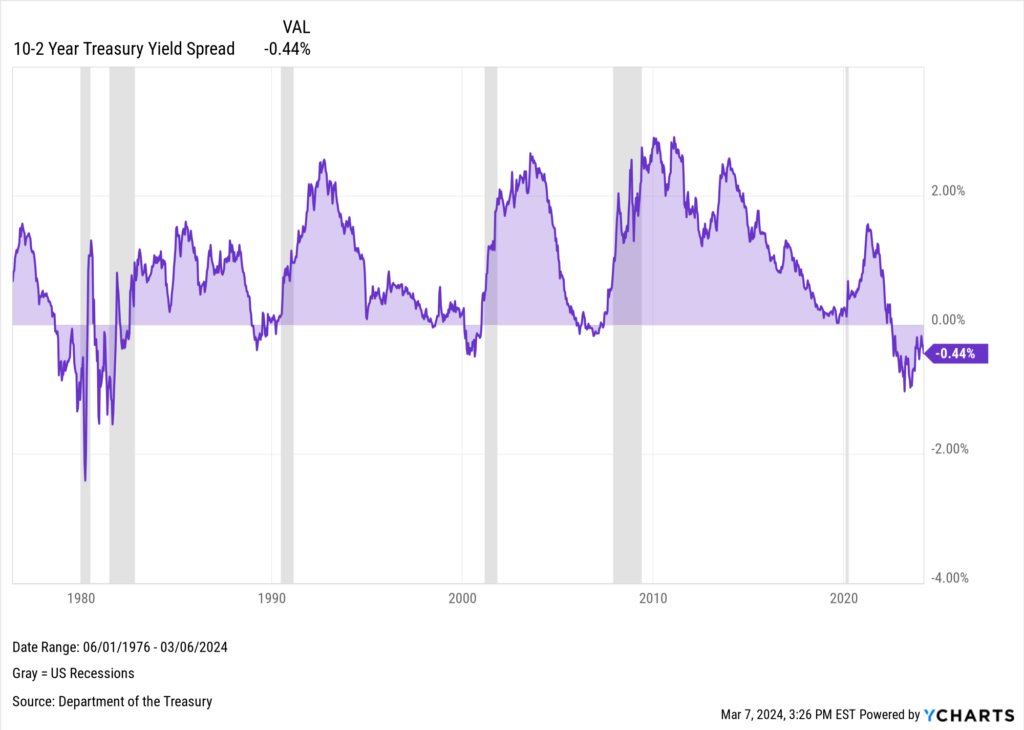
There have been six major US recessions since 1976, per the National Bureau of Economic Research’s definition (NBER). Represented by gray panels in the below chart, all six recessions were preceded by an inverted 10-2 spread lasting longer than two months, and each recession (other than the 2020 pandemic-induced one) occurred less than two years after the 10-2 spread first inverted.
Download Visual | Modify in YCharts
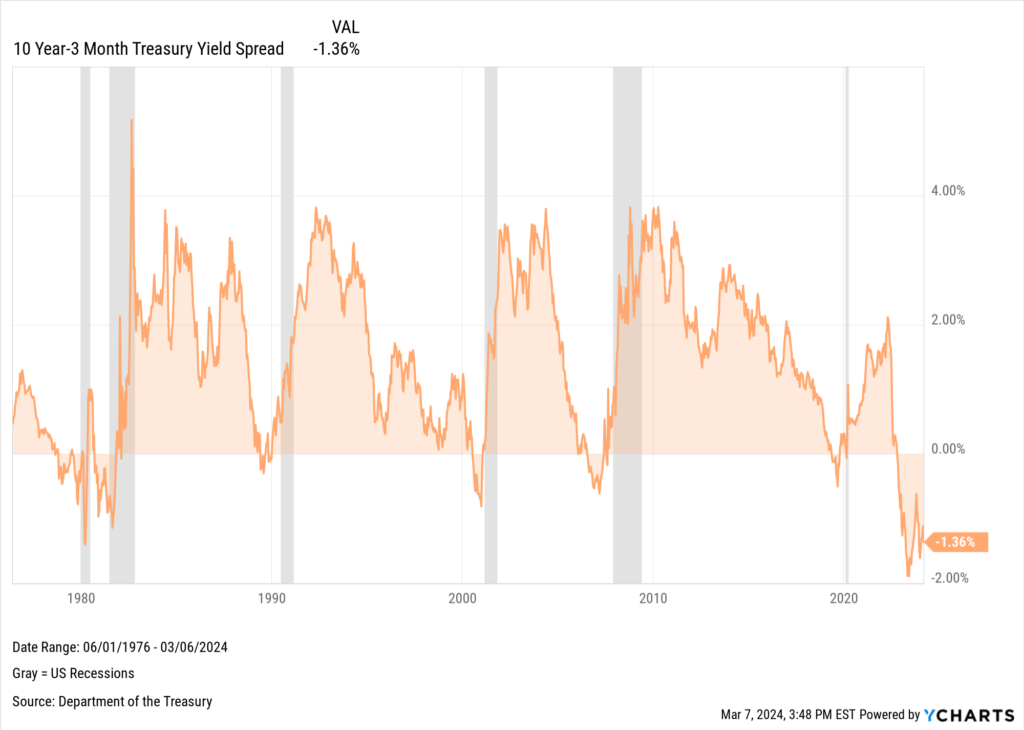
Historically, the 10 year-3 month spread hasn’t given warnings as early as the 10-2 year, but flipped negative before all 6 recessions as well. The one exception is 2020, where the 10 year-3 month spread turned negative almost twice as far in advance of the recession than the 10-2 year did.
Download Visual | Modify in YCharts
An inverted yield curve doesn’t necessarily mean a recession will happen at the snap of a finger. Nor have yield spreads historically stayed negative for very long. In fact, recessions don’t typically occur while the yield curve is inverted.
Instead, what often happens is that the yield curve starts to gradually “un-invert” shortly before a recession. This reversal is usually triggered by either rate cuts or the imminent possibility of them, leading to a decrease in short-term bond yields.
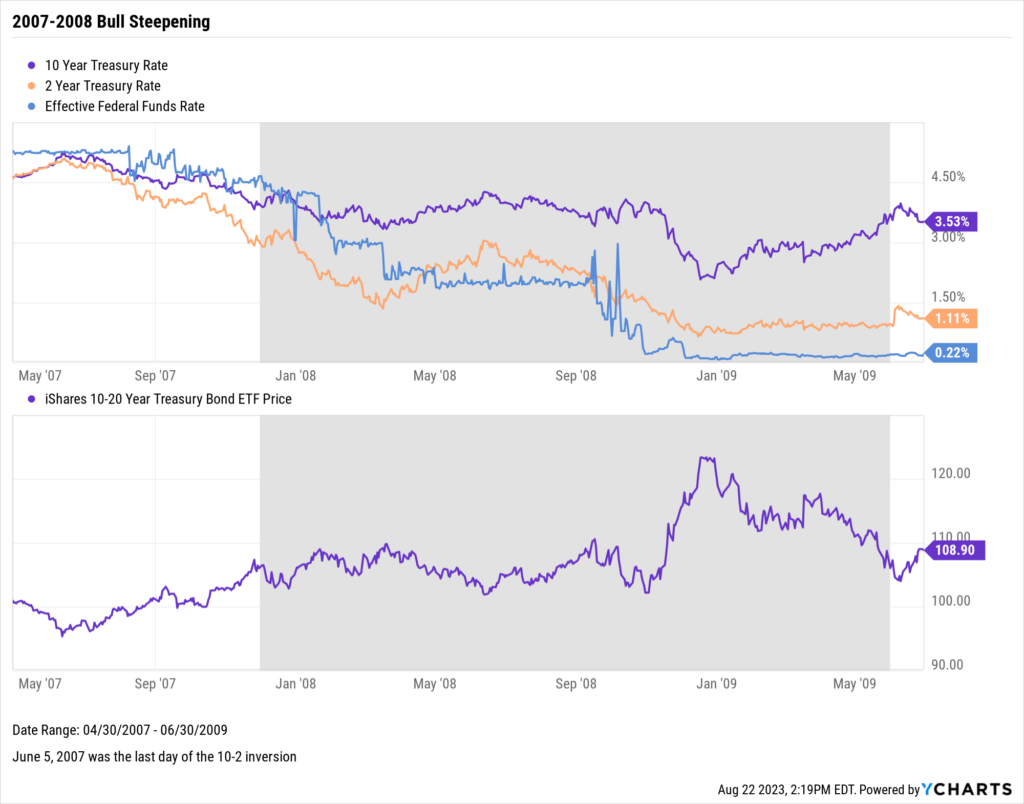
During the 2007-2009 recession, rate cuts or expected rate cuts triggered a surge in longer-term bond prices – illustrated by the iShares 10-20 Year Treasury Bond ETF (TLH) – leading to a decline in yields. Consequently, the yield curve normalized during this “bull steepening” event.
Download Visual | Modify in YCharts
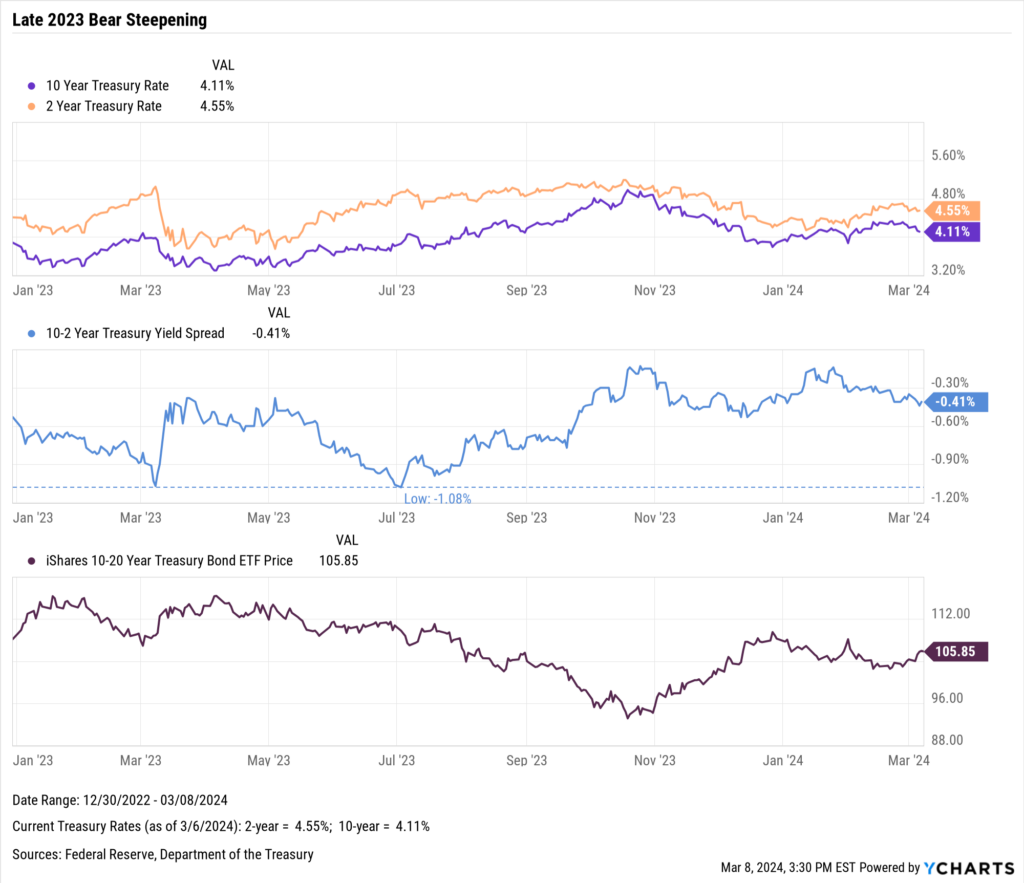
The price of TLH was on a downward trend heading into Q4 of 2023, accompanied by a notable surge in 10-year yields and less intensive rise in 2-year yields. This “bear steepening” resulted in a less inverted yield curve, albeit in an unconventional manner. These trends suggested investors were becoming more optimistic about the economy and lowered their expectations of future interest-rate cuts. Since then, the negative 10-2 spread narrowed and TLH rebounded as a result. Both TLH and the 10-2 spread have remained relatively range-bound for a few months.
Download Visual | Modify in YCharts
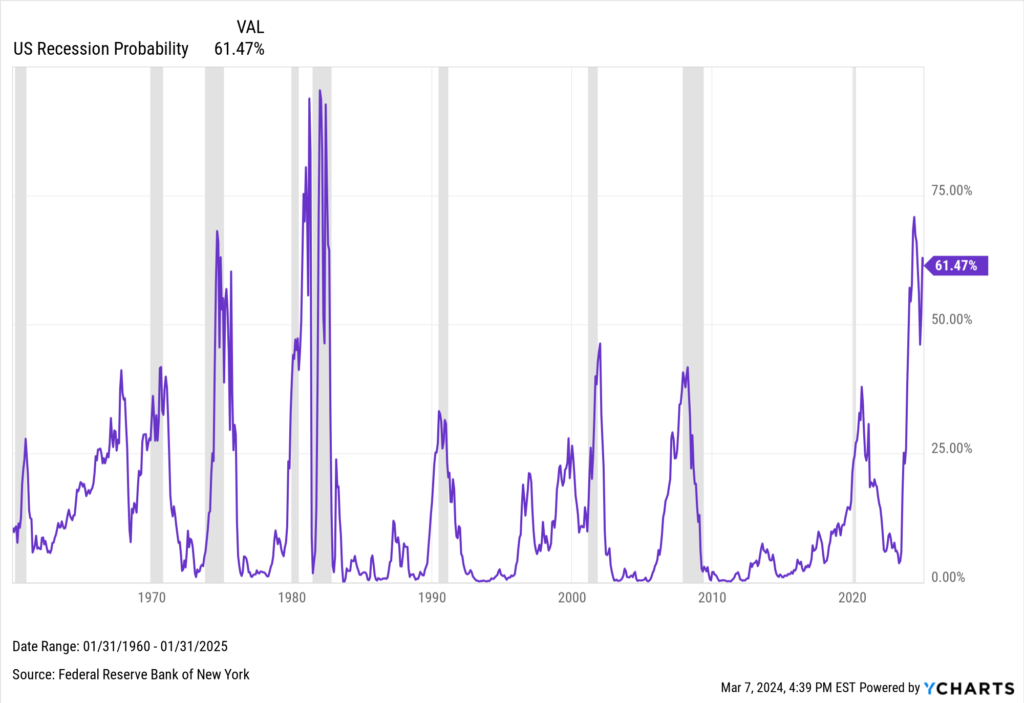
Analysts believe the yield curve could remain inverted longer than usual due to the large yield gap and strong economy. The conclusion of the inversion will reveal whether it is caused by falling interest rates or new bets on the economy’s strength.
Despite recent economic resilience, recessions have historically occurred within two years of a negative 10-2 spread. This, combined with achieving a technical recession by way of two consecutive quarters of negative GDP growth last year, explains the jump in near-term recession probability.
Download Visual | Modify in YCharts
How Consumers Can Be Affected by Inverted Yield Curves
Consumers seeking short-term loans tend to be worse off amidst an inverted yield curve. Interest rates rise and costs of borrowing go up, leading consumers to either pay higher prices or defer purchases and investments altogether.
This unfriendly environment tends to sour the consumer’s mood. Though yield curve inversions tend to precede recessions, decisions made by consumers can ultimately flip the switch and force the economy into contraction.
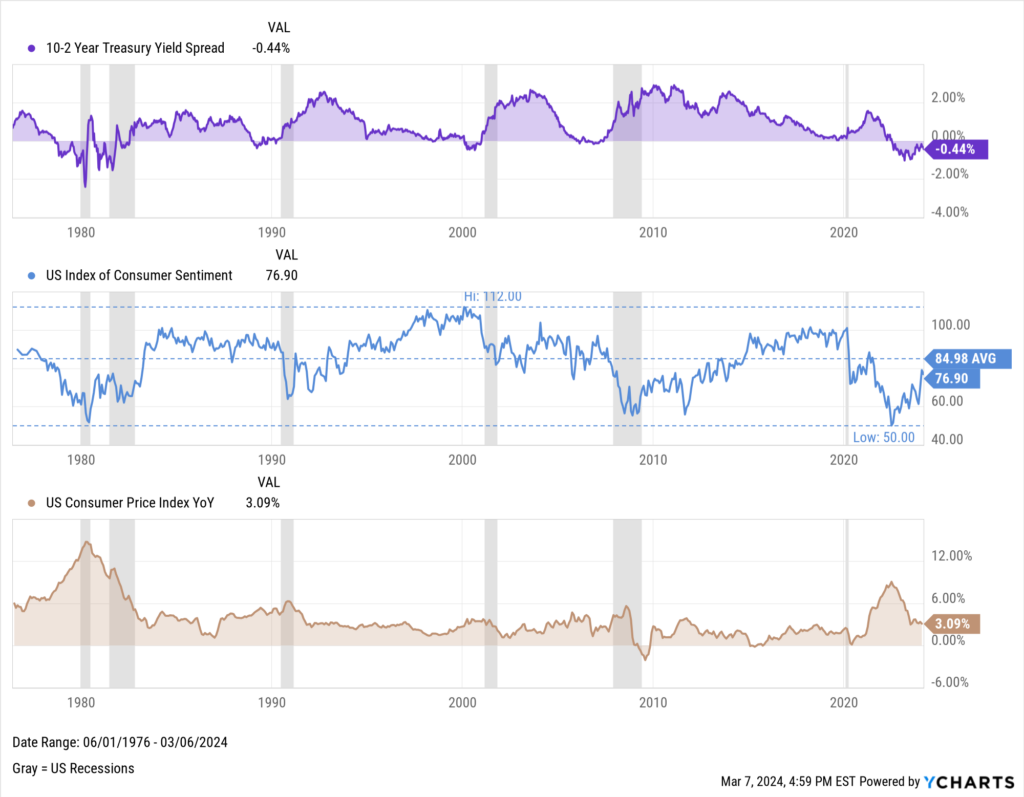
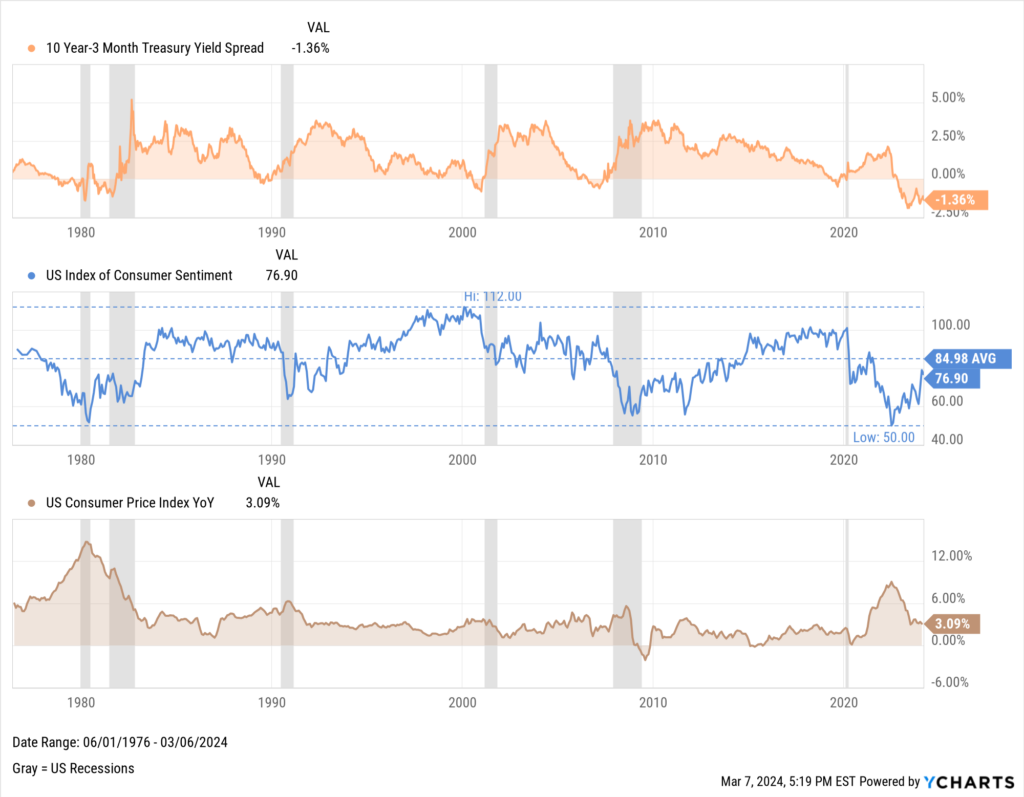
For each of the six recessionary periods listed above, and also at the time of an inverted 10-2 year or 10 year-3 month spread, the University of Michigan’s US Consumer Sentiment Index was either declining, below its historical average, or both. The same goes for the US Consumer Price Index, which was either on the rise, above its historical average, or both in all six periods.
The Consumer Sentiment Index hit an all-time low of 50 last June right as the 10-2 year spread turned negative and inflation peaked at 9%. The index is currently trending upward like it did following the last few recessions.
Download Visual | Modify in YCharts
Interestingly, the 10 year-3 month spread has remained firmly underwater despite the Consumer Sentiment Index marching optimistically higher. It seems the 10 year-3 month spread caught up to the reality of depressed consumer sentiment and the highest CPI in four decades, but continues to signal a negative economic outlook.
Download Visual | Modify in YCharts
How Equities Can Be Affected by Inverted Yield Curves
Companies in the business of short-term borrowing and long-term lending, such as banks, have historically underperformed when the yield curve inverts. Borrowing costs increase near-term, and profits get compressed when long-term loans are issued with less attractive rates.
Stocks bearing high dividend yields are also thought to be less attractive when short-term rates spike. Yield-seeking investors may flee equities in favor of shorter-term treasuries since payments can be captured without inheriting company risk.
On the flip side, companies that issue short-term loans would expect to see a bump in interest payments. The same goes for companies with large amounts of liquid assets. Two of the largest companies on earth, Apple (AAPL) and Berkshire Hathaway (BRK.B), have historically logged large figures on the Cash and Short-Term Investments lines of their respective balance sheets. When short-term rates rise, these companies can expect a greater return on any new short-term investments.
How Fixed Income Can Be Affected by Inverted Yield Curves
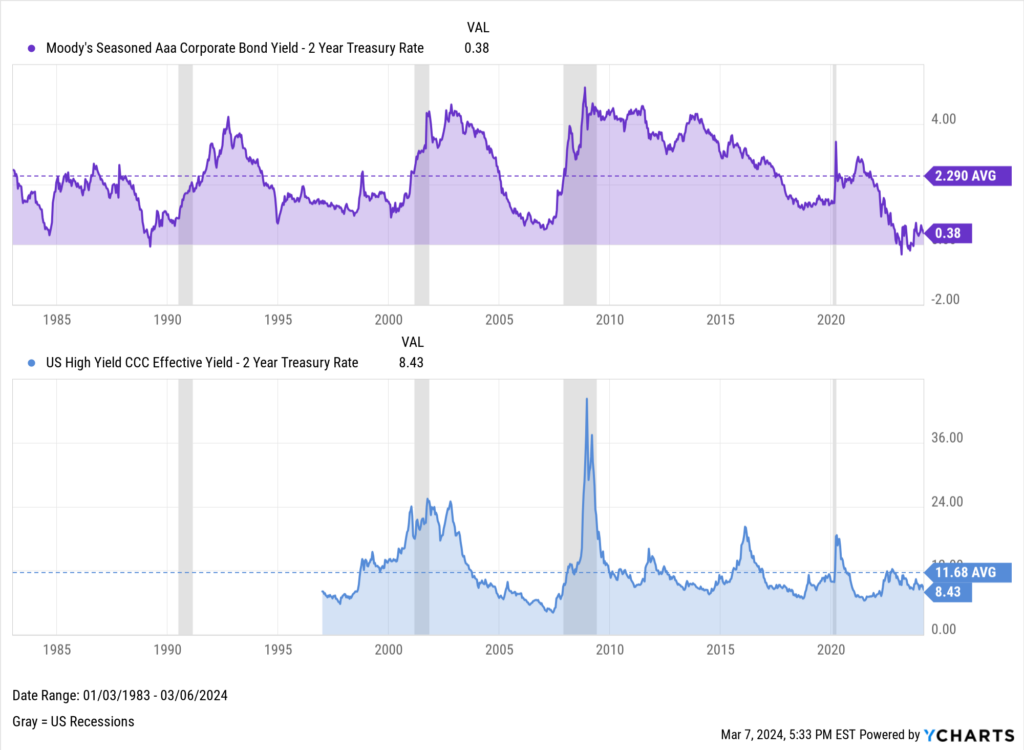
Inverted yield curves raise short-term US treasury yields closer to those of riskier bond types such as junk bonds, corporate bonds, and also real estate investment trusts (REITs). When the spreads between lower-risk US treasuries and these higher risk, non-Treasury backed securities contract, the US treasuries are seen as more attractive.
This chart of the Moody’s Aaa Corporate Bond vs. the 2 Year Treasury and High Yield Junk Bond vs. the 2 Year Treasury shows the narrowing spreads between these usually riskier instruments and short-term treasuries during yield curve inversions.
Download Visual | Modify in YCharts
When a flat or inverted yield curve lifts short-term treasury rates closer to or greater than long-term ones, this presents a situation in which investors could lock in a similar interest rate at a lower duration to maturity. One thing to note: if short-term rates continue rising, then that bond value would likely decrease. But, assuming the investor is willing to accept implied short-term risk and believes the issuer (the US government) won’t default, he or she might have an opportunity to achieve a greater effective yield from their cash.
How to Stay Ahead of Yield Curve Inversions
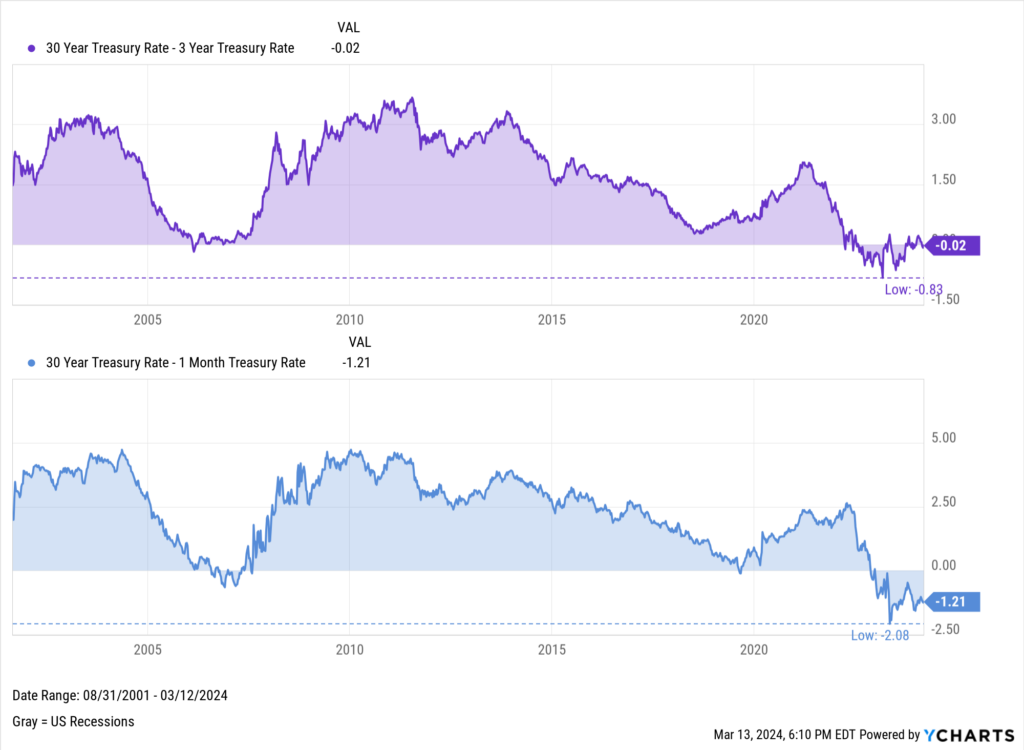
As noted above, YCharts has pre-built 10-2 year, 10 year-3 month, and 30-10 year spread indicators for tracking relationships between short and long-term treasuries. To dive deeper, you can plot the 30-Year/3-Year spread mentioned earlier, or go as wide as the 30-Year/1-Month spread to identify which fixed income instruments are headed for inversion:
Download Visual | Modify in YCharts
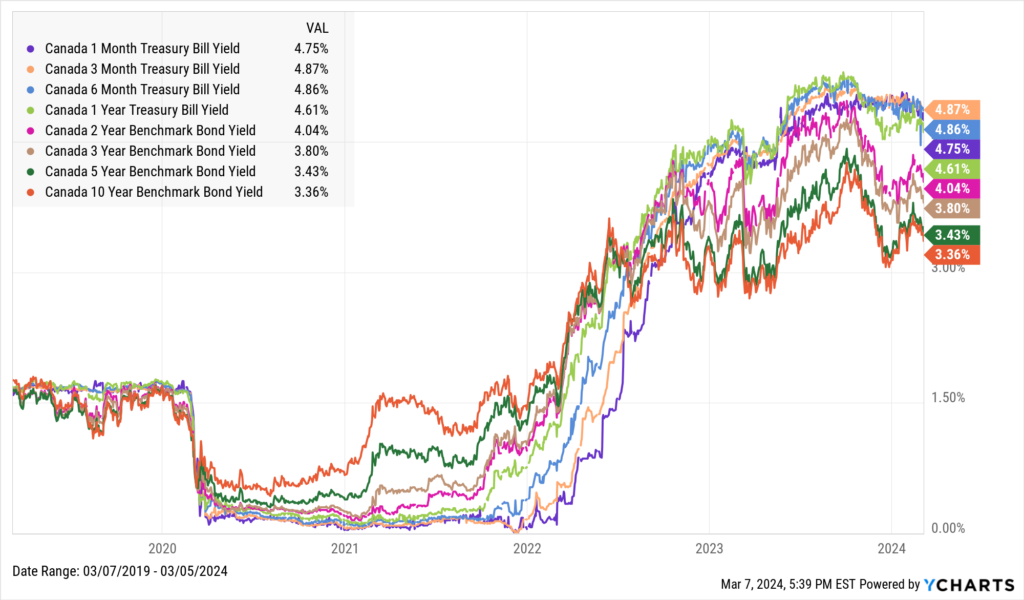
YCharts also contains all Canadian treasury bill and benchmark bond yield indicators. Similar to US treasuries, a Canadian yield curve can be constructed in YCharts as well, featuring durations as short as the Canadian 1-Month Treasury Bill all the way up to the 10-Year Benchmark Bond. The chart below shows the Canadian yield curve is currently inverted:
Download Visual | Modify in YCharts
The Bottom Line
The yield curve has been inverted since July 2022, but history has shown that any economic fallout following a yield curve inversion doesn’t happen immediately. Investors that take cues from the 10-2 year spread might look to the 10 year-3 month spread as well, as both have preceded all six recessions that have occurred dating back to 1980.
What’s perhaps peculiar is how long this particular inversion has lasted so far. The 10-2 year spread has been underwater for close to two years, and no recession has been recorded. At least, not yet.
Like any other market event, an inverted yield curve causes its own share of winners and losers. Investors who are prepared with a strategy fit to weather near-term events will eventually see the light at the end of the tunnel when the yield curve gets back to normal.
Whenever you’re ready, there are 3 ways YCharts can help you:
1. Looking for a tool that helps show the importance of market & economic events?
Email us at hello@ycharts.com or call (866) 965-7552.
2. Want to test out YCharts?
Start a 7-Day Free Trial.
3. Download a copy of the Top 10 Visuals for Client and Prospect Meetings slide deck:
Disclaimer
©2023 YCharts, Inc. All Rights Reserved. YCharts, Inc. (“YCharts”) is not registered with the U.S. Securities and Exchange Commission (or with the securities regulatory authority or body of any state or any other jurisdiction) as an investment adviser, broker-dealer or in any other capacity, and does not purport to provide investment advice or make investment recommendations. This report has been generated through application of the analytical tools and data provided through ycharts.com and is intended solely to assist you or your investment or other adviser(s) in conducting investment research. You should not construe this report as an offer to buy or sell, as a solicitation of an offer to buy or sell, or as a recommendation to buy, sell, hold or trade, any security or other financial instrument. For further information regarding your use of this report, please go to: ycharts.com/about/disclosure
Next Article
Income-Centric Equity ETFs: A YCharts Guide to Put Cash Back to WorkRead More →