Monthly Canada Market Wrap: September 2022
Welcome back to the Canadian Monthly Market Wrap from YCharts! Here, we break down the most important market trends for Canada-based advisors and their clients every month. As always, feel free to download and share any visuals with clients and colleagues, or on social media.
Starting December 1st, the Canadian Monthly Market Wrap will be offered exclusively as a Dashboard Template within YCharts. All data and visuals from the Canadian Monthly Market Wrap can be accessed from the YCharts Dashboard, by clicking Manage > Dashboard Templates > selecting the “Canadian Markets” template.
The US Market Wrap will continue to be published each month in its current form. Looking for the US Market Wrap? Click here.
Canada Market Summary for September 2022
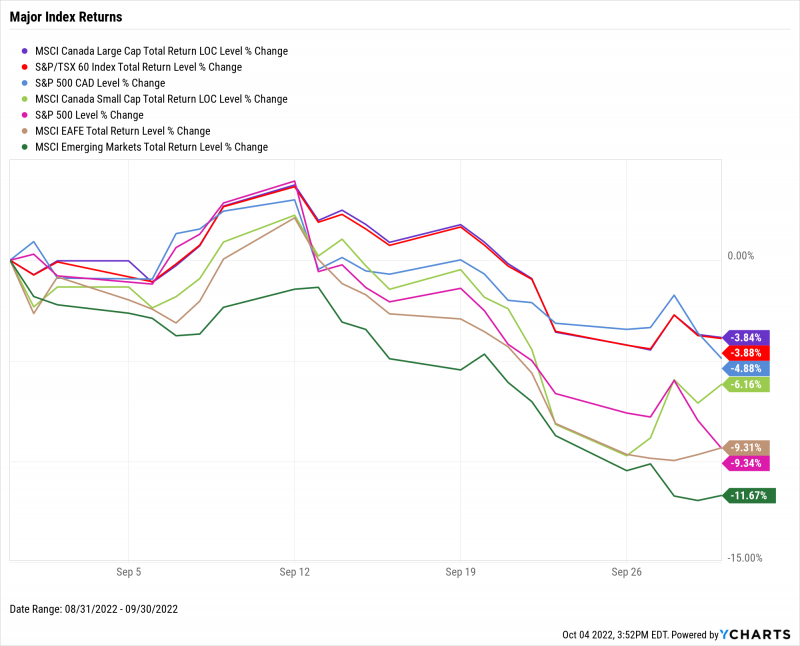
Canadian stocks held up relatively well in what was a rough September for equities globally. The S&P/TSX 60 index ended September down 3.9%, while Canadian Large Caps fell 3.8% and Canadian Small Caps finished the month 6.2% lower. South of the border, the S&P 500 index fell 9.2% (-4.9% in CAD) and the MSCI EAFE global developed-market index was off by a similar amount. Persistent inflation, along with further rate hikes by the Federal Reserve and Bank of Canada, will set the tone for a Q3 earnings season that’s also overshadowed by elevated global recession risk.
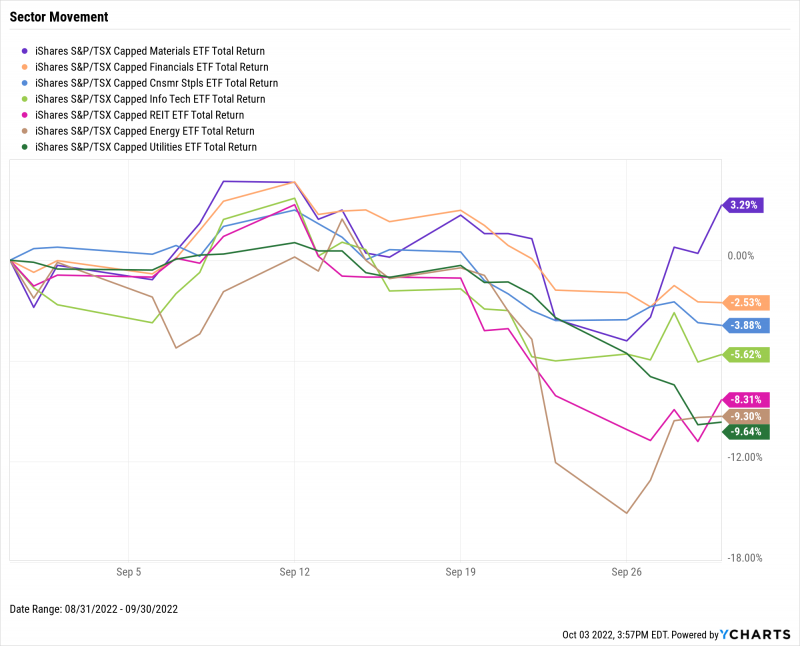
Only Materials were positive in September across TSX sectors, while Utilities and Energy each declined by over 9%. The REIT sector ended September 8.3% lower as well due in part to a Canada Mortgage and Housing Corporation (CMHC) forecast that showed home prices may fall as much as 15%.
The unemployment rate climbed to 5.4% in September. Despite the bleak month for unemployment and equities, there were some bright spots. The Canadian Inflation Rate cooled down and the Canada Ivey PMI exited contraction territory with a double-digit point increase to 60.9. Lastly, prices for new homes rose at their smallest clip since April 2020.
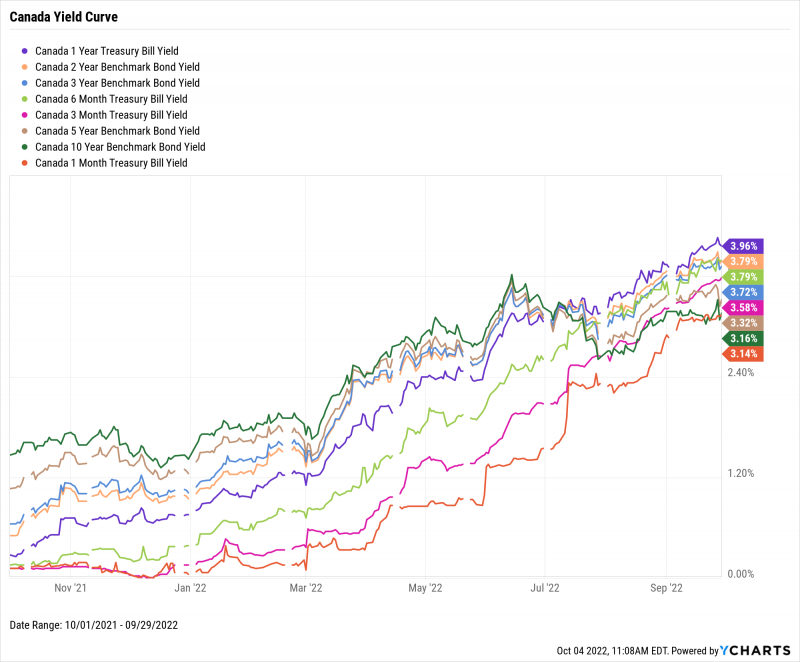
1-Year Treasury Bills boasted the highest yield of any Canadian treasury instrument, reaffirming the fact that the yield curve remains inverted. The 1-Year Treasury Bill is the only instrument to have eclipsed a yield of 4%. Yield on the longest-duration Canadian fixed income instrument, the 10-Year Benchmark Bond, is only 19 basis points higher than the shortest-duration 1-Month Treasury Bill.
Jump to Fixed Income Performance
Equity Performance
Major Indexes
Download Visual | Modify in YCharts | View Below Table in YCharts
Canadian Sector Movement
Download Visual | Modify in YCharts | View Below Table in YCharts
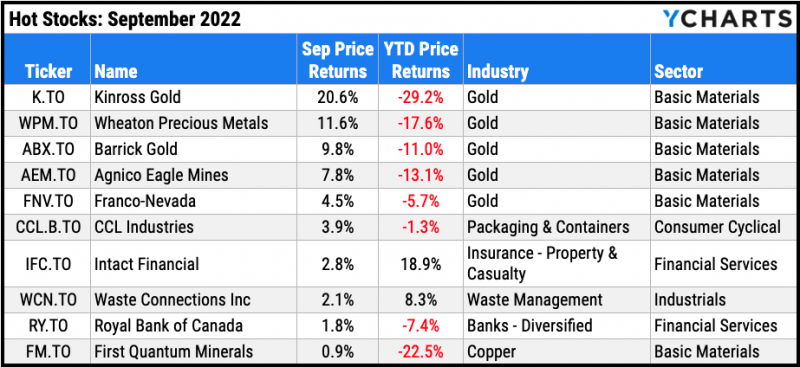
Hot Stocks: Top 10 TSX 60 Performers of September 2022
Kinross Gold (K.TO): 20.6% gain in September
Wheaton Precious Metals (WPM.TO): 11.6%
Barrick Gold (ABX.TO): 9.8%
Agnico Gold Mines (AEM.TO): 7.8%
Franco-Nevada (FNV.TO): 4.5%
CCL Industries (CCL.B.TO): 3.9%
Intact Financial (IFC.TO): 2.8%
Waste Connections Inc (WCN.TO): 2.1%
Royal Bank of Canada (RY.TO): 1.8%
First Quantum Minerals (FM.TO): 0.9%
Download Visual | Modify in YCharts
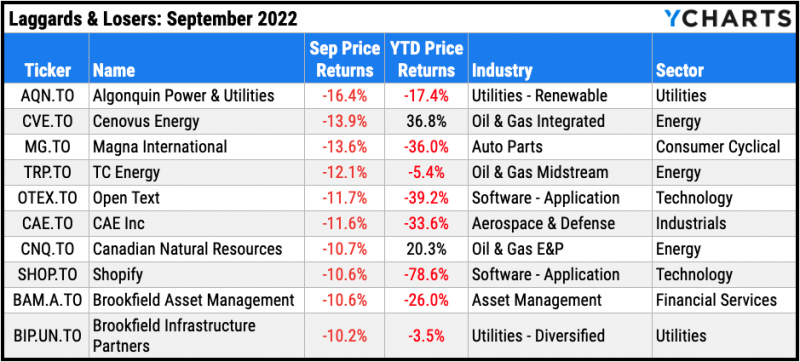
Laggards & Losers: 10 Worst TSX 60 Performers of September 2022
Algonquin Power & Utilities (AQN.TO): -16.4% decline in September
Cenovus Energy (CVE.TO): -13.9%
Magna International (MG.TO): -13.6%
TC Energy (TRP.TO): -12.1%
Open Text (OTEX.TO): -11.7%
CAE Inc (CAE.TO): -11.6%
Canadian Natural Resources (CNQ.TO): -10.7%
Shopify (SHOP.TO): -10.6%
Brookfield Asset Management (BAM.A.TO): -10.6%
Brookfield Infrastructure Partners (BIP.UN.TO) -10.2%
Download Visual | Modify in YCharts
Featured Market & Advisor News
Housing slump, economic angst sink consumer confidence in Canada (BNN)
Puru Saxena’s State of the Markets: How Will 2022 End? (YCharts)
Wave of retirement hits Canadian workforce as health care, education lose workers (Advisor’s Edge)
What 5 Measures of Market Valuation Are Saying Right Now (YCharts)
Home prices to fall as much as 15%: CMHC forecast (Financial Post)
How Well Does the “Buffett Indicator” Predict Market Crashes? (YCharts)
Economic Data
Employment
The Canadian unemployment rate reversed off its all-time low, bouncing back to 5.4% in August. However, the Canada Ivey Employment index grew 8.0% MoM. Canada also logged a gain of 37,000 part-time workers in August.
Production and Sales
The Canada Ivey PMI rebounded out of contraction territory, advancing 11.3 points in August. Last month’s reading of 49.6 marked the manufacturing sector’s first contractionary reading since December 2021, and August’s positive print comes at a time when the US ISM Manufacturing PMI nearly registered a contraction. Despite the positive manufacturing data, Canada Retail Sales fell 2.5% in July, and Canada Real GDP inched just 0.1% higher.
Housing
Canadian home prices grew by 0.08% for the second straight month, on average. This marks the 32nd consecutive month in which the Canada New Housing Price Index has risen, but at the slowest pace since April 2020.
Consumers and Inflation
The Canadian Inflation Rate cooled off for the second month in a row, down to 7.01%. Canada’s Consumer Price Index rose by just 0.07% in August, the smallest clip since August 2020.
Gold
The price of gold in Canadian Dollars rose 2.2% in September to C$2,297.10 per ounce. Gold-related securities were major beneficiaries—the top five TSX performers were all gold companies, and the iShares S&P/TSX Global Gold ETF (XGD.TO) surged 8.5% in September. Notably, Kinross Gold (K.TO) announced an enhanced share buyback program, helping it become the TSX’s top performer in September.
Oil
Crude oil prices continued to tumble in September. The spot price for WTI at the end of September was $77.17 USD and $82.55 USD for Brent. Both oil benchmarks fell over 14% in price to their lowest levels since the start of 2022. Monthly Retail Sales among Canadian Gasoline Stations fell considerably from its June high of C$8.12 billion to C$6.90 billion in July, according to the latest data available.
Cryptocurrencies
While Canadians gear up to build those backyard hockey rinks, Bitcoin and Ethereum holders can’t wait for an end to the “crypto winter”. The price of Bitcoin stayed below $20,000 USD and slipped 1.2% in September to $19,56 USD as of month’s end. Ethereum plummeted 12.4% to settle at $1,336 USD. Binance Coin holders enjoyed a second consecutive month of small gains, though year-to-date performance remains firmly in the red. Binance Coin is 45.0% lower YTD, Bitcoin is down 59.6%, and Ethereum is off 65.6%.
Fixed Income Performance
Canadian Treasury Yield Curve
Canada 1 Month Treasury Bill Yield: 3.14%
Canada 3 Month Treasury Bill Yield: 3.58%
Canada 6 Month Treasury Bill Yield: 3.79%
Canada 1 Year Treasury Bill Yield: 3.96%
Canada 2 Year Benchmark Bond Yield: 3.79%
Canada 3 Year Benchmark Bond Yield: 3.72%
Canada 5 Year Benchmark Bond Yield: 3.32%
Canada 10 Year Benchmark Bond Yield: 3.16%
Download Visual | Modify in YCharts
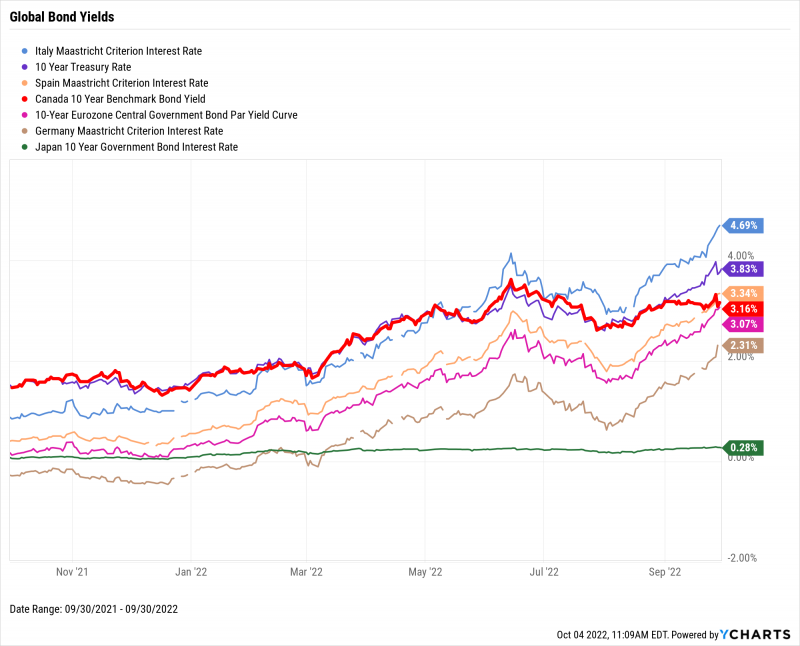
Global Bonds
Italy Long Term Bond Interest Rate: 4.69%
10 Year Treasury Rate: 3.83%
Spain Long Term Bond Interest Rate: 3.34%
Canada 10 Year Benchmark Bond Yield: 3.16%
10-Year Eurozone Central Government Bond Par Yield: 3.07%
Germany Long Term Bond Interest Rate: 2.31%
Japan 10 Year Government Bond Interest Rate: 0.28%
Download Visual | Modify in YCharts
Have a great October! 📈
Next Article
Puru Saxena’s State of the Markets: How Will 2022 End?Read More →