Monthly Market Wrap: August 2022
Welcome back to the Monthly Market Wrap from YCharts, where we review and break down the most important market trends for advisors and their clients every month. As always, feel free to download and share any visuals with clients and colleagues, or on social media.
Want the Monthly Market Wrap sent straight to your inbox? Subscribe below:
Are you based in Canada or following Canadian markets? Check out and subscribe to the Monthly Canada Market Wrap from YCharts.
August 2022 Market Summary
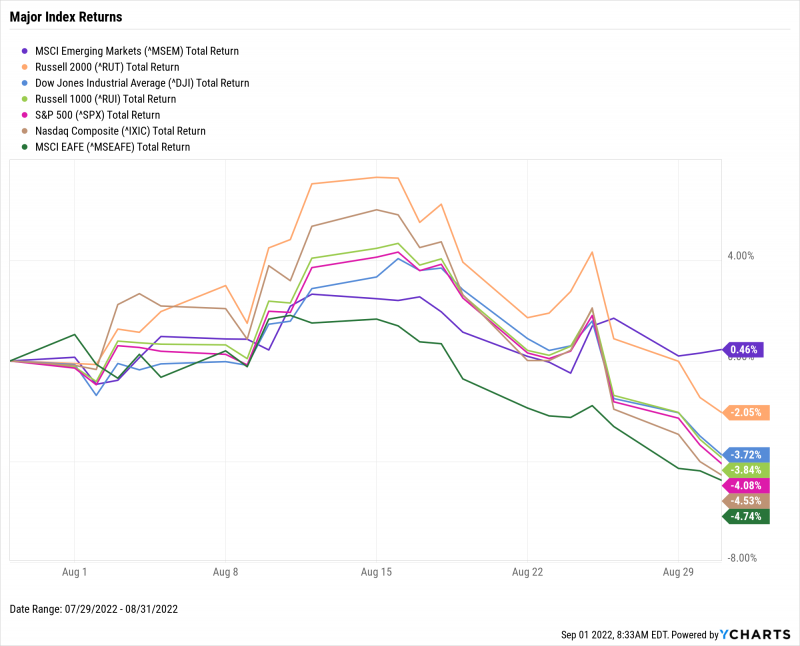
The “summer rally” fizzled out in August as most equities drifted lower. The Dow Jones Industrial Average ended August down 3.7%, the S&P 500 fell 4.1%, and the NASDAQ was off 4.5%. Remarks made in late August by Federal Reserve Chair Jerome Powell suggested the central bank will continue hiking interest rates to combat inflation and stabilize prices. Jay-Pow’s address soured the so-called “summer rally” that started in July following a Q2 earnings season that broadly beat Wall Street expectations. Year-to-date, the Dow is off 12.0%, the S&P 500 is 16.1% lower, and the NASDAQ is firmly back in bear market territory, down 24.1%.
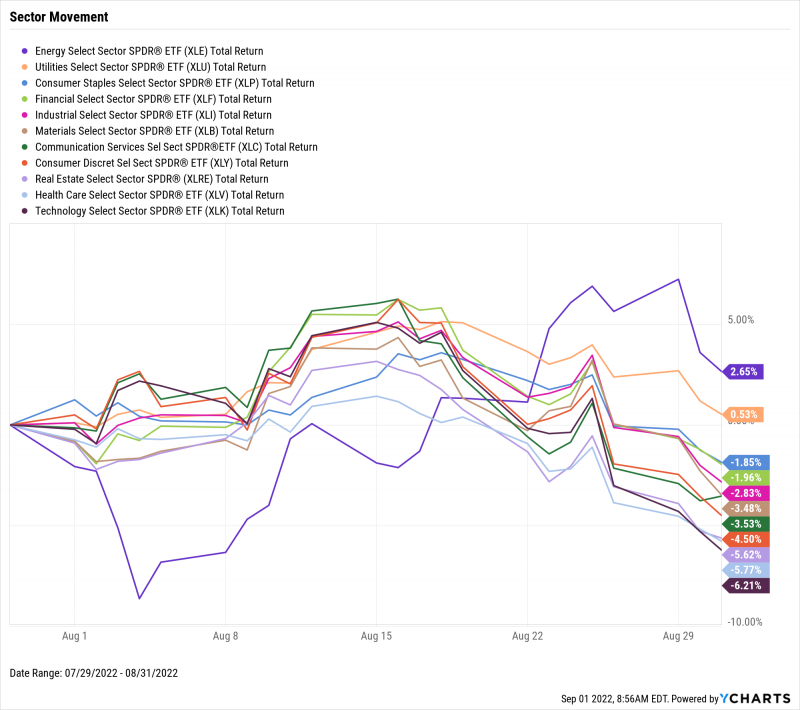
Only two sectors were positive in August. Energy finished up 2.7% even as crude oil and retail gas prices fell, while Utilities inched 0.5% higher. Cyclical sectors were hurt the most—Communication Services, Consumer Discretionary, Real Estate, and Technology all slipped between 3.5% and 6.2%. Interestingly, Health Care was second-worst on the month, despite being a historically rate-proof sector.
Further signs of decay emerged in the housing market as new and existing home sales both declined, and for the sixth time in the last seven months. The latest data from July shows US New Single-Family Home Sales tumbled 12.7%, while Existing Home Sales fell nearly 6%. On the inflation front, July’s inflation rate fell to 8.52%, while core inflation stayed about flat month-over-month at 5.9%. Finally, the average US gas price hasn’t started with a “$3” since February 28th—that changed in August, as gas prices clocked in at $3.94 by month’s end.
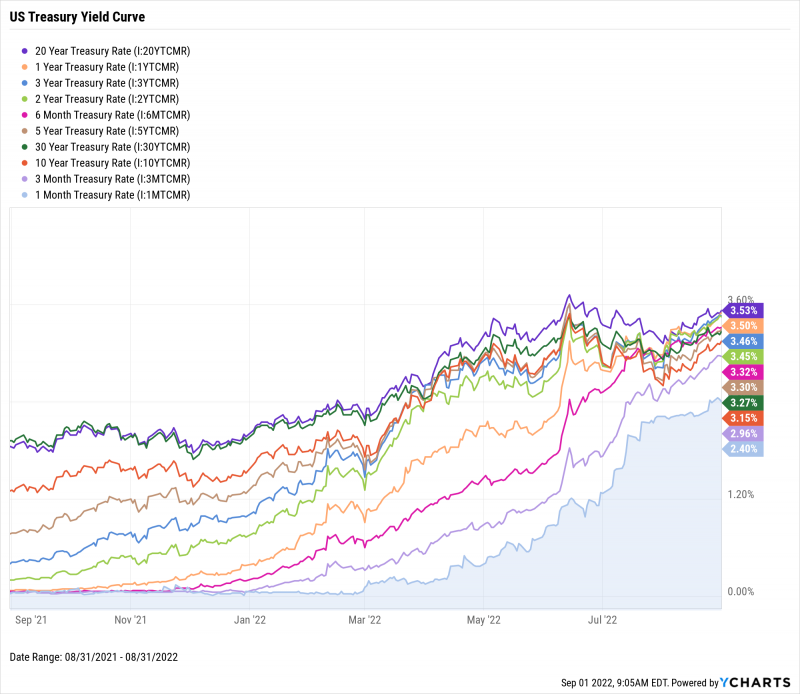
The 1-Year T-Bill sported the second-highest rate among US Treasuries as of August 31st. Only the 20-Year Bond’s 3.53% yield was higher than the 1-Year’s 3.50%. Seven of the nine US treasury instruments closed out August with rates above 3%, and the 1-Month T-Bill neared its relative high of 2.51% set in March 2019. In spreads, the widely-followed 10-2 Year Spread was inverted by 30 basis points, while the 10 Year-3 Month Spread continues to float just above negative territory.
Jump to Fixed Income Performance
Off the YCharts! Does Negative Earnings Growth Really Predict Market Crashes?
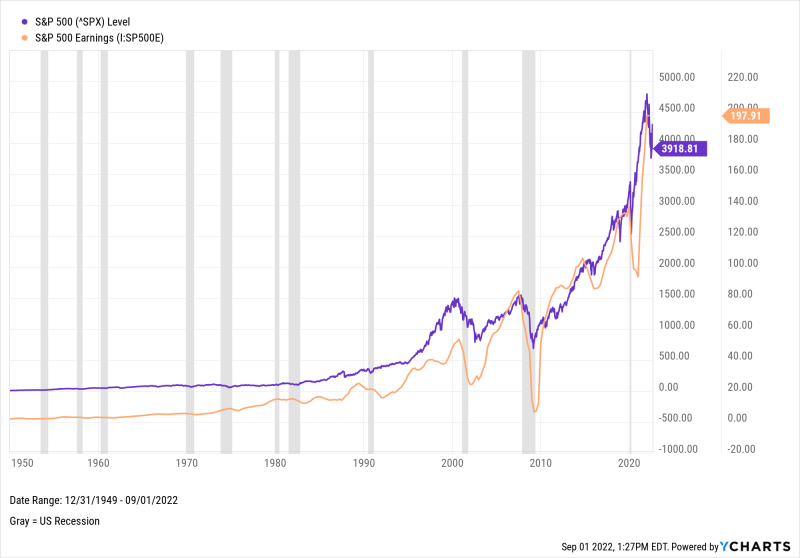
In our new white paper, Which Leading Indicators Best Predict Market Declines?, we studied how reliable—or unreliable—seven commonly-used valuation indicators are for predicting market declines. We also looked at each indicator’s correlation strength with 1Y, 3Y, and 5Y S&P 500 forward returns to test their efficacy.
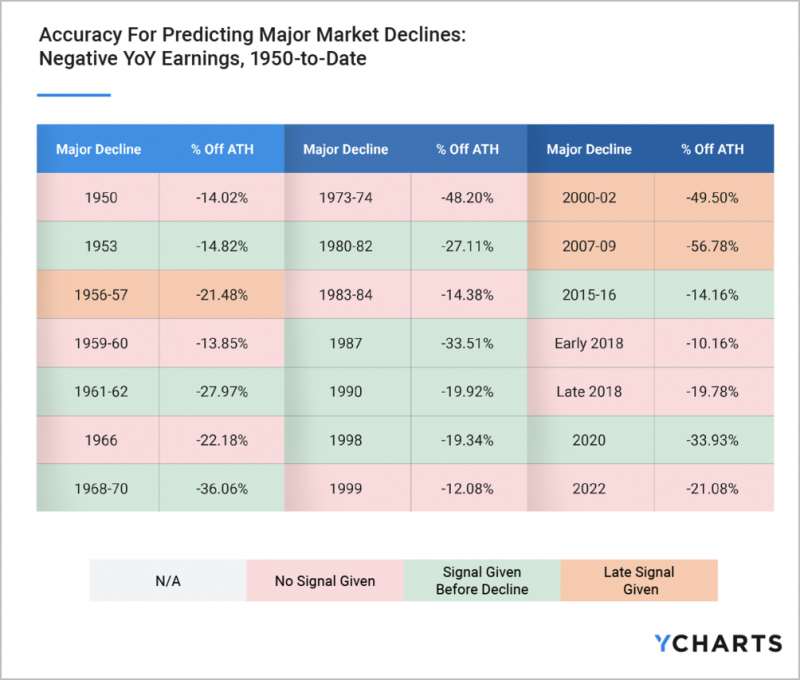
One of those indicators was year-over-year growth of S&P 500 Earnings. We found that Negative S&P 500 YoY Earnings Growth gave warning to 9 of 21 major market declines since 1950 (43% success rate). The indicator also provided a late warning to three other market declines, notably those surrounding the Dot-com Bubble (late by 10 months) and the Great Financial Crisis (1 month late). Historically speaking, S&P 500 YoY Earnings have gone negative 17.6 months before the start of a major decline, on average.
Download Visual | Modify in YCharts
Download the new White Paper—which also looks at S&P 500 PE Ratio, CAPE Ratio, The “Buffett Indicator”, Inverted Yield Spreads Tobin’s Q—for our full findings:
Equity Performance
Major Indexes
Download Visual | Modify in YCharts | View Below Table in YCharts
Value vs. Growth Performance, Trailing Twelve Months
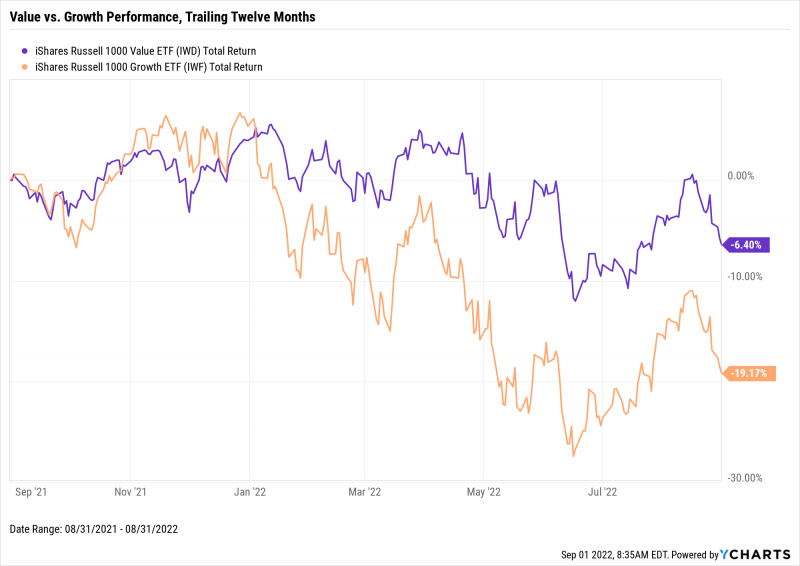
Value stocks, represented by the iShares Russell 1000 Value ETF (IWD), fell 3% in August and are down 6.4% on a TTM basis. The equity style eclipsed positive territory midway through August but failed to sustain those gains amid a stallout in the summer rally. Its Growth (IWF) counterpart sank 4.7%, putting it near bear market territory over the last twelve months.
Value is down 10% on a year-to-date basis while Growth has sunk 23.3% since the start of 2022. For comparison, the S&P 500 is 16.1% lower YTD.
Download Visual | Modify in YCharts
US Sector Movement
Download Visual | Modify in YCharts | View Below Table in YCharts
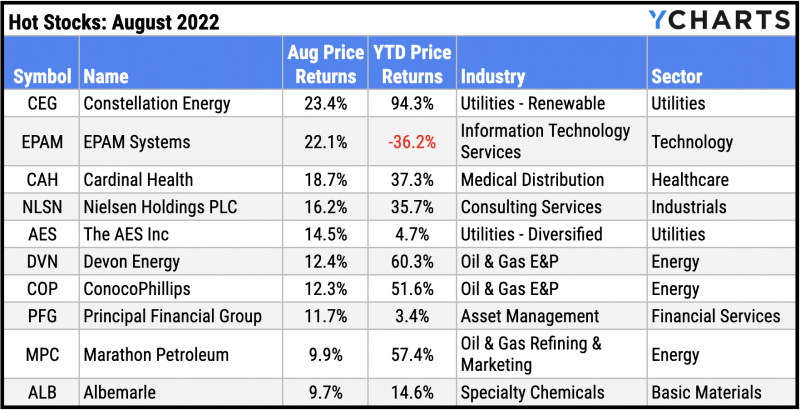
Hot Stocks: Top 10 S&P 500 Performers of August 2022
Constellation Energy (CEG): 23.4% gain in August
EPAM Systems (EPAM): 22.1%
Cardinal Health (CAH): 18.7%
Nielsen Holdings PLC (NLSN): 16.2%
The AES Inc (AES): 14.5%
Devon Energy (DVN): 12.4%
ConocoPhillips (COP): 12.3%
Principal Financial Group (PFG): 11.7%
Marathon Petroleum (MPC): 9.9%
Albemarle (ALB): 9.7%
Download Visual | Modify in YCharts
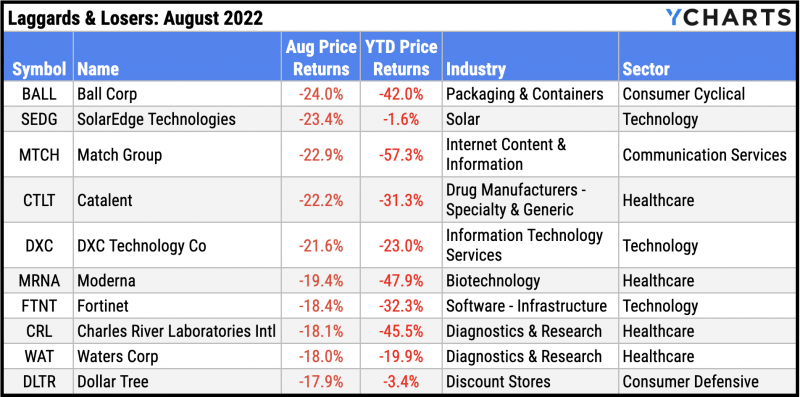
Laggards & Losers: 10 Worst S&P 500 Performers of August 2022
Ball Corp (BALL): -24.0% decline in August
SolarEdge Technologies (SEDG): -23.4%
Match Group (MTCH): -22.9%
Catalent (CTLT): -22.2%
DXC Technology Co (DXC): -21.6%
Moderna (MRNA): -19.4%
Fortinet (FTNT): -18.4%
Charles River Laboratories International (CRL): -18.1%
Waters Corp (WAT): -18.0%
Dollar Tree (DLTR): -17.9%
Download Visual | Modify in YCharts
Economic Data
Employment
The unemployment rate dropped 0.1 percentage point in July to 3.5%, tying its pre-pandemic low from February 2020. July 2022 also marked just the second time since December 1969 that the unemployment rate was 3.5%. However, the labor force participation rate fell for the second straight month to 62.1%. Labor force participation now sits 1.3 percentage points below its February 2020 high, and 5.2 points off its all-time high of 67.3% set in April 2000. At the state level, unemployment either dropped or remained unchanged across a list of 10 major states. Florida and Georgia recorded respective unemployment rates of 2.7% and 2.8% in July, while levels in New York, North Carolina, and Ohio held flat month-over-month.
Production and Sales
July saw little activity across both Production and Sales. MoM US Retail and Food Services Sales were flat in July. In manufacturing, the US ISM Manufacturing PMI reading edged down 0.2 points to 52.80. Though the ISM Manufacturing PMI is down six points YTD, levels above 50 indicate manufacturing activity as a whole is expanding. Lastly, revised Real GDP data showed the US economy contracted by -0.6% in Q2 2022. This marks an improvement from the initial -0.9% print, but it’s still the second consecutive quarter of declining GDP, meeting the technical definition of a recession.
Housing
Fears of a “housing recession” were exacerbated in July as MoM US New Single-Family Home Sales plummeted 12.7% in July. Sales of new single-family homes have declined six out of the last seven months, with July’s reading being the most severe decline among them. July’s Existing Home Sales decline of 5.9% in July added to those worries, falling for the sixth straight month. Existing Home Months’ Supply surged to 3.3, its highest level in two years. The slowdown in housing finally reversed the direction of home prices—after months of trending upward, the US Existing Home Median Sales Price fell 2.4% in July to $403,800.
Consumers and Inflation
July’s US Inflation Rate came in at 8.52%. Though still well above its historical averages, July’s inflation print is 0.56 percentage points lower than the month prior. US Core Inflation for July remained essentially unchanged at 5.92%. The US Consumer Price Index was also flat in July following the largest MoM change since September 2005. Finally, personal spending was up 0.14% in July.
Gold
The Price of Gold fell ever so slightly in August to $1,751.30 per ounce as of August 26th. Gold-related investment vehicles logged a losing month as well. The SPDR Gold Shares ETF (GLD) slipped 2.9% in July, and the VanEck Gold Miners ETF (GDX) tumbled 9.4% amid disappointing earnings reported by some of the fund’s largest constituents. Most notable was Newmont (NEM), who alone makes up 12.5% of GDX. Gold is down 3% year-to-date.
Oil
Crude oil prices slumped in August. The per-barrel spot price for WTI at the end of August was $97.40 (-3.9% MoM) and $101.13 for Brent (-9.0% MoM). As a result, the average price of regular gas in the US fell below $4 for the first time since February 28th to $3.94 per gallon. Premium gas also fell for the eleventh straight week to $4.65 per gallon. Though the average gallon of regular gas is still 16.5% more expensive year-to-date, drivers ought to welcome gas stations turning the first number on their signs from a “4” to a “3”.
Cryptocurrencies
2022 has been dubbed a “crypto winter”, and August was a chilly month for Bitcoin and Ethereum holders. The price of Bitcoin breached $20,000 and tumbled 16.9% in August to $19,805 as of month’s end. Ethereum ended August down 11.5% to settle at $1,525.40. Binance Coin actually rose 1.8% in value to $281.29 as of August 31st, though year-to date performance remains firmly in the red. Binance Coin is 45.7% lower YTD, Bitcoin is down 58.0%, and Ethereum is off 58.9%.
Featured Market & Advisor News
Cathie Wood’s ARKK Sees Biggest Monthly Outflow In Nearly A Year (FA-Mag)
Do Inverted Yield Spreads Really Predict Market Declines? (YCharts)
Inflationary trend lands advisors in unfamiliar territory (InvestmentNews)
New on YCharts: ESG Visuals for Stocks, ETFs, and Mutual Funds (YCharts)
ETF Takeover of Wall Street Deepens as Debt Funds Are OK’d as Collateral (WealthManagement.com)
7 Best Asset Classes to Hedge Against Inflation (YCharts)
Fixed Income Performance
US Treasury Yield Curve
1 Month Treasury Rate: 2.40%
3 Month Treasury Rate: 2.96%
6 Month Treasury Rate: 3.32%
1 Year Treasury Rate: 3.50%
2 Year Treasury Rate: 3.45%
3 Year Treasury Rate: 3.46%
5 Year Treasury Rate: 3.30%
10 Year Treasury Rate: 3.15%
20 Year Treasury Rate: 3.53%
30 Year Treasury Rate: 3.27%
Download Visual | Modify in YCharts
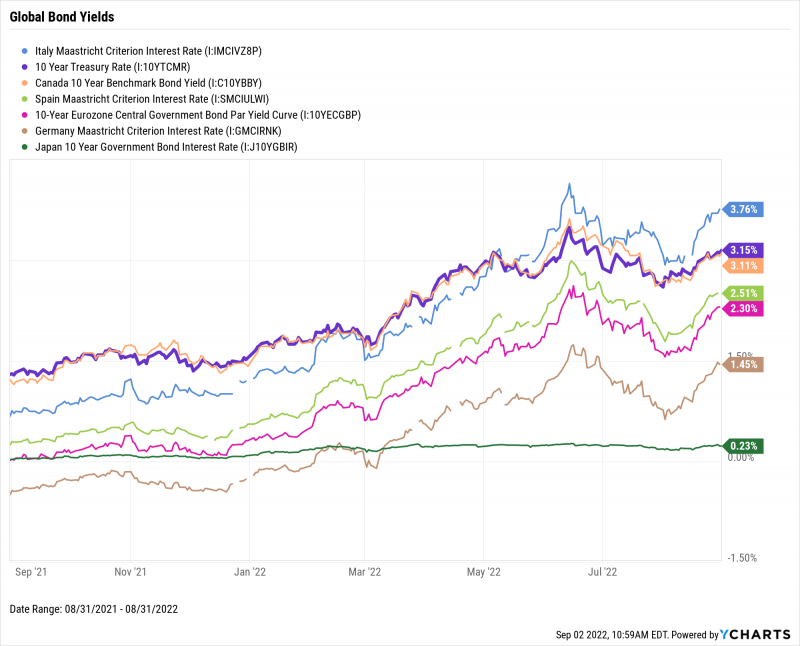
Global Bonds
Italy Long Term Bond Interest Rate: 3.76%
10 Year Treasury Rate: 3.15%
Canada 10 Year Benchmark Bond Yield: 3.11%
Spain Long Term Bond Interest Rate: 2.51%
10-Year Eurozone Central Government Bond Par Yield: 2.30%
Germany Long Term Bond Interest Rate: 1.45%
Japan 10 Year Government Bond Interest Rate: 0.23%
Download Visual | Modify in YCharts
Have a great September! 📈
If you haven’t yet, subscribe to the YCharts Monthly Market Wrap here: