Monthly Market Wrap: February 2022
Welcome back to the Monthly Market Wrap from YCharts, where we break down the most important market trends for advisors and their clients every month. As always, feel free to download and share any visuals with clients and colleagues, or on social media.
Want the Monthly Market Wrap sent straight to your inbox? Subscribe below:
Are you based in Canada or following Canadian markets? Check out and subscribe to the Monthly Canada Market Wrap from YCharts.
February 2022 Market Summary
Equities continued to slide lower, with the S&P 500 falling 3% and the Nasdaq 3.4%. Once again, Energy was the only positive sector in February, adding another 7.1% to last month’s 18.8% surge. Interest rate-sensitive sectors such as Communication Services, Technology, and Real Estate took the worst hits in February.
Treasury rates got a big boost in February as investors fled to safety, largely due to uncertainty caused by the Russian invasion of Ukraine. T-Bills (1-Month Treasury Rate) doubled from 0.03% to 0.06%, while the 2-Year gained 26 basis points, the most of any US treasury rate, up from1.52% to 1.79%. Federal Reserve officials also signaled a March rate hike is still the plan. Around the world, the yields of both Canada’s and Italy’s long-term bonds surpassed the US 10-Year, while Germany’s long-term rate re-entered positive territory.
Jump to Fixed Income Performance
Inflation climbed for the fifth straight month, registering a level of 7.5%. The price of gold rose by 5% in February, and oil continued its climb toward $100. In the housing market, the number of new single-family houses sold receded 4.5% month-over-month, yet the supply of existing homes reached another all-time low.
Off the YCharts! Coming Back Down to Earth
The old saying, “what goes up must come down,” is generally (and hopefully) not true for long-term investors. While the overall market has an established track record of gaining value over time, individual stocks can and do get caught up in short-term trends and bubbles. In times like these, the adage rings annoyingly true.
If you invested in Moderna (MRNA) at the end of November 2020, when COVID-19 vaccines were first being rolled out, your investment grew by 217.2% at its peak. If you checked back at the end of February, however, you’d see that your former 20-bagger is barely breaking even. Similarly, an investment into the fourth-largest company in the world, Amazon (AMZN), would have risen 17.8% only to end February 2022 in the red by 3%.
Though the S&P 500 has risen steadily over the past 15 months, the same can’t be said for some of the COVID-era’s biggest names. Sometimes what goes up does in fact come right back down, and reminds us of the risks and rewards of timing the market.
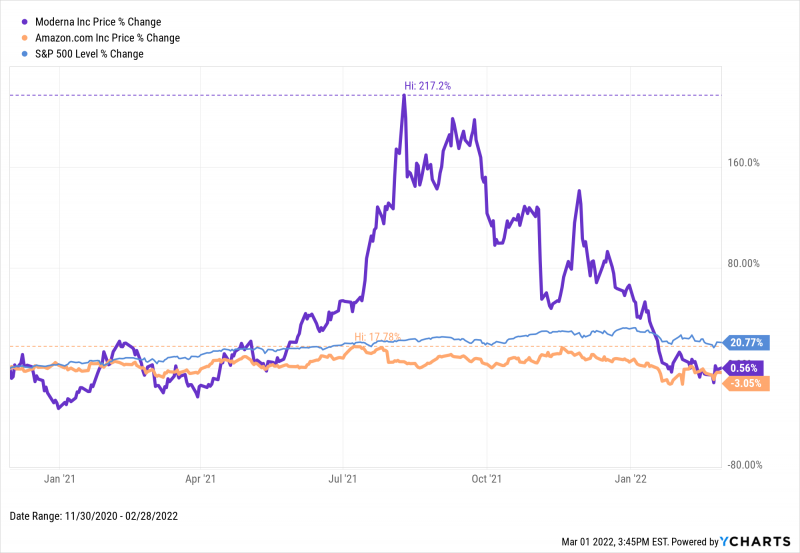
Download Visual | Modify in YCharts
Equity Performance
Major US Indexes
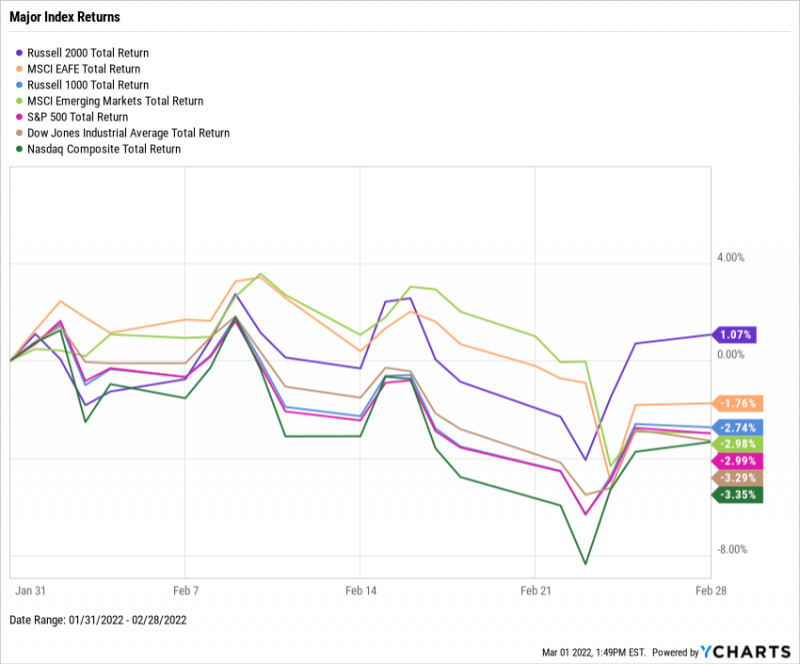
Download Visual | Modify in YCharts
Value vs. Growth Performance
Major averages were down again in February, with growth stocks leading the declines. The iShares Russell 1000 Growth ETF (IWF) sank 4.2% in February, while its value counterpart (IWD) fell only 1.2%. Though value has outperformed growth by 2.3 percentage points over the trailing twelve months, 2022 is responsible for wiping out a significant amount of those gains from the board. Year to date, value has fallen 3.5%, and growth has tumbled 12.5%.
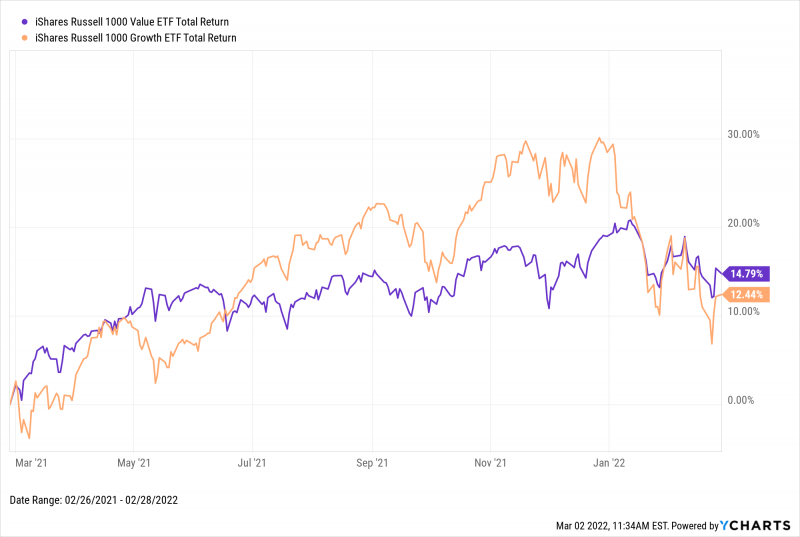
Download Visual | Modify in YCharts
US Sector Movement
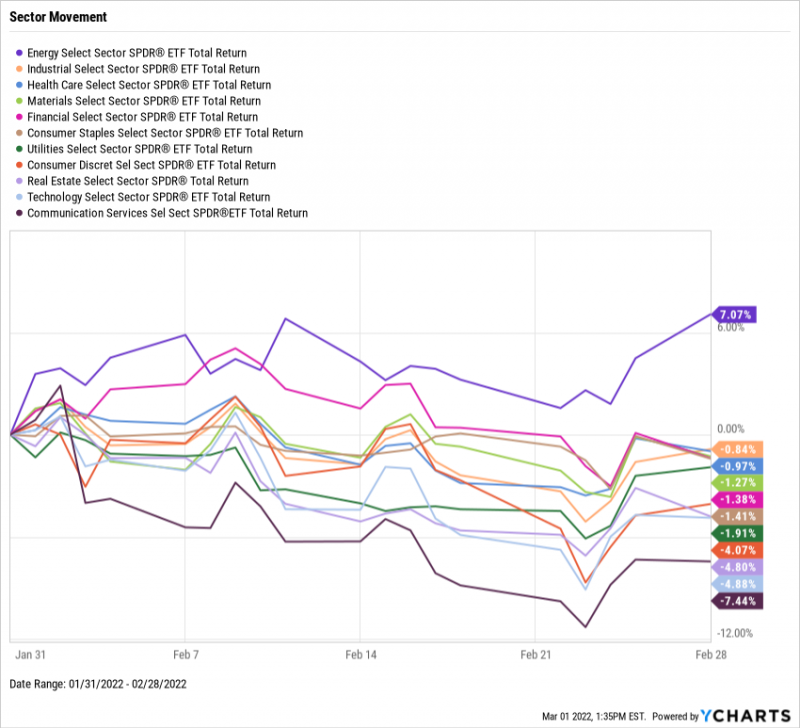
Download Visual | Modify in YCharts
Hot Stocks: February’s Top 10 S&P 500 Performers
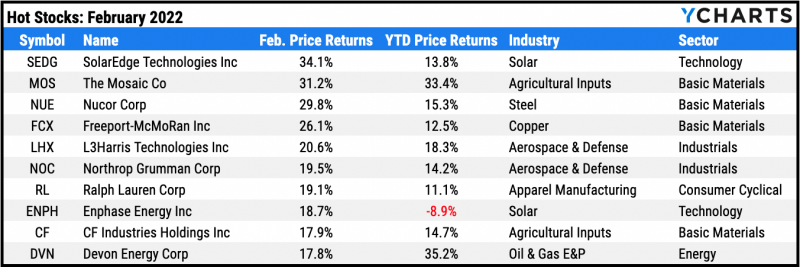
Download Visual | Modify in YCharts
SolarEdge Technologies (SEDG): 34.1% gain in February
The Mosaic (MOS): 31.2%
Nucor (NUE): 29.8%
Freeport-McMoRan (FCX): 26.1%
L3Harris Technologies (LHX): 20.6%
Northrop Grumman (NOC): 19.5%
Ralph Lauren (RL): 19.1%
Enphase Energy (ENPH): 18.7%
CF Industries Holdings (CF): 17.9%
Devon Energy (DVN): 17.8%
Laggards & Losers: February’s 10 Worst S&P 500 Performers
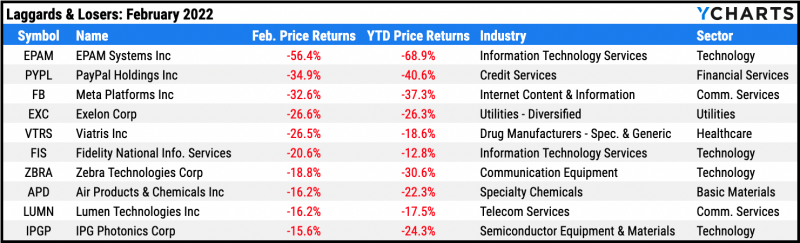
Download Visual | Modify in YCharts
EPAM Systems (EPAM): -56.4% decline in February
PayPal Holdings (PYPL): -34.9%
Meta Platforms (FB): -32.6%
Exelon (EXC): -26.6%
Viatris (VTRS): -26.5%
Fidelity National Information Services (FIS): -20.6%
Zebra Technologies (ZBRA): -18.8%
Air Products & Chemicals (APD): -16.2%
Lumen Technologies (LUMN): -16.2%
IPG Photonics (IPGP): -15.6%
Fixed Income Performance
US Treasury Yield Curve
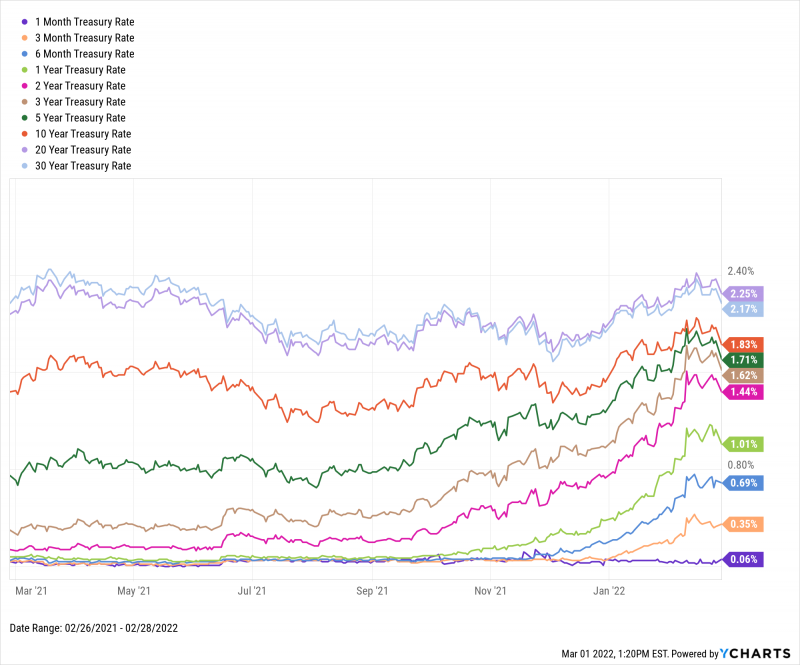
Download Visual | Modify in YCharts
1 Month Treasury Rate: 0.06%
3 Month Treasury Rate: 0.35%
6 Month Treasury Rate: 0.69%
1 Year Treasury Rate: 1.01%
2 Year Treasury Rate: 1.44%
3 Year Treasury Rate: 1.62%
5 Year Treasury Rate: 1.71%
10 Year Treasury Rate: 1.83%
20 Year Treasury Rate: 2.25%
30 Year Treasury Rate: 2.17%
Global Bonds
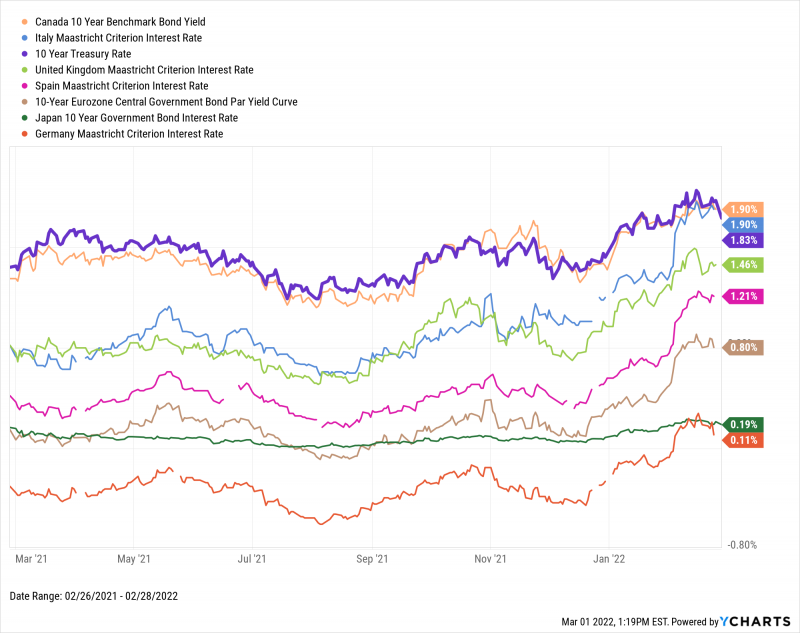
Download Visual | Modify in YCharts
Canada 10 Year Benchmark Bond Yield: 1.90%
Italy Long Term Bond Interest Rate: 1.90%
10 Year Treasury Rate: 1.83%
United Kingdom Long Term Bond Interest Rate: 1.46%
Spain Long Term Bond Interest Rate: 1.21%
10-Year Eurozone Central Government Bond Par Yield: 0.80%
Japan 10 Year Government Bond Interest Rate: 0.19%
Germany Long Term Bond Interest Rate: 0.11%
Featured Market & Advisor News
Advisors, Strategists Tell Clients Ukraine Storm Will Pass (FA-Mag)
7 Best Asset Classes to Hedge Against Inflation (YCharts)
Broker-dealers sell record $10.5 billion in alts in January (InvestmentNews)
Victors of Today’s Market Volatility with Beth Kindig (YCharts)
U.S. Interest Rates Have Soared Everywhere But Savings Accounts (WealthManagement.com)
How Long Does it Take Tech Stocks to Recover From a Crash? (YCharts)
Economic Data
Employment
The unemployment rate was 4.0% at January’s end, while weekly claims for unemployment declined further to 232,000 for the week of February 19th. The labor force participation rate grew 0.3 percentage points to 62.2% but remains 1.2 points below its pre-pandemic level.
Production and Sales
Following its worst monthly decline since February 2021, US Retail and Food Services Sales MoM rebounded 3.8% in January. The US ISM Manufacturing PMI fell from 58.8 to 57.6 in January, but snapped back up to 58.6 as of February’s end. Readings above 50 indicate expansion in the manufacturing sector.
Housing
February was a mixed month of activity for the US housing market. The number of US New Single-Family Houses Sold MoM receded by 4.5% following a December in which that figure grew 12%. At the same time, Existing Home Months’ Supply fell to 1.6, its lowest reading on record. The limited supply of homes on the market caused the US Existing Home Average Sales Price to remain elevated, at $368,700 as of January’s end.
Consumers and Inflation
January’s year-over-year US Inflation print came in at 7.5%, while the YoY US Core Inflation Rate was 6%. Both inflation indicators rose 0.5 points from December’s levels. As a result, the US Consumer Price Index jumped 0.65% MoM. Consumers are still opening their wallets, however, as consumer spending (PCE) increased 0.60%.
Gold
The price of Gold in USD was $1,884.80 per ounce at February’s end, representing a monthly price increase of 5%. Investors fled from risky assets and piled into gold, sending the SPDR Gold Shares ETF (GLD) up 6.1% and the VanEck Gold Miners ETF (GDX) 13.7% higher.
Oil
Oil prices continued their rapid climb in February. As of February 28th, the WTI Daily Spot Price was $96.13 per barrel, and Brent surpassed $100, sitting at $103.08/barrel.
Cryptocurrencies
Despite surging in the first half of the month, Bitcoin and Ethereum ended February flat. The price of Bitcoin was $37,804 as of February 28th, still 36.1% off its all-time high. Ethereum stood at $2,629, representing a 39.4% retracement. Cardano had a losing month, dipping 17.2% in February to $0.86.
Have a great March! 📈
If you haven’t yet, subscribe to the YCharts Monthly Market Wrap here: