Monthly Market Wrap: March 2022
Welcome back to the Monthly Market Wrap from YCharts, where we break down the most important market trends for advisors and their clients every month. As always, feel free to download and share any visuals with clients and colleagues, or on social media.
Want the Monthly Market Wrap sent straight to your inbox? Subscribe below:
Are you based in Canada or following Canadian markets? Check out and subscribe to the Monthly Canada Market Wrap from YCharts.
March 2022 Market Summary
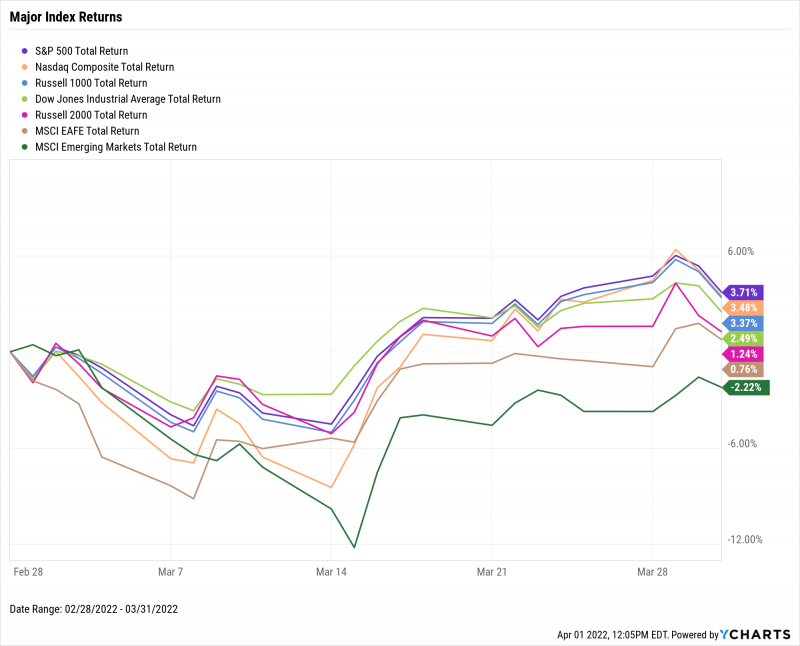
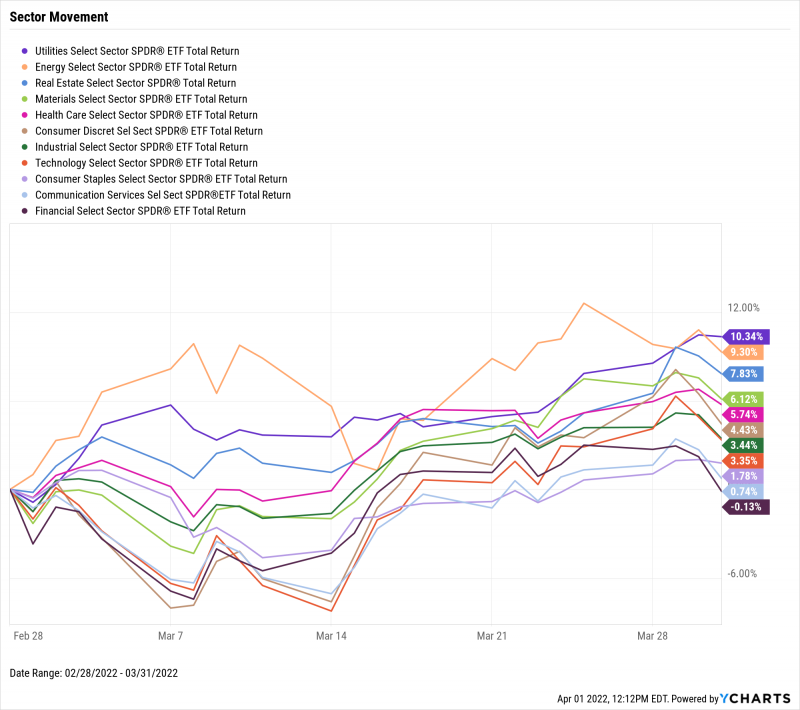
Equities posted their first winning month of 2022, with the S&P 500 gaining 3.7% and the tech-heavy Nasdaq 3.5%. Utilities led the way in sector performance, rising 10.3%. All sectors with the exception of Financials ended March in the black, and even Financials slipped by only 0.1%. For the year, however, the S&P 500 is down 4.6% while the NASDAQ has fallen 9.0% year-to-date.
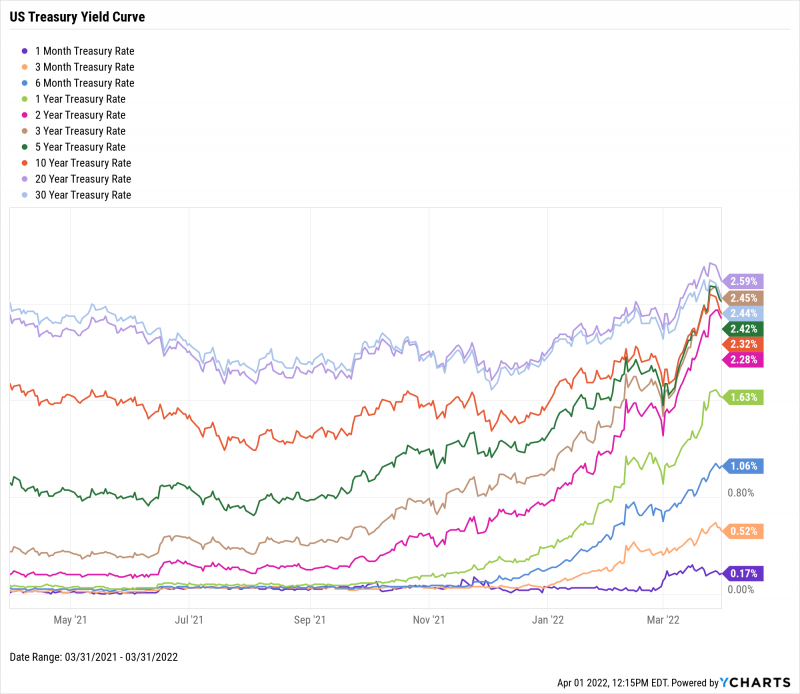
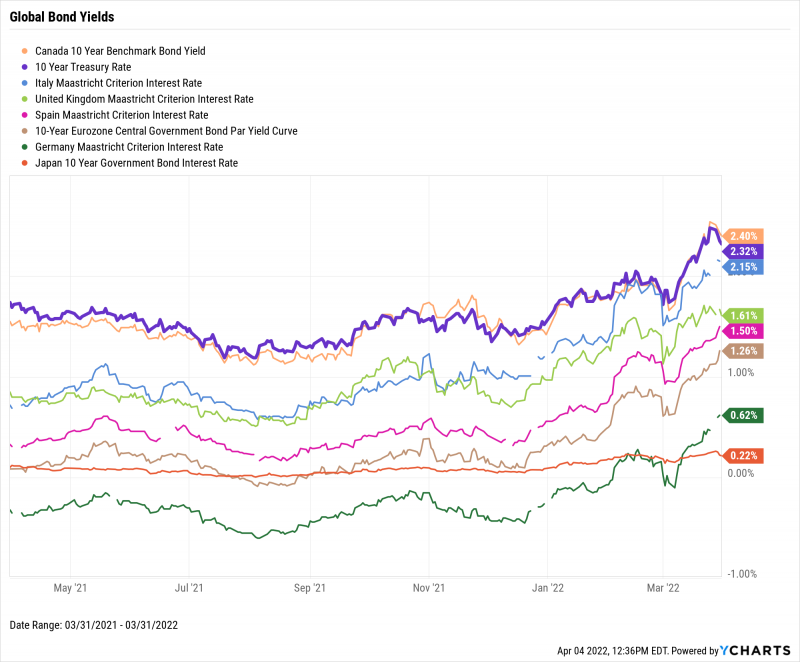
Treasury yields continued roaring higher as the Federal Reserve confirmed a series of rate hikes would be coming down the pipe. Most notably, multiple inversions have appeared in the yield curve, with the 3-Year and 5-Year rates rising beyond the 10 and 30-Year yields, the latter pair of which fell slightly in late March. Once again, the 2-Year posted the largest month-over-month yield increase, up to 2.28% from 1.44%. Over in Germany, the country’s long-term rate fell back into negative territory temporarily but ended March yielding 0.62%, its highest yield in four years.
Jump to Fixed Income Performance
Surprise, surprise. Inflation rose again, now for the sixth straight month, to 7.8%. Oil remained well above $100 per barrel, and the average US Retail Gas Price was $4.33 per gallon as of month’s end. After being beaten down for a couple months, major cryptocurrencies Bitcoin, Ethereum, and Cardano staged a rally in March.
Off the YCharts! Inversion Mania
Ladies and gentlemen, it’s yield curve inversion season.
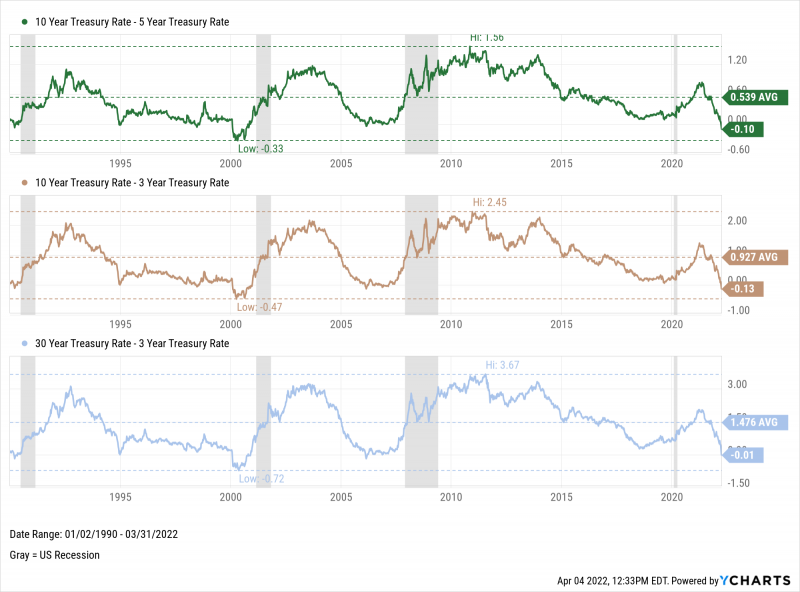
Over the past year, the yields on shorter-term treasuries have risen steadfastly, with rates really picking up in the last month. In fact, those yields have surpassed some longer-duration instruments, causing a yield curve inversion.
Specifically, the 10-5 Treasury Yield Spread is now inverted by 10 basis points, while the 10-3 spread is upside down by 13 bps. But perhaps most surprising of all, the yield on the 3-year Treasury is currently outperforming that of the 30-year, the longest-term bond issued by the United States.
The last three times these yield spreads inverted, a recession followed shortly thereafter in each instance. In 1995, the spreads flirted with inversion but no recession followed. With the 10-5, 10-3, and 30-3 yield spreads now inverted, the question on everyone’s mind is, is trouble looming for the economy or market?
Download Visual | Modify in YCharts
Equity Performance
Major US Indexes
Download Visual | Modify in YCharts
Value vs. Growth Performance, Trailing Twelve Months
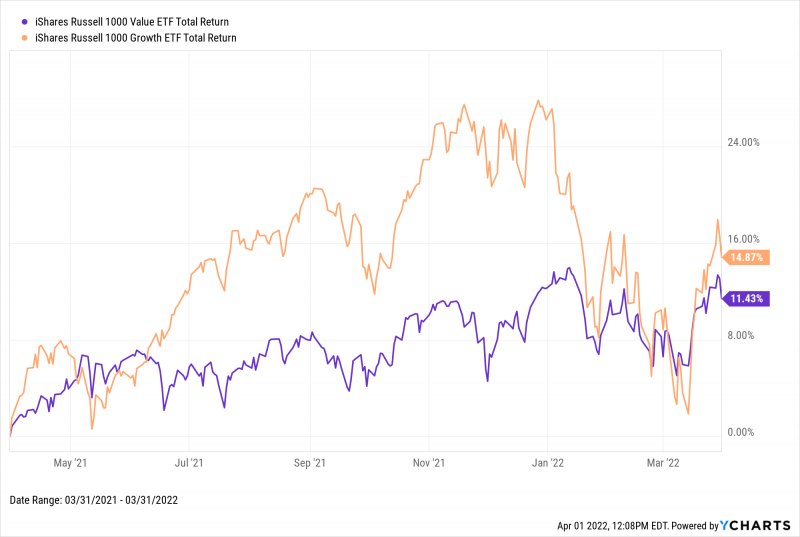
Though equities gained back some previously lost ground in March, growth stocks did so at a higher clip than value. The iShares Russell 1000 Growth ETF (IWF) advanced 4.0% in March, while its Value counterpart (IWD) rose 2.9%. But both equity styles are still negative through the first quarter of 2022; growth is down 9.0% whereas value is a modest 0.7% lower from the start of the year. However, growth is still outperforming value by a margin of 3.4 percentage points over the last twelve months.
Download Visual | Modify in YCharts
US Sector Movement
Download Visual | Modify in YCharts
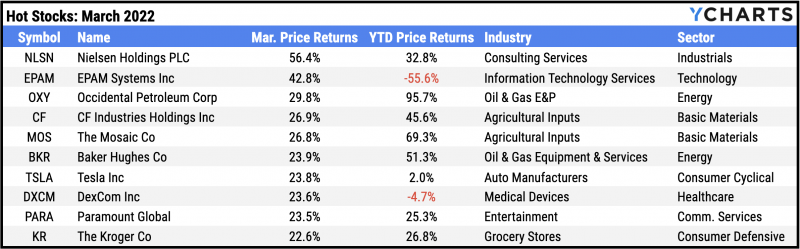
Hot Stocks: March’s Top 10 S&P 500 Performers
Nielsen Holdings (NLSN): 56.4% gain in March
EPAM Systems (EPAM): 42.8%
Occidental Petroleum (OXY): 29.8%
CF Industries Holdings (CF): 26.9%
The Mosaic Co (MOS): 26.8%
Baker Hughes (BKR): 23.9%
Tesla (TSLA): 23.8%
DexCom (DXCM): 23.6%
Paramount Global (PARA): 23.5%
The Kroger Co (KR): 22.6%
Download Visual | Modify in YCharts
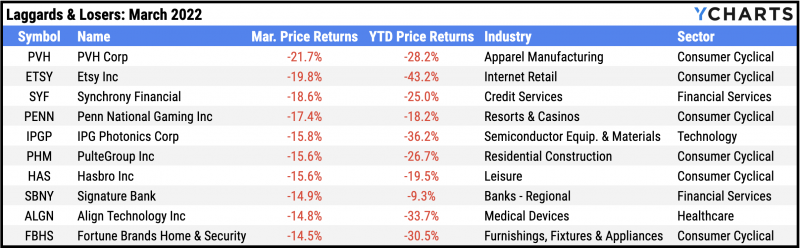
Laggards & Losers: March’s 10 Worst S&P 500 Performers
PVH (PVH): -21.7% decline in March
Etsy (ETSY): -19.8%
Synchrony Financial (SYF): -18.6%
Penn National Gaming (PENN): -17.4%
IPG Photonics (IPGP): -15.8%
PulteGroup (PHM): -15.6%
Hasbro (HAS): -15.6%
Signature Bank (SBNY): -14.9%
Align Technology (ALGN): -14.8%
Fortune Brands Home & Security (FBHS): -14.5%
Download Visual | Modify in YCharts
Fixed Income Performance
US Treasury Yield Curve
1 Month Treasury Rate: 0.17%
3 Month Treasury Rate: 0.52%
6 Month Treasury Rate: 1.06%
1 Year Treasury Rate: 1.63%
2 Year Treasury Rate: 2.28%
3 Year Treasury Rate: 2.45%
5 Year Treasury Rate: 2.42%
10 Year Treasury Rate: 2.32%
20 Year Treasury Rate: 2.59%
30 Year Treasury Rate: 2.44%
Download Visual | Modify in YCharts
Global Bonds
Canada 10 Year Benchmark Bond Yield: 2.40%
10 Year Treasury Rate: 2.32%
Italy Long Term Bond Interest Rate: 2.15%
United Kingdom Long Term Bond Interest Rate: 1.61%
Spain Long Term Bond Interest Rate: 1.50%
10-Year Eurozone Central Government Bond Par Yield: 1.26%
Germany Long Term Bond Interest Rate: 0.62%
Japan 10 Year Government Bond Interest Rate: 0.22%
Download Visual | Modify in YCharts
Featured Market & Advisor News
Muni Bonds Close Worst Quarter Since 1980s Down More Than 6% (FA-Mag)
Your Complete Guide to Sector Rotation (YCharts)
Morgan Stanley lays plans to enter the ETF market (InvestmentNews)
Interest Rates Are Getting Weird with Ben Carlson (YCharts)
Anti-ARK ETF Trades Above Cathie Wood’s Flagship for First Time (WealthManagement.com)
Can You Hedge a Stock Market Crash with an ETF? (YCharts)
Economic Data
Employment
March’s unemployment rate was 3.6%, officially falling back to its pre-pandemic record lows. However, at 62.4% the labor force participation rate remains a full percentage point below its pre-pandemic level even after gaining back 0.1% in March. Weekly new claims for unemployment declined to 202,000 for the week of March 26th, which is 14,000 fewer claims than a month ago.
Production and Sales
After a major uptick in January, US Retail and Food Services Sales rose a modest 0.3% month over month. The US ISM Manufacturing PMI slowed from 58.6 to 57.1 in March, but is still well within the expansionary range of 50 or greater.
Housing
The number of US New Single-Family Houses Sold month over month receded another 2.0%, which marks the second straight month the measure has declined. Existing Home Months’ Supply rose 0.1 points off last month’s all-time low, to 1.7, in February. Still, the limited availability of homes kept the US Existing Home Average Sales Price elevated at $370,700 as of February’s end.
Consumers and Inflation
February’s year-over-year US Inflation rate clocked in at 7.9%, while the US Core Inflation Rate was 6.4%. This marks the sixth straight monthly increase for the former, and seventh for the latter. As a result, the US Consumer Price Index jumped 0.80% MoM, yet consumers are still spending at a healthy rate with consumer spending (PCE) having increased 0.60%.
Gold
The price of Gold in USD was $1,953.80 per ounce at March’s end, representing a healthy monthly increase of 2.3%. Despite inflation pressures and other risk-off market forces coming into play, the SPDR Gold Shares ETF (GLD) ticked up just 0.6% but the VanEck Gold Miners ETF (GDX) surged 14.9% higher.
Oil
Oil prices experienced heightened volatility in March, but ended the month higher than they were in February. As of March 28th, the WTI Daily Spot Price was $107.55/barrel, and Brent sat at $114.50/barrel.
Cryptocurrencies
Major cryptocurrencies posted solid moves to the upside in March. The price of Bitcoin was $47,063 as of March 31st, still 30.4% off its all-time high but about 25% higher than its value a month ago. Ethereum ended March at $3,384, representing a similar monthly gain of almost 25%. Cardano had its first winning month in quite a while, recovering from a max drawdown of 73.4% to close March at $1.19, representing a 32.8% monthly increase.
Have a great April! 📈
If you haven’t yet, subscribe to the YCharts Monthly Market Wrap here: