Monthly Market Wrap: November 2022
Welcome back to the Monthly Market Wrap from YCharts, where we break down the most important market trends for advisors and their clients every month. As always, feel free to download and share any visuals with clients and colleagues, or on social media.
Speaking of visuals: look out for our brand-new Monthly Market Wrap slide deck, containing all charts featured in the Market Wrap + more, coming next month.
Want the Monthly Market Wrap sent straight to your inbox? Subscribe below:
November 2022 Market Summary
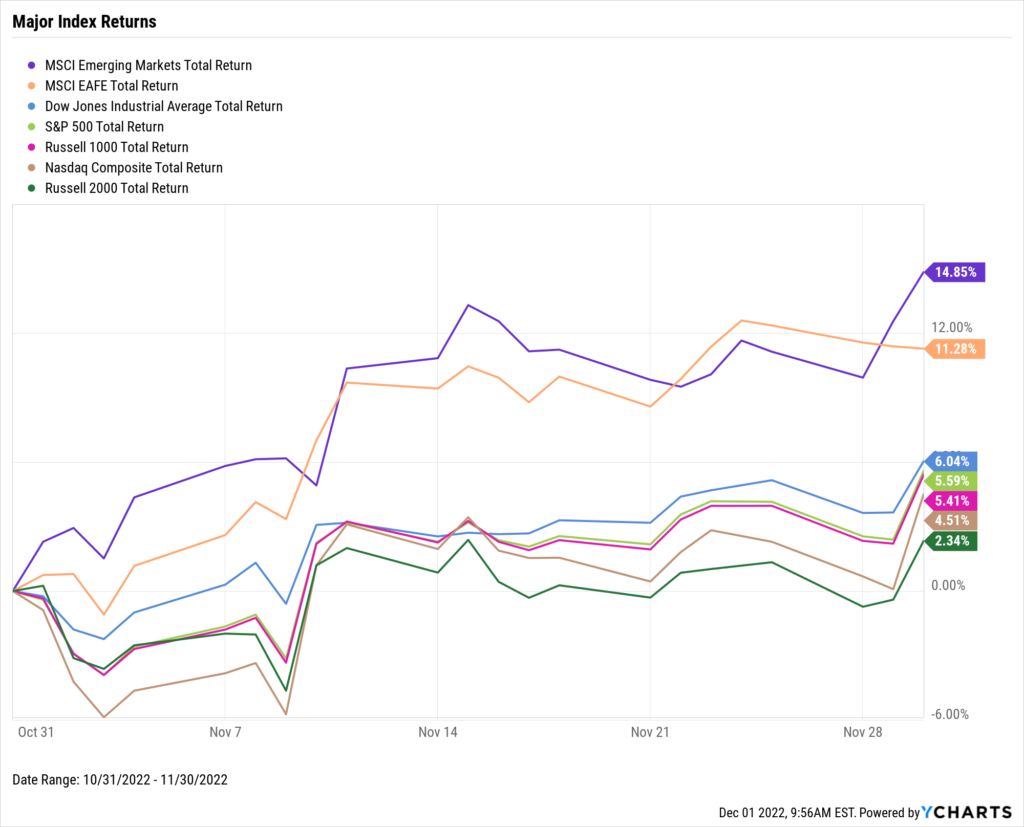
Stocks rebounded further both in the US and globally. The Dow Jones Industrial Average rose 6.0%, the S&P 500 added 5.6%, and the NASDAQ tacked on 4.5%. Global indexes were even bigger winners—Emerging Markets jumped 14.9% in November, and the Developed EAFE index advanced 11.3%. Year-to-date, the Dow is down just 2.9%, having almost fully crawled back from a 19.7% decline at its worst. The S&P 500 remains in correction mode down 13.1%, and the NASDAQ is firmly in bear market territory, off 26.1% from its all-time high.
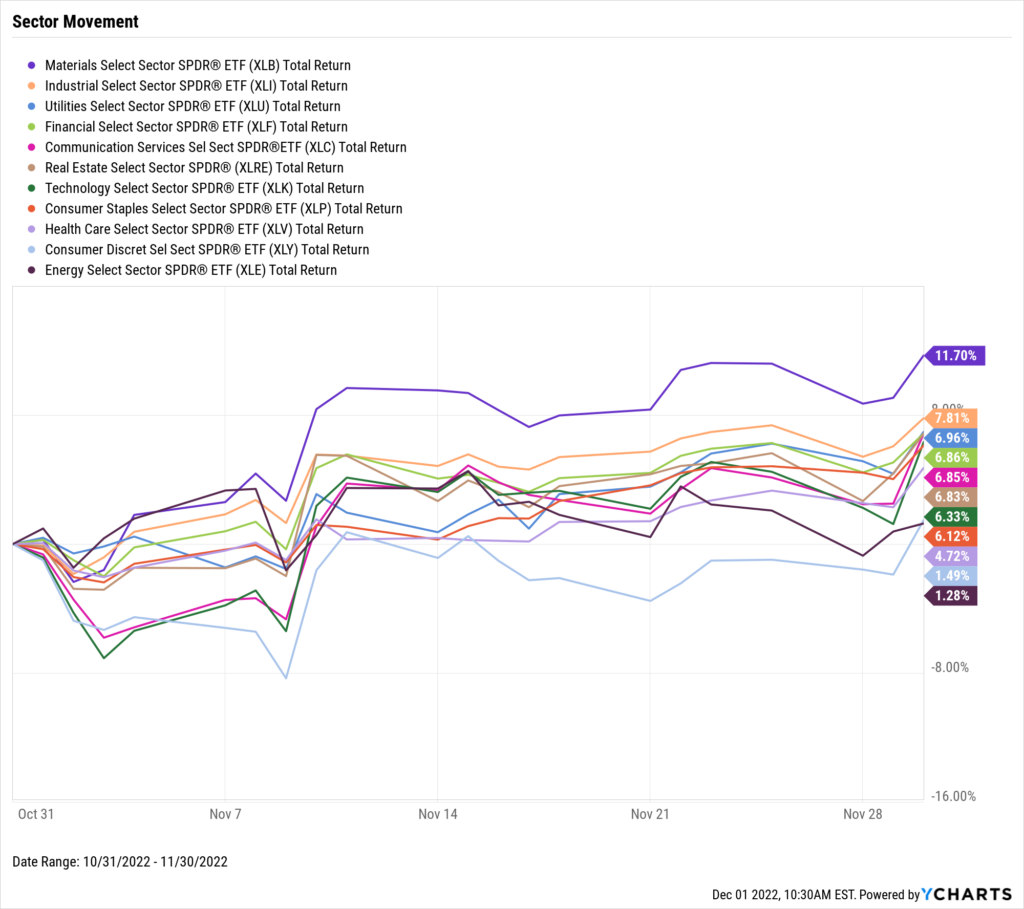
All eleven S&P 500 sectors also finished in the black for the second consecutive month. The cyclically-sensitive Materials and Industrials sectors led the way with respective increases of 11.7% and 7.8%. Lagging were Consumer Discretionary and Energy, the latter of which sold off due to weakened oil prices, but still finished November 1.3% higher.
US existing home sales declined for the ninth straight month. The median national existing home price also declined by 1.1%, to $379,100. In some good news for prospective buyers, mortgage rates cooled off in November and the 30-year now sits at 6.49% as of December 1st. Both YoY inflation and core inflation dipped by 0.4 percentage points compared to last month’s prints.
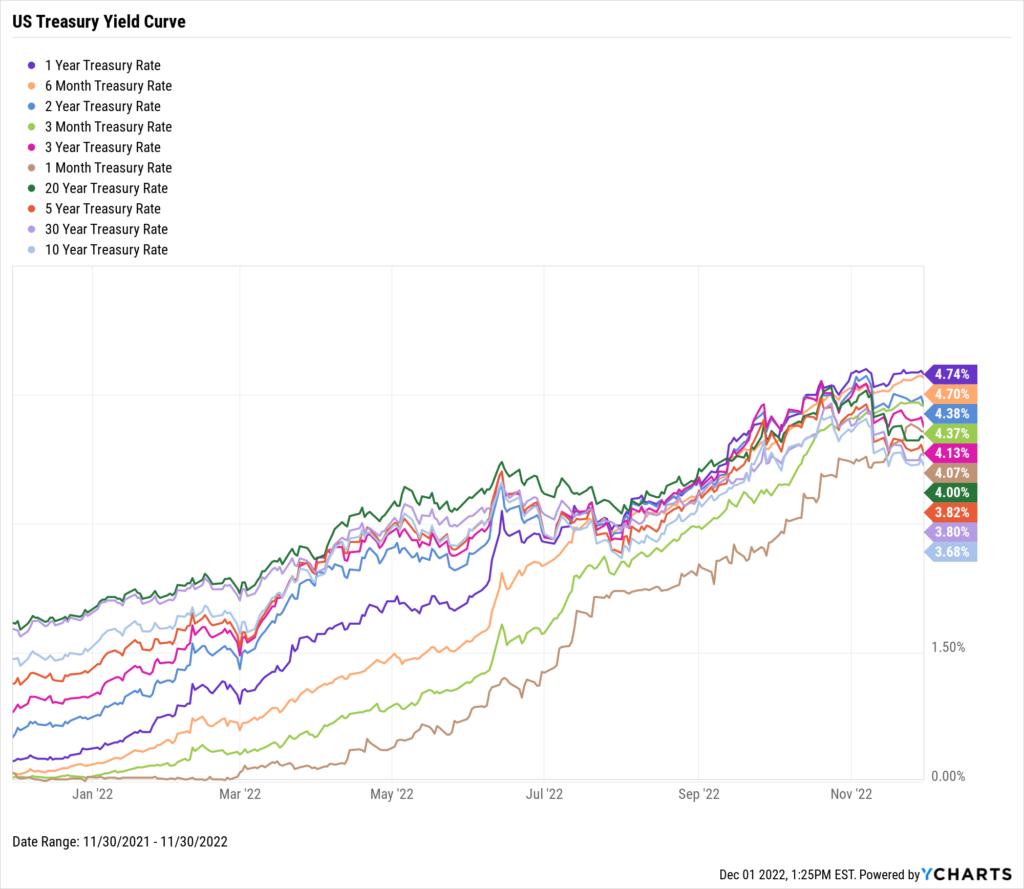
The inverted yield curve twisted further in November as both the 10 Year Treasury Rate and 30 Year Treasury Rate fell to the bottom of the curve. The 10-year rate as of November 30th was 3.68%, and the 30-year was 3.80%, the only US treasuries that were sub-4%. At the top of the curve was the 1-Year Treasury Bill at 4.74%, followed by the 6-Month Treasury Bill at 4.70%. And we thought spooky season was over after Halloween…
Jump to Fixed Income Performance
Off the YCharts! The Dow’s Comeback Kids of 2022
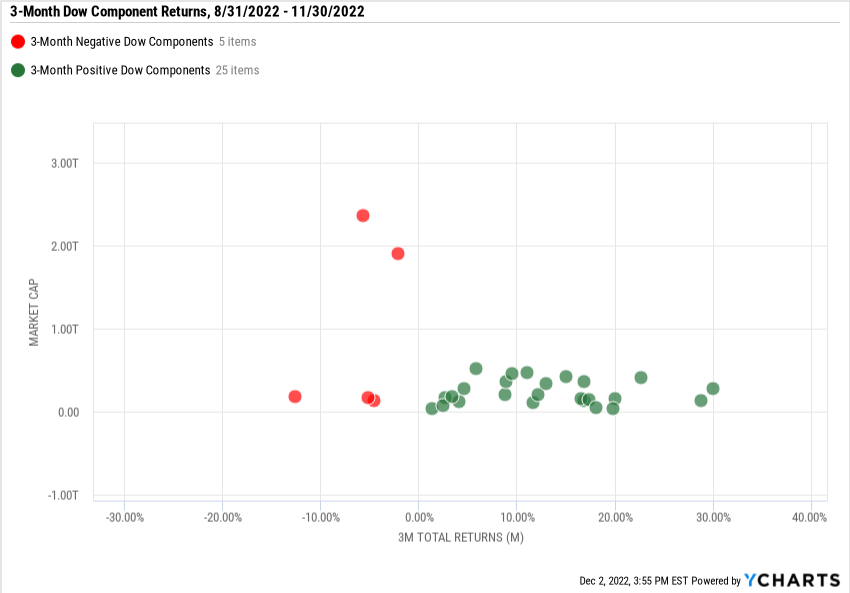
The Dow Jones Industrial Average neared bear market territory, falling to 19.7% YTD as of September 30th, but a few big names have led the index back to be nearly even on a year-to-date basis.
25 of the Dow’s 30 constituents are positive since August 31st, and 26 were in the black in November alone. This marks a significant turnaround from earlier in the year, as just four of the Dow 30 constituents were positive in the first three quarters of 2022.
Leading the charge were Merck (MRK), up 30.0% in just the past three months, Caterpillar (CAT) with a 28.8% increase, and JP Morgan Chase (JPM) rising 22.6%. Each company surged for distinct reasons—Merck for receiving key drug approvals and promising clinical trial data, Caterpillar and JP Morgan Chase primarily on better-than-expected earnings—but can they, along with other Dow constituents, bring the index back above water year’s end?
Download Visual | Modify in YCharts
Equity Performance
Major Indexes
Download Visual | Modify in YCharts
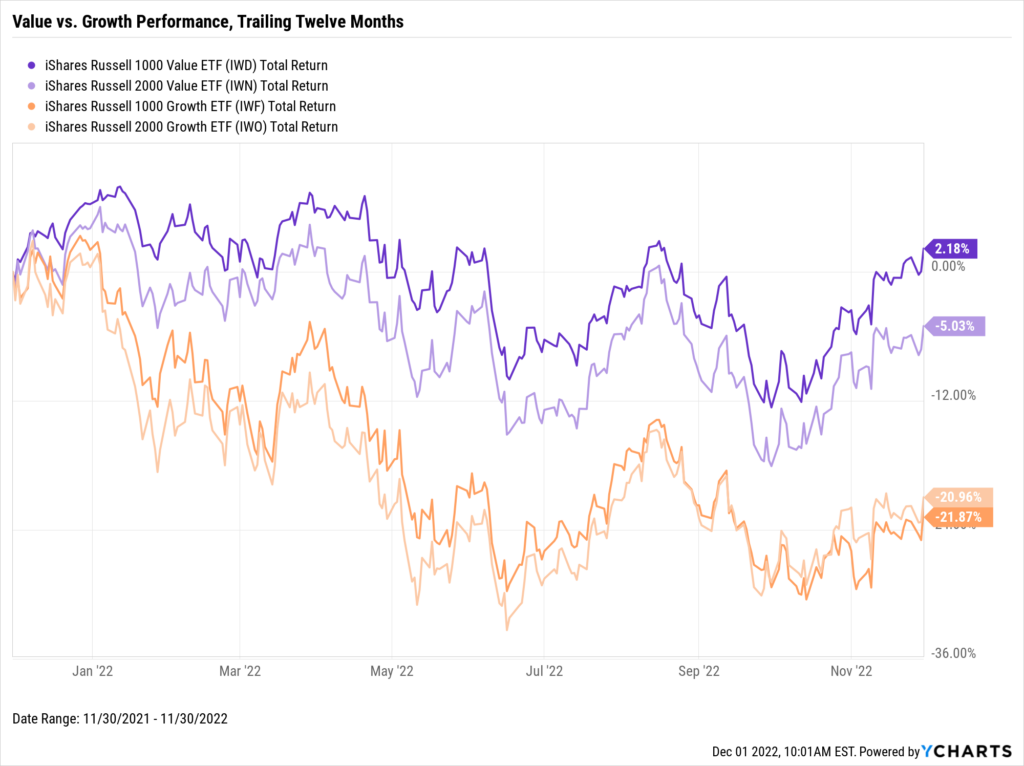
Value vs. Growth Performance, Trailing Twelve Months
Large- and mid-cap Value stocks, represented by the iShares Russell 1000 Value ETF (IWD), tacked on 6.2% in November following a double-digit uptick in October. IWD is now positive on a trailing twelve months basis. Small-caps lagged behind their large- and mid-cap counterparts. The iShares Russell 2000 Value ETF (IWN) rose 2.8% in November but is down 5.0% over the last twelve months.
Growth performed in a similar fashion. Large- and mid-caps (IWF) rose 4.5%, whereas its small-cap counterpart (IWO) added 1.4%. Both styles of Growth stocks are down more than 20% TTM.
Download Visual | Modify in YCharts
US Sector Movement
Download Visual | Modify in YCharts
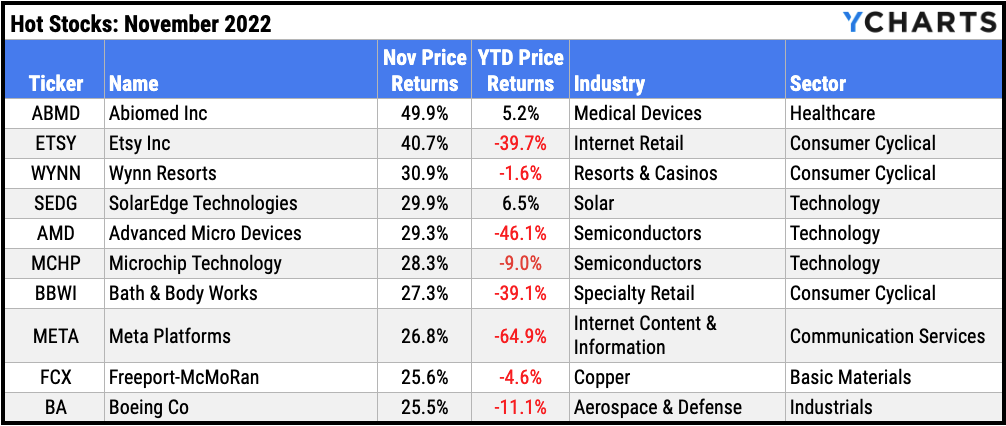
Hot Stocks: Top 10 S&P 500 Performers of November 2022
Abiomed Inc (ABMD): 49.9% gain in November
Etsy Inc (ETSY): 40.7%
Wynn Resorts (WYNN): 30.9%
SolarEdge Technologies: (SEDG): 29.9%
Advanced Micro Devices: (AMD): 29.3%
Microchip Technology (MCHP): 28.3%
Bath & Body Works (BBWI): 27.3%
Meta Platforms (META): 26.8%
Freeport-McMoRan (FCX): 25.6%
Boeing Co (BA): 25.5%
Download Visual | Modify in YCharts
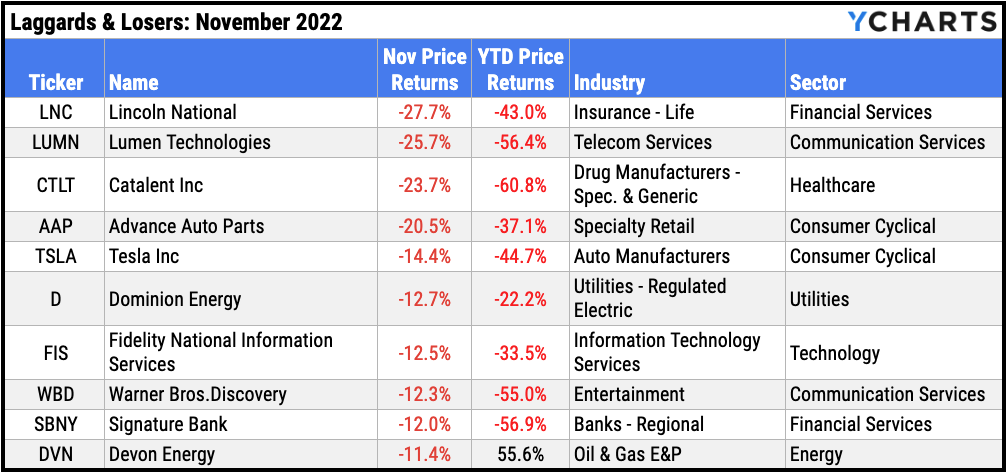
Laggards & Losers: 10 Worst S&P 500 Performers of November 2022
Lincoln National (LNC): -27.7% decline in November
Lumen Technologies (LUMN): -25.7%
Catalent Inc (CTLT): -23.7%
Advance Auto Parts (AAP): -20.5%
Tesla Inc (TSLA): -14.4%
Dominion Energy (D): -12.7%
Fidelity National Information Services (FIS): -12.5%
Warner Bros.Discovery (WBD): -12.3%
Signature Bank (SBNY): -12.0%
Devon Energy (DVN): -11.4%
Download Visual | Modify in YCharts
Featured Market & Advisor News
Younger Investors Hold 80% Of 401(k) Assets in Equities, New Study Finds (FA-Mag)
Inverted Yield Curve: What It Means and How to Navigate It (YCharts)
Annuity sales stay torrid in Q3 with help from banks (InvestmentNews)
Are Wholesalers Giving Advisors What They Really Want? (YCharts)
Retail Traders Who’ve Taken a Beating This Year May Harvest Their Losses (WealthManagement.com)
Are We In A Recession? It Depends… (YCharts)
Economic Data
Employment
October’s unemployment rate clocked in at 3.7%, bouncing off its 50-year low of 3.5%. The labor force participation rate dipped 0.1 percentage point to 62.2%, now 1.2 percentage points below its February 2020 high. 263,000 jobs were added in November, topping nonfarm payroll expectations of 200,000 but paling in comparison to last November’s gain of 647,000.
Consumers and Inflation
The YoY US Inflation Rate cooled off by 0.4 percentage points to 7.8% in October, and YoY US Core Inflation fell by the same amount, down to 6.6%. The MoM US Consumer Price Index was up 0.44% in September and personal spending increased by 0.84%. Lastly, the Federal Reserve issued another 75 basis point rate hike at its November 2nd meeting, bringing the Upper Limit Target Federal Funds Rate to 4%.
Production and Sales
November’s US ISM Manufacturing PMI slipped for the sixth straight month to 49.00, marking the first time since May 2020 that the ISM Manufacturing PMI fell into contraction territory (below 50.0). On the plus side, US Retail and Food Services Sales logged its best month in the last eight, rising 1.3% in October. Inventories are also pushing toward normal levels. The US Retail Trade Inventory/Sales Ratio was 1.25 as of September, well below its historical average of 1.50 but 14.7% higher than its April 2021 low.
Housing
After a double-digit percentage decline in September, US New Single-Family Home Sales increased 7.5% MoM. 632K new homes were sold nation-wide in October, 8.3% fewer than the same time a year ago. Existing Home Sales painted a bleaker picture, however; October’s 5.9% decline marked the ninth straight monthly drop for sales of existing homes. The slowdown translated into the fourth consecutive month of declining home prices, with the US Existing Home Median Sales Price falling 1.1% to $379,100. On the bright side for potential new buyers, 15-Year and 30-Year Mortgage Rates cooled off to 5.76% and 6.49%, respectively, after recently reaching levels not seen since the Great Financial Crisis.
Commodities
The price of gold jumped 6.3% MoM to $1,751.90 per ounce as of November 25th, but is still down 3.0% year-to-date. Both WTI and Brent oil prices fell by double digit percentages in November. The spot price for a barrel of crude settled at $77.10 at the end of November, down 10.5% from last month’s level of $86.54, and Brent tumbled 10.9% to $93.07. Drivers ought to appreciate the lower oil prices, as the average price of regular gas fell 21 cents in November to $3.65 per gallon.
Cryptocurrencies
Winter doesn’t officially start until December 21st, but that didn’t stop another “crypto winter” from coming early. The price of Ethereum plummeted 18.4% to settle at $1,299. Bitcoin sank 16.7% to $17,186, and Binance Coin slipped 3.8% to $301.71, ending three consecutive months of gains. 2022 performance remains deep in the red: Binance Coin is 42.8% lower YTD, Bitcoin is down 65.2%, and Ethereum is off 67.2%.
Fixed Income
US Treasury Yield Curve
1 Month Treasury Rate: 4.07%
3 Month Treasury Rate: 4.37%
6 Month Treasury Rate: 4.70%
1 Year Treasury Rate: 4.74%
2 Year Treasury Rate: 4.38%
3 Year Treasury Rate: 4.13%
5 Year Treasury Rate: 3.82%
10 Year Treasury Rate: 3.68%
20 Year Treasury Rate: 4.00%
30 Year Treasury Rate: 3.80%
Download Visual | Modify in YCharts
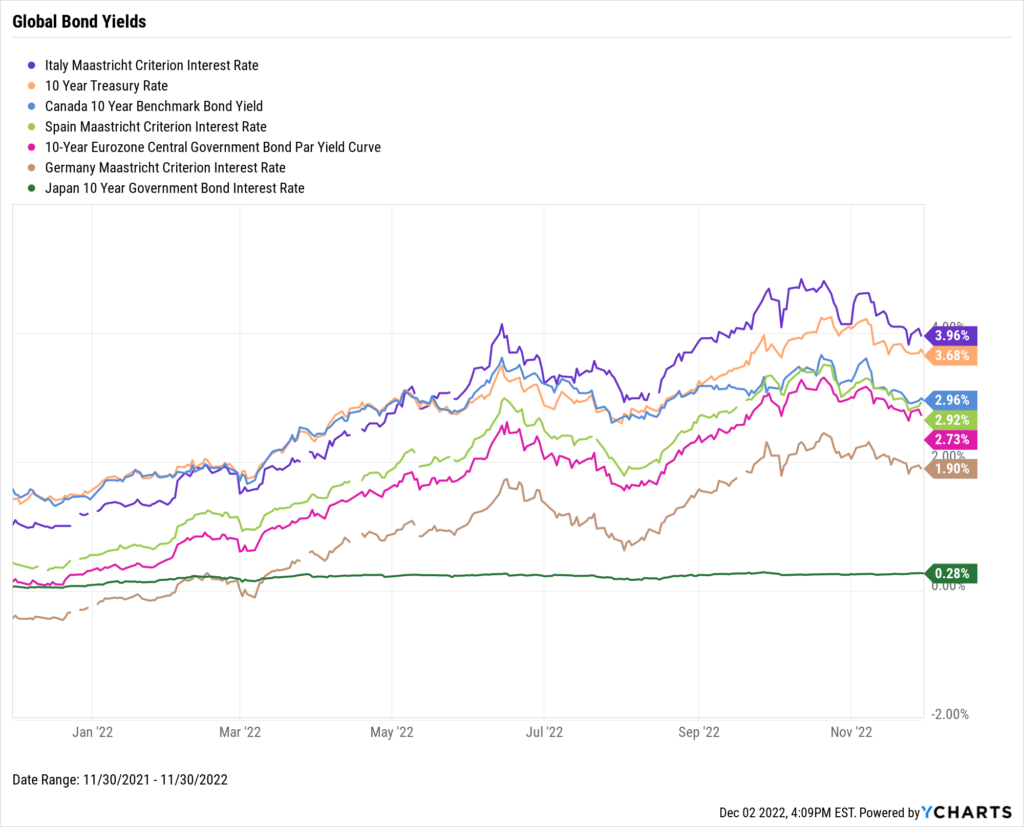
Global Bonds
Italy Long Term Bond Interest Rate: 3.96%
10 Year Treasury Rate: 3.68%
Canada 10 Year Benchmark Bond Yield: 2.96%
Spain Long Term Bond Interest Rate: 2.92%
10-Year Eurozone Central Government Bond Par Yield: 2.73%
Germany Long Term Bond Interest Rate: 1.95%
Japan 10 Year Government Bond Interest Rate: 0.28%
Download Visual | Modify in YCharts
Have a great December! 📈
If you haven’t yet, subscribe to the YCharts Monthly Market Wrap here:
Next Article
Are Wholesalers Giving Advisors What They Really Want?Read More →