Monthly Market Wrap: September 2022
Welcome back to the Monthly Market Wrap from YCharts, where we review and break down the most important market trends for advisors and their clients every month. As always, feel free to download and share any visuals with clients and colleagues, or on social media.
Want the Monthly Market Wrap sent straight to your inbox? Subscribe below:
September 2022 Market Summary
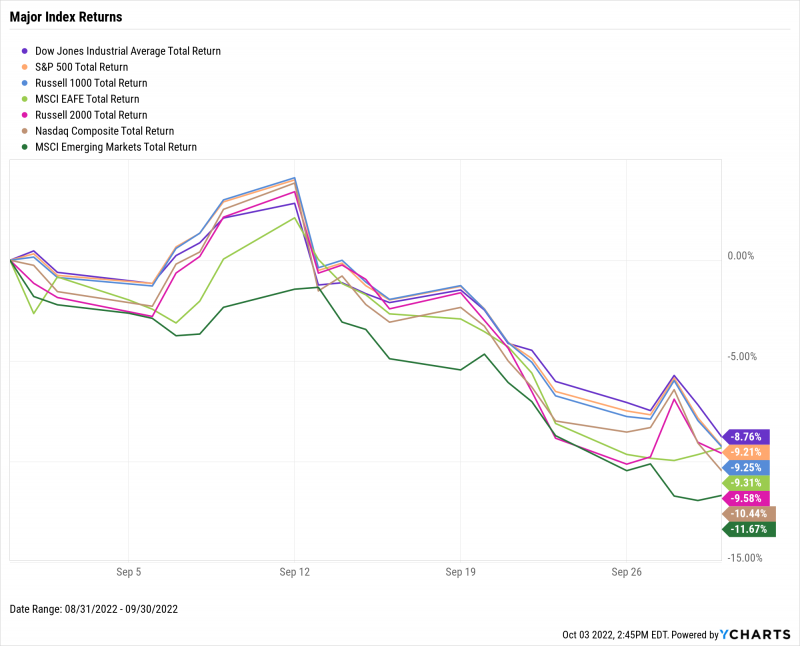
School was back in session in September, but stocks got sent straight to detention. The Dow Jones Industrial Average tumbled 8.8%, the S&P 500 slumped 9.2%, and the NASDAQ sank 10.4%. Persistent inflation, a strengthening US dollar, growing US Recession risk, and another “jumbo” 75 basis point rate hike by the Federal Reserve contributed to a dismal end-of-Q3 for stocks. September marked the single worst month for US equities since March 2020. Year-to-date, the Dow is down 19.7% and flirting with bear market territory, the S&P 500 is off 23.9%, and the NASDAQ is 32% lower.
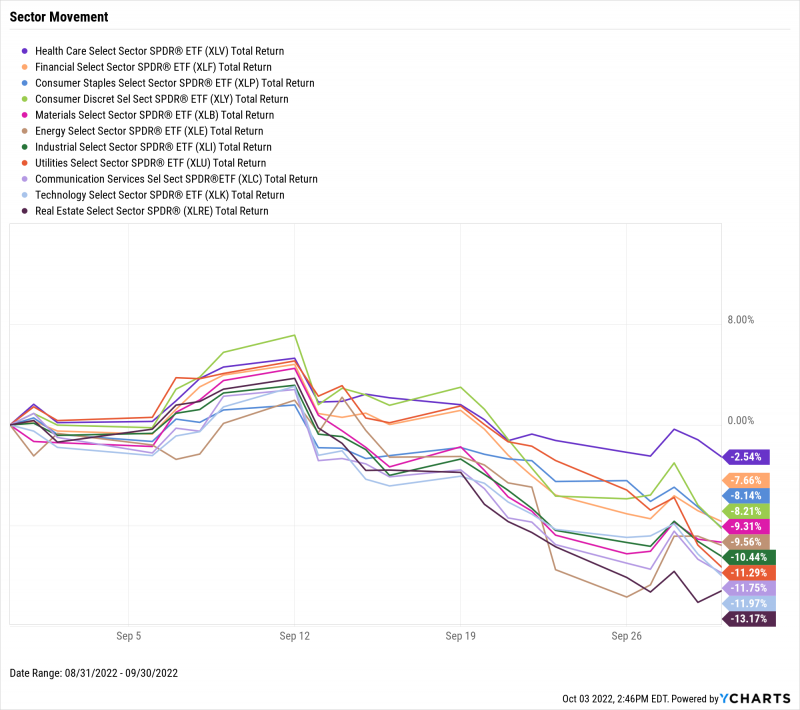
No sector finished September in the black, and cyclicals were hurt the most for the second straight month. Industrials, Communication Services, Technology and Real Estate all plummeted over 10% in September. The relative “winner” was the historically rate-proof Health Care sector, which fell 2.5%.
Oil accelerated its retreat from prices above $100 per barrel. Both WTI and Brent fell over 14%, to $77.17 and $82.55 per barrel, respectively. In housing, US New Single-Family Home Sales sharply rebounded by 28.8% MoM, though Existing Home Sales slipped for the seventh straight month. Meanwhile, inflation data was mixed: July’s inflation rate fell slightly to 8.26% but core inflation grew to 6.32%. The manufacturing sector slid further toward contraction territory, with last month’s US ISM Manufacturing PMI falling by two points to 50.9.
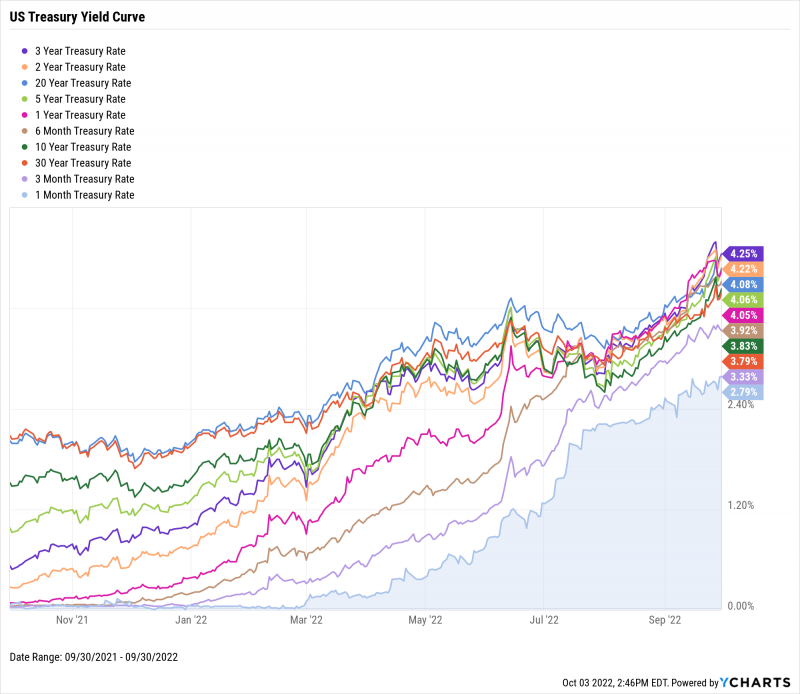
The inverted yield curve remained firmly inverted in September as the 3-Year Treasury Note sported the highest rate among US Treasuries. In addition to the 3-Year, yields on the 1-Year, 2-Year, 5-Year and 20-Year instruments were all north of 4%. The long-term 30-Year Bond was sporting the third-lowest yield of all Treasuries as of September 30th. In yield spread news, the widely-followed 10 Year-3 Month Spread grew positive but the 10-2 Year Spread remained inverted by 39 basis points.
Jump to Fixed Income Performance
Off the YCharts! Are the Bears Headed for Hibernation?
October has arrived. It’s a month synonymous with scary movies and trick-or-treating, and also the time of year for bears to go into hibernation.
…Bullish investors are hoping market bears do just that.
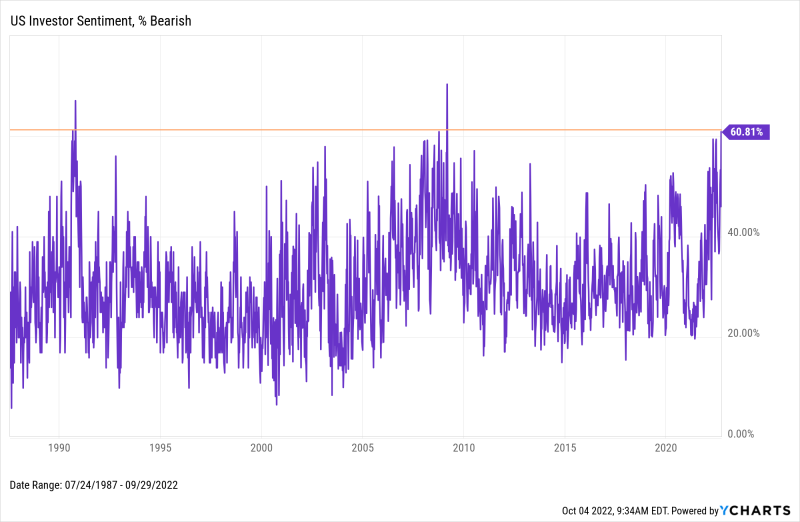
According to the American Association of Individual Investors (AAII), 60.8% of investors surveyed expressed bearish sentiment at September’s close. The AAII Investor Sentiment Survey, which gauges association members’ feelings about the stock market over the next six months, recorded its third-most bearish reading since mid-1987. Only in October 1990 and at the tail-end of the 2008 Financial Crisis were investors more bearish than they are now. Perhaps when spooky season is over, a Santa Claus rally can save the day?
Download Visual | Modify in YCharts
Equity Performance
Major Indexes
Download Visual | Modify in YCharts | View Below Table in YCharts
Value vs. Growth Performance, Trailing Twelve Months
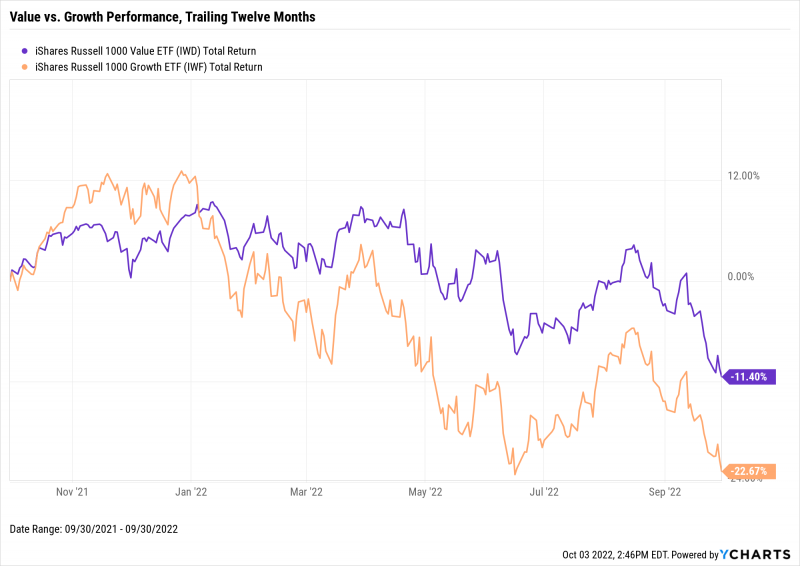
Growth stocks, represented by the iShares Russell 1000 Growth ETF (IWF), tumbled nearly 10% in September and are down 22.7% on a TTM basis. Their Value (IWD) counterparts fell mostly in tandem throughout September to end the month down 8.7%. Despite the similarly negative performances, Growth stocks are down twice as bad as Value on a TTM basis.
Download Visual | Modify in YCharts
US Sector Movement
Download Visual | Modify in YCharts | View Below Table in YCharts
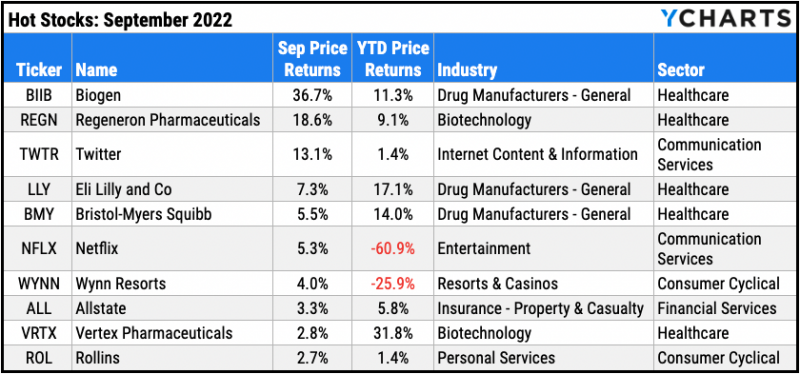
Hot Stocks: Top 10 S&P 500 Performers of September 2022
Biogen (BIIB): 36.7% gain in September
Regeneron Pharmaceuticals (REGN): 18.6%
Twitter (TWTR): 13.1%
Eli Lilly and Co (LLY): 7.3%
Bristol-Myers Squibb (BMY): 5.5%
Netflix (NFLX): 5.3%
Wynn Resorts (WYNN): 4.0%
Allstate (ALL): 3.3%
Vertex Pharmaceuticals (VRTX): 2.8%
Rollins (ROL): 2.7%
Download Visual | Modify in YCharts
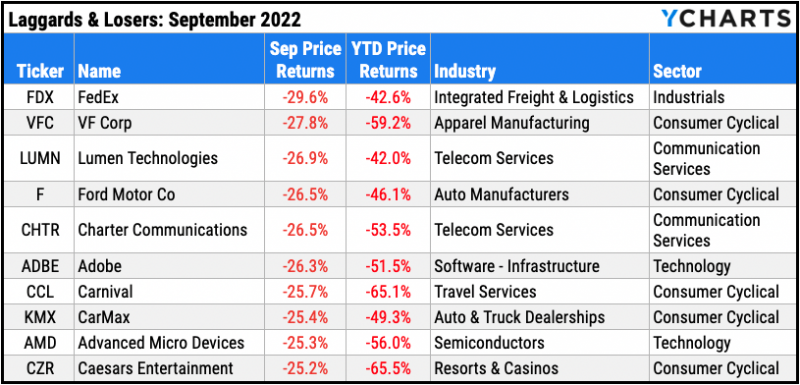
Laggards & Losers: 10 Worst S&P 500 Performers of September 2022
FedEx (FDX): -29.6% decline in September
VF Corp (VFC): -27.8%
Lumen Technologies (LUMN): -26.9%
Ford Motor Co (F): -26.5%
Charter Communications (CHTR): -26.5%
Adobe (ADBE): -26.3%
Carnival (CCL): -25.7%
CarMax (KMX): -25.4%
Advanced Micro Devices (AMD): -25.3%
Caesars Entertainment (CZR): -25.2%
Download Visual | Modify in YCharts
Featured Market & Advisor News
A Quarter of Consumers Have No Financial Plan, Survey Says (FA-Mag)
Puru Saxena’s State of the Markets: How Will 2022 End? (YCharts)
Retail investors grow weary of cryptocurrency as institutional interest grows (InvestmentNews)
What 5 Measures of Market Valuation Are Saying Right Now (YCharts)
SEC Examiners to Look for ‘Reasonably Designed’ Policies Under New Marketing Rules (WealthManagement.com)
How Well Does the “Buffett Indicator” Predict Market Crashes? (YCharts)
Economic Data
Employment
The unemployment rate rose 0.2 percentage points in August to 3.7%, marking the first increase in seven months. However, the labor force participation rate rose 0.3 percentage points to 62.4% and now sits just one percentage point below its February 2020 high. At the state level, unemployment either remained unchanged or increased across a list of 10 major states with the exception of lower rates in Michigan and Pennsylvania. New York logged the highest MoM unemployment rate increase among major states.
Production and Sales
August yielded mixed production and sales data. US Retail and Food Services Sales grew 0.3%, but the US ISM Manufacturing PMI edged down nearly two full points to 50.9. The ISM Manufacturing PMI has suffered a steady decline in the last twelve months, falling over 10 points but just barely remaining in “expansion” territory.
Housing
Data for US New Single-Family Home Sales surprised to the upside in August. 685K new homes were sold, representing a MoM increase of 28.8% (153K) compared to July. However, existing home data wasn’t as strong: Existing Home Sales slipped by 0.4%, a seventh straight down month, and Existing Home Months’ Supply remained at 3.2, its highest level in two years. The housing market slowdown translated into even lower home prices—the US Existing Home Median Sales Price fell 2.4% in August to $389,500. Finally, 15-Year and 30-Year Mortgage Rates clocked in at 6.0% and 6.7%, respectively.
Consumers and Inflation
The US Inflation Rate cooled in August to 8.26%. However, August’s US Core Inflation print rose 0.4 percentage points to 6.32%, signaling an overall price increase for goods outside of food and energy. The US Consumer Price Index was up a slight 0.12% in August and personal spending increased by 0.39%.
Gold
The price of gold fell 2.6% MoM to $1,671.80 per ounce as of September 30th, and is down 7.4% year-to-date. Gold-related investment vehicles delivered a mixed month of results as well. The SPDR Gold Shares ETF (GLD) slipped 2.9% in September, but the VanEck Gold Miners ETF (GDX) rose 1.3% as some of the fund’s largest constituents bounced back from disappointing earnings.
Oil
Crude oil prices tumbled to their lowest levels since the start of 2022. The spot price for WTI at the end of September was $77.17 (-14.3% MoM) and $82.55 for Brent (-14.5% MoM). However, the lower oil prices have yet to translate to savings at the gas pump. The average price of regular gas was $3.83 per gallon in the final week of September, representing just a 2.7% MoM decline. Regular gas is currently 13.3% more expensive since 2022 began, but 25% below its June high. Premium gas prices fell only 1.2% MoM to $4.60 per gallon at the end of September.
Cryptocurrencies
Falling temperatures and a new Game of Thrones prequel series can only mean one thing: winter is coming. For Bitcoin and Ethereum holders, however, the “crypto winter” only grew colder in September. The price of Bitcoin slipped 1.2% in September to $19,564 as of month’s end. Ethereum plummeted 12.4% to settle at $1,336. Binance Coin holders enjoyed a second consecutive month of gains, up 0.9% to $283.75 as of September 30th, though year-to date performance remains firmly in the red. Binance Coin is 45.0% lower YTD, Bitcoin is down 59.6%, and Ethereum is off 65.6%.
Fixed Income Performance
US Treasury Yield Curve
1 Month Treasury Rate: 2.79%
3 Month Treasury Rate: 3.33%
6 Month Treasury Rate: 3.92%
1 Year Treasury Rate: 4.05%
2 Year Treasury Rate: 4.22%
3 Year Treasury Rate: 4.25%
5 Year Treasury Rate: 4.06%
10 Year Treasury Rate: 3.83%
20 Year Treasury Rate: 4.08%
30 Year Treasury Rate: 3.79%
Download Visual | Modify in YCharts
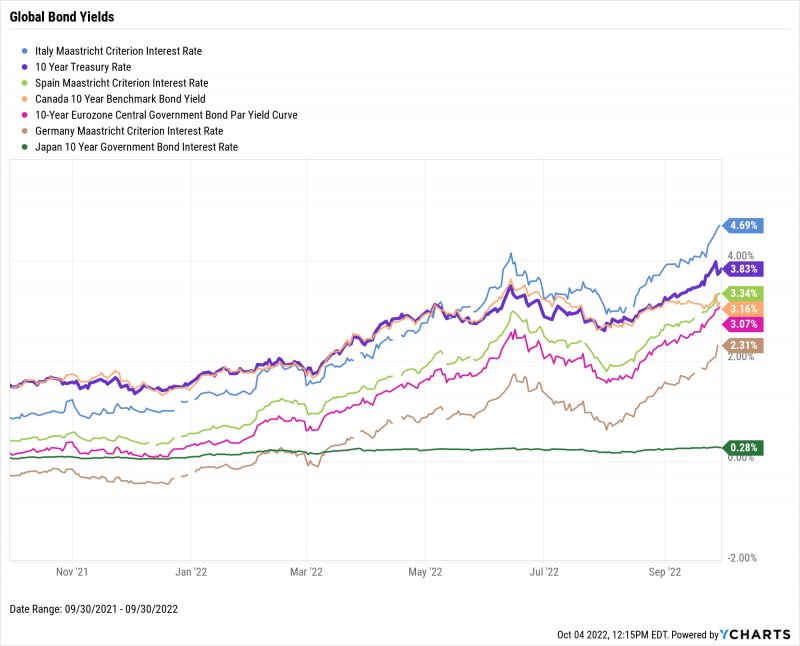
Global Bonds
Italy Long Term Bond Interest Rate: 4.69%
10 Year Treasury Rate: 3.83%
Spain Long Term Bond Interest Rate: 3.34%
Canada 10 Year Benchmark Bond Yield: 3.16%
10-Year Eurozone Central Government Bond Par Yield: 3.07%
Germany Long Term Bond Interest Rate: 2.31%
Japan 10 Year Government Bond Interest Rate: 0.28%
Download Visual | Modify in YCharts
Have a great October! 📈
If you haven’t yet, subscribe to the YCharts Monthly Market Wrap here: