Q1 2022 Fund Flows: March Buyers Bring April Sellers?
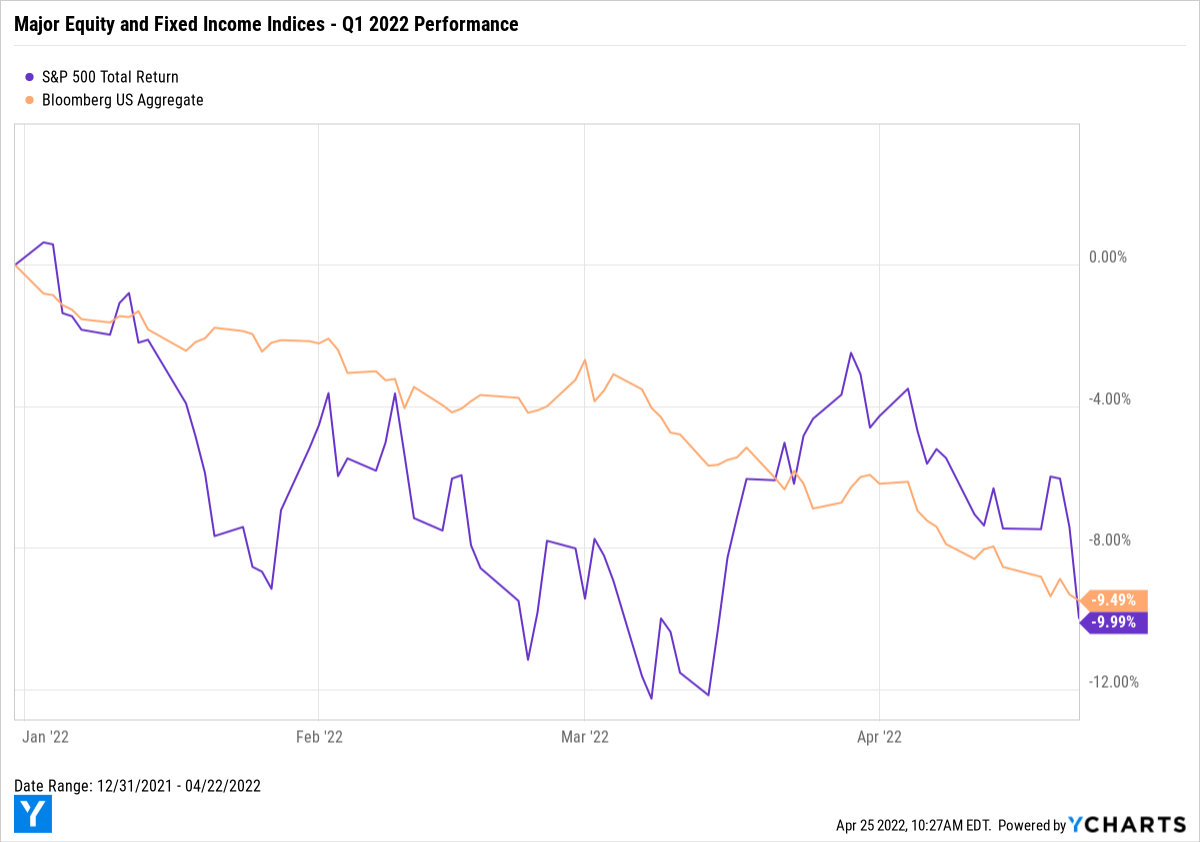
2021 ended with double-digit returns by stocks for the sixth straight year in a row. Through one quarter of 2022, there is clearly a lot of ground to make up.
The S&P 500 (^SPX) and Bloomberg US Aggregate (^BBUSATR) are off to a rocky start… A late Q1 rally by stocks lost steam in early April, and the indices now sit 9.5% and 10.0% lower, respectively, year-to-date.
Download Visual | Modify in YCharts
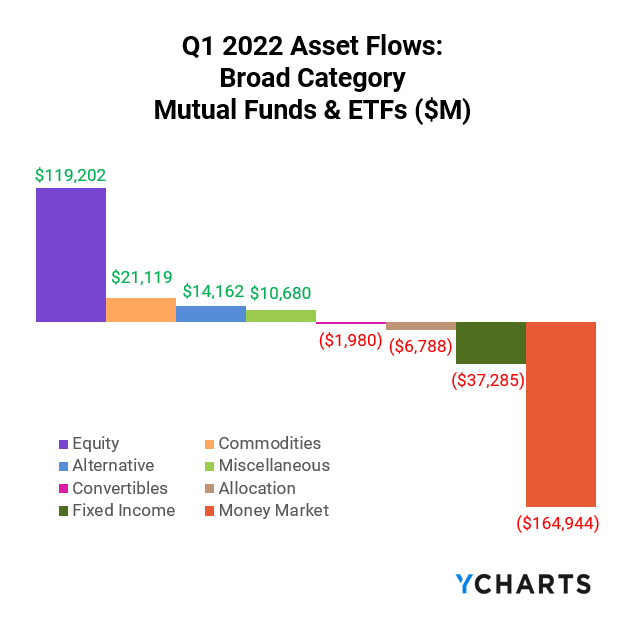
Last year, Fixed Income and Money Market led all fund categories in terms of net new assets. In early 2022, investors switched gears to being “risk-on”, and apparently tried to “buy the dip”—Equity funds’ Q1 asset flows topped $119.2B. Unfortunately, equities have continued dipping.
What does fund flows data say about investor sentiment heading into Q2 2022? Will everyone who “bought the dip” at the start of the year be rewarded in the coming months? And how will they react to continued volatility, higher inflation, rising interest rates, and further geopolitical turmoil?
So far, it looks like buyers from March have become sellers in April…
Want the latest Fund Flows reports sent straight to your inbox each month? Subscribe here:
Fund flows are the net cash inflow into a fund (purchases) or net outflow from a fund (redemptions). Irrespective of fund performance, when a mutual fund or ETF has positive fund flows (or net issuances for ETFs) in a given period, that fund’s managers then have more cash to buy more holdings. The opposite is also true: as fundholders sell shares, fund managers sell out of positions and use the cash to pay redemptions.
This means that fund flow data can indicate higher or lower demand for different asset types, depending on which funds and categories have relatively large inflows or outflows.
Are you discussing fund flows with advisors and clients? Reach out to see how YCharts improves the quality and efficiency of your sales conversations.
Mutual Fund Flows: Biggest Winners and Losers
Bank Loan mutual funds continued to generate investor interest, raking in $17.9B this quarter and $43.9B in asset flows over the last year. Bank Loan funds are believed to be better suited for rising rate environments as their payments can float based on prevailing interest rates.
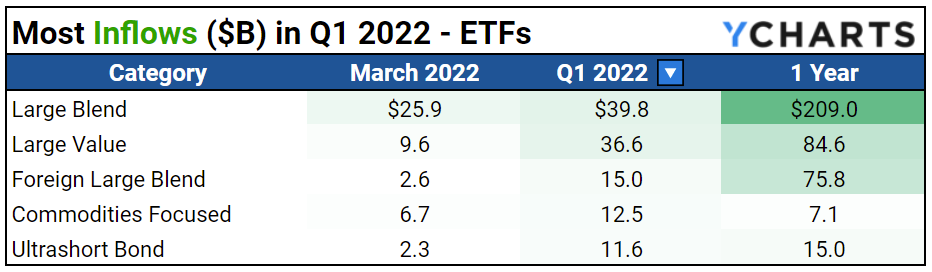
Investors sought diversification via World Bond-USD Hedged, the quarter’s biggest mutual fund winner with $29.4B in positive flows. But excitement about a buying opportunity in early March triggered asset flows totaling $22.4B to Large Blend mutual funds.

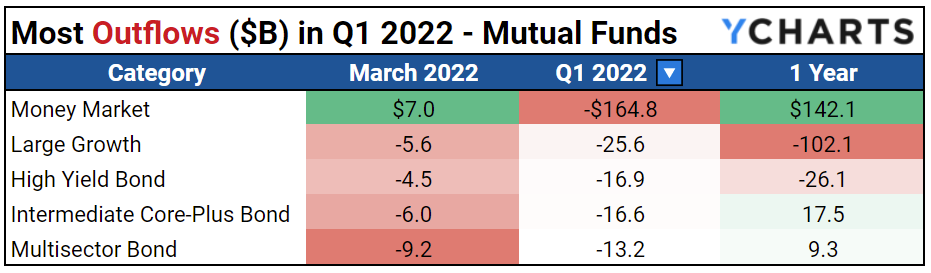
While Money Market mutual funds were the most popular in 2021, Q1 of 2022 put an immediate halt to that trend: nearly a third of Money Market’s flows from last year were pulled from those funds, totaling $164.8B.
The US bond market also took a hit this quarter. High Yield Bond, Intermediate Core-Plus Bond, and Multisector Bond mutual funds lost investor confidence with combined net outflows of $46.7B, potentially a reaction to rising rates and falling bond prices.
ETF Flows: Biggest Winners and Losers
Commodities ETFs were a favorite amongst investors in Q1 2022, a quarter in which they drove $12.5B in new net assets to the category. Considering commodities were the only major asset class with positive returns in Q1, and they proved to be an effective hedge against inflation, this appears to have been a smart short-term move.
Again, investors weren’t very concerned by equities’ poor returns to start the year, as Large Blend and Large Value ETFs garnered $39.8B and $36.6B in Q1.
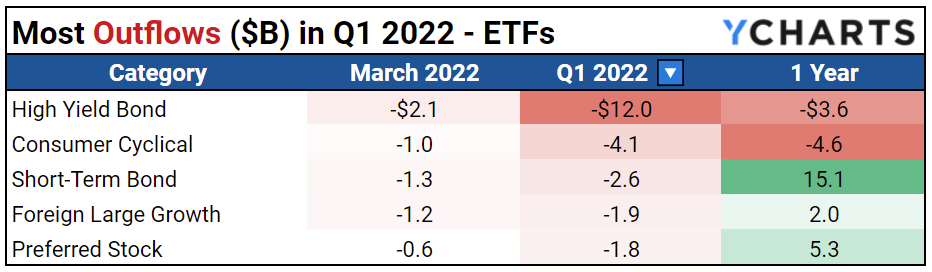
Looking to mitigate risk, investors steered clear of High Yield Bond’s sensitivity to rising rates and drove net negative asset flows of $12B for the category. Consumer Cyclical and Foreign Large Growth also fell out of favor as other hard-hit categories in Q1, losing $4.1B and $1.9B in net assets, respectively.
Equity Style Fund Flows and Performance
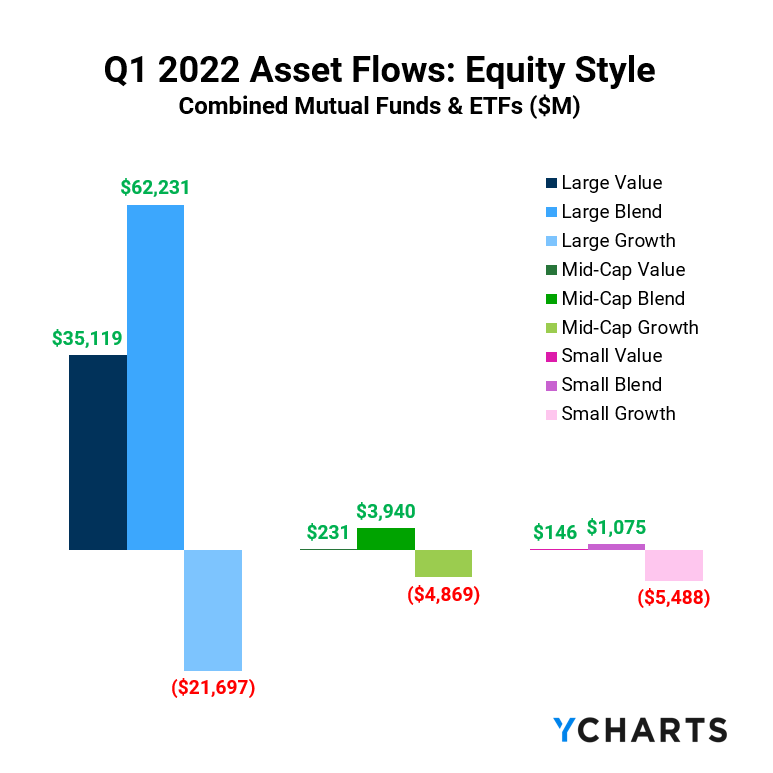
The table below shows a summation of combined mutual fund and ETF fund flows, plus average category performance, for the nine equity style boxes.
Consistent across all market cap sizes, investors dumped growth funds amid bottom-of-the-barrel performances. Growth clocked-in -9.8%, -11.3%, and -11.9% returns year-to-date for Large, Mid, and Small Cap sizes, respectively.
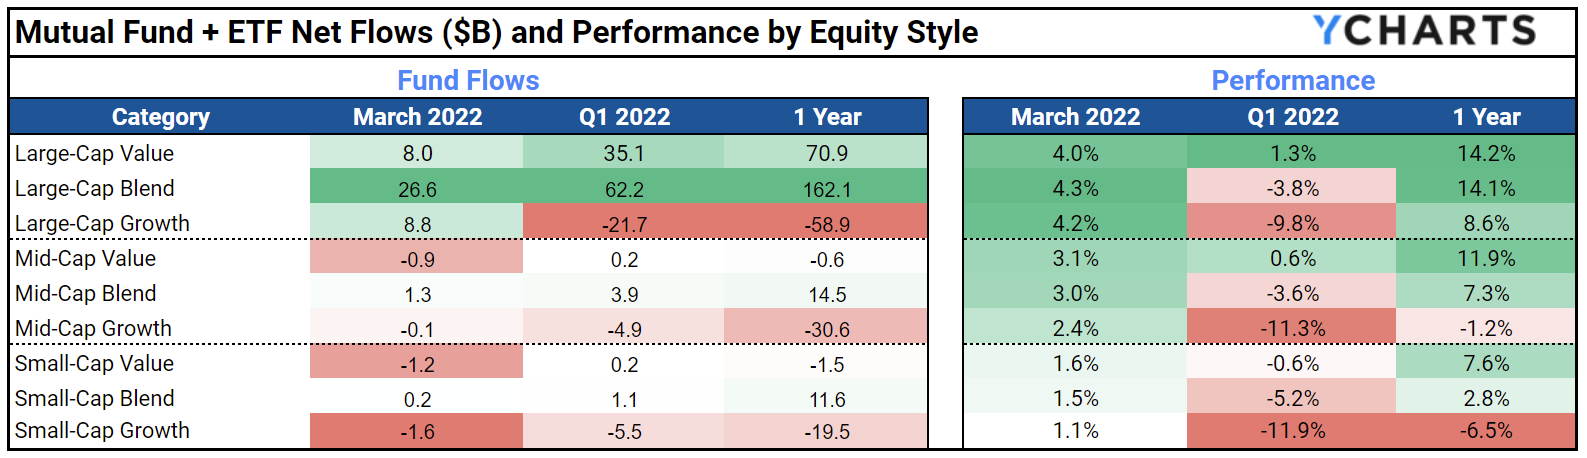
While Large Cap Value distinguished itself as the performance winner of Q1, though up by just 1.3%, investors weren’t sold and instead directed $62.2B in net asset traffic towards Large Cap Blend funds, despite the category’s -3.8% return.
Q1 Active Loses Momentum as Passive Continues to be Favored in 2022
As has been the pattern for some time, investors strongly favored passive ETFs over active mutual funds. $132.8B was redeemed from actively managed funds, this quarter’s “biggest loser”, and passive ETFs ballooned by $174.4B.

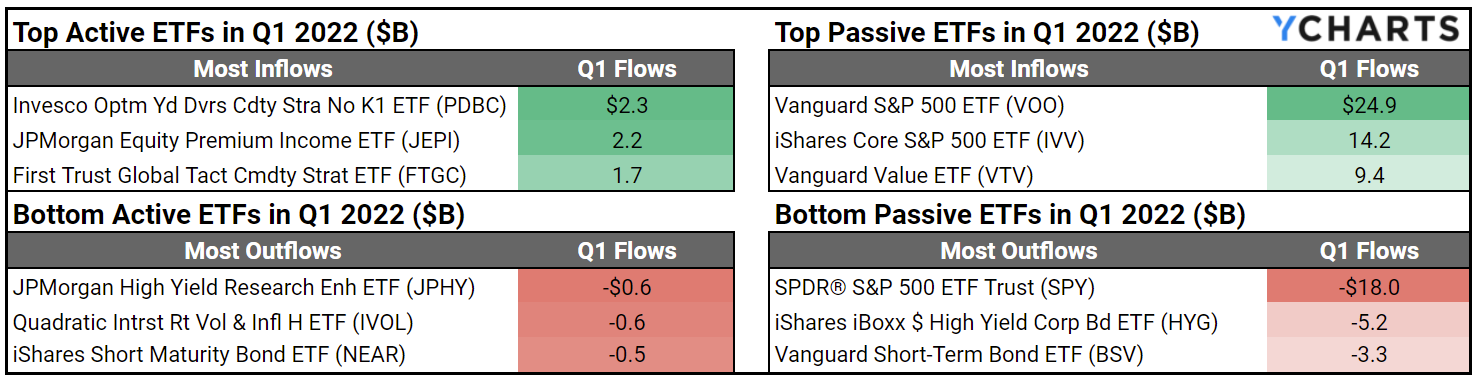
While the Fed hiked rates in mid-March with the hopes of controlling rising inflation, things do not look to be slowing down anytime soon. To protect their investments, investors sought inflation safe havens via commodities-centric funds like the Invesco Optimum Yield Diversified Commodity Strategy No K-1 ETF (PDBC) and First Trust Global Tactical Commodity Strategy ETF (FTGC), which collected $2.3B and $1.7B in asset inflows, respectively.
Meanwhile, investors pulled $5.2B from iShares iBoxx $ High Yield Corp Bond ETF (HYG) in Q1 2022. High-yield corporate bonds are usually the first ones to go when de-risking, and considering Q2 2022 saw a brief inversion to the 10-2 Year Treasury Yield Spread, investors may be trying to recession-proof their portfolios before it’s too late.
Equity Flows Skyrocket, But Investors Try to Mitigate Risk in Q1
“Risk-on” activity was in full swing in Q1, as investors placed their bets on “buying the dip”. The S&P 500’s underwhelming run year-to-date does not seem to pose a threat to their mindset, but only time will tell if investors will regret these early moves.
Rising inflation, market volatility, and geopolitical uncertainties all continue to pose major risks to investor portfolios with none of them looking to be under control or even predictable in the near future. Commodities look promising as nearly every other asset class has started 2022 in the red, but can they extend their run into and beyond Q2?
Connect with YCharts
To learn more, schedule time to meet with an asset management specialist, call us at (773) 231-5986, or email hello@ycharts.com.
Want to add YCharts to your technology stack? Sign up for a 7-Day Free Trial to see YCharts for yourself.
Disclaimer
©2022 YCharts, Inc. All Rights Reserved. YCharts, Inc. (“YCharts”) is not registered with the U.S. Securities and Exchange Commission (or with the securities regulatory authority or body of any state or any other jurisdiction) as an investment adviser, broker-dealer, or in any other capacity, and does not purport to provide investment advice or make investment recommendations. This report has been generated through the application of the analytical tools and data provided through ycharts.com and is intended solely to assist you or your investment or other adviser(s) in conducting investment research. You should not construe this report as an offer to buy or sell, as a solicitation of an offer to buy or sell, or as a recommendation to buy, sell, hold, or trade, any security or other financial instrument. For further information regarding your use of this report, please go to: ycharts.com/about/disclosure.