Q2 2022 Fund Flows: Short-Duration Bonds & A Gamble on Alts
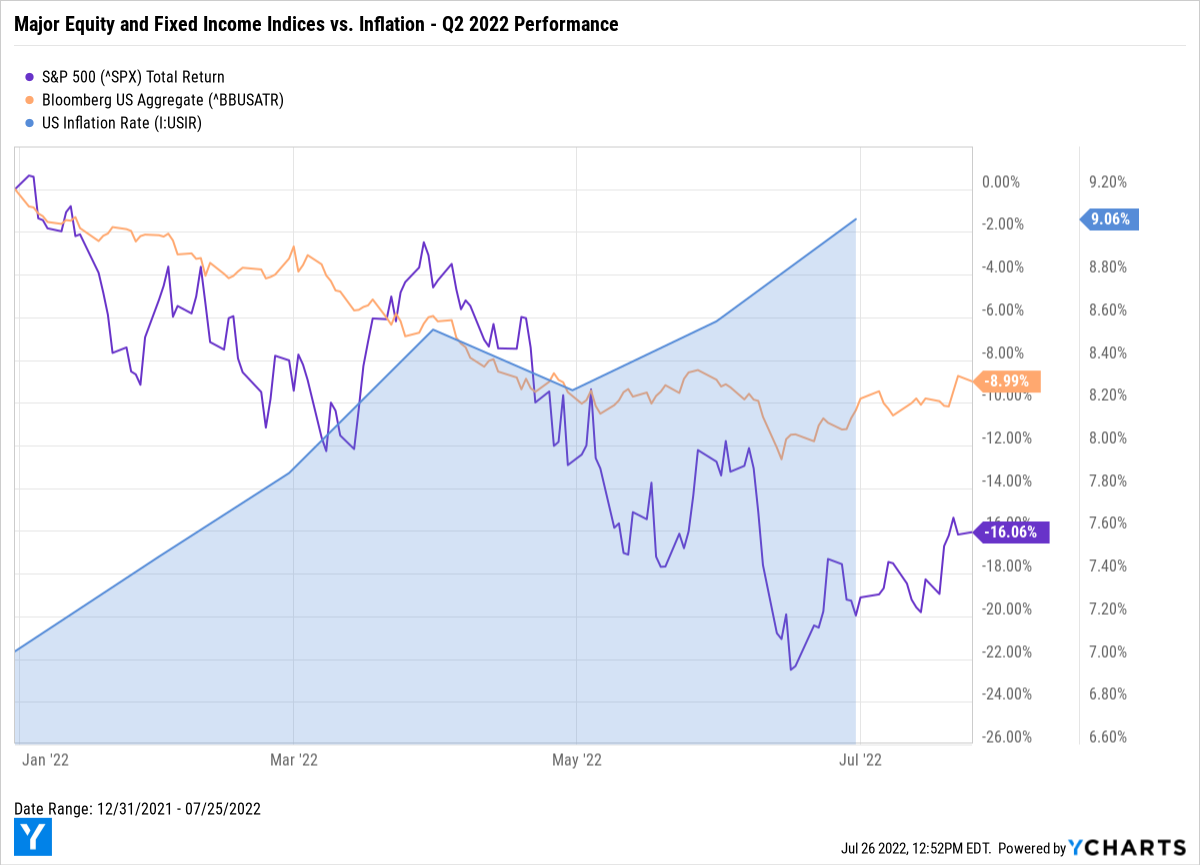
Through Q2 2022, the S&P 500 (^SPX) and Bloomberg US Aggregate (^BBUSATR) plummeted even further to be down 16.06% and 8.99% year-to-date, respectively. Inflation isn’t doing stocks or bonds any favors and continues to climb despite the Fed’s rate hikes.
Looking back at asset flows data from Q1, it appeared that many investors tried to “buy the dip”, but Q2 performance has exposed this activity as premature. With further rate hikes anticipated and speculation that the US economy is entering a recession (or already has), a market turnaround is certainly still in question.
Download Visual | Modify in YCharts
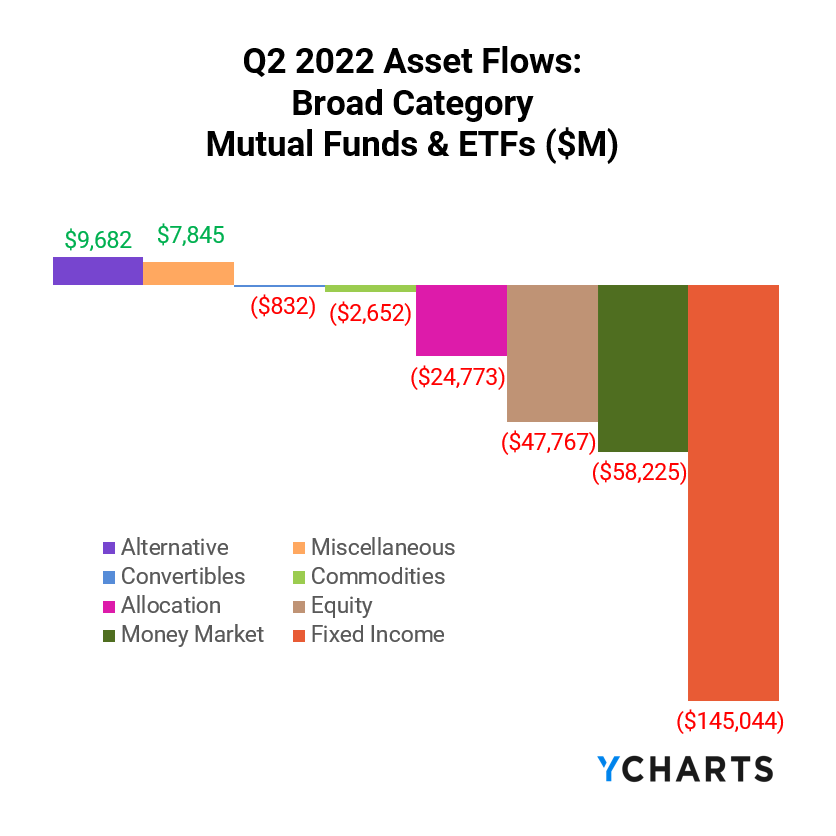
While strong asset flows into Equity funds in Q1 hinted at “risk-on” behavior, the tables turned and the category posted outflows of $47.8B in Q2. While a minority of individuals took their chances on Alternatives and Miscellaneous funds, most investors de-risked in response to volatility, rising inflation, geopolitical impacts from the Ukraine war, and global supply chain issues throughout the quarter.
In the current rising rate environment, Fixed Income was hit hardest and lost more than $145B in net assets. Notably, there was a clear flight-to-safety within bond funds as only government-backed vehicles garnered new assets to end the quarter.
Fund flows are the net cash inflow into a fund (purchases) or net outflow from a fund (redemptions). Irrespective of fund performance, when a mutual fund or ETF has positive fund flows (or net issuances for ETFs) in a given period, that fund’s managers then have more cash to buy more holdings. The opposite is also true: as fundholders sell shares, fund managers sell out of positions and use the cash to pay redemptions.
This means that fund flow data can indicate higher or lower demand for different asset types, depending on which funds and categories have relatively large inflows or outflows.
Are you discussing fund flows with advisors and clients? Reach out to see how YCharts improves the quality and efficiency of your sales conversations.
Mutual Fund Flows: Biggest Winners and Losers
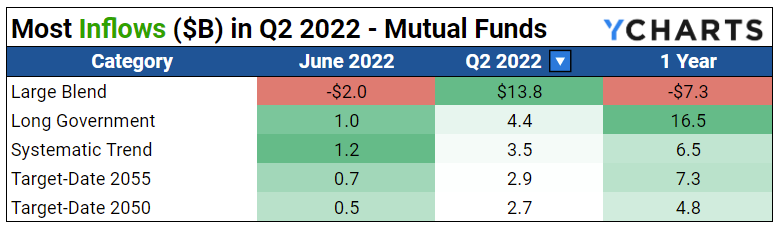
Slowing inflation in late April sparked excitement and $33.7B of new net asset flows into Large Blend in May. Unfortunately, the fun was short-lived as inflation reversed course, and the S&P 500 fell into bear market territory in mid-June. Investors reacted likewise by pulling $2B from the category.
Safe bets were taken as investors moved into Long Government and target date mutual funds. Interestingly enough, Systematic Trend funds, an Alternative broad category in which strategies employ long and short liquid global futures, options, swaps, and foreign-exchange contracts, gained some traction and saw $3.5B in net inflows, perhaps as investors looked to diversify their holdings.
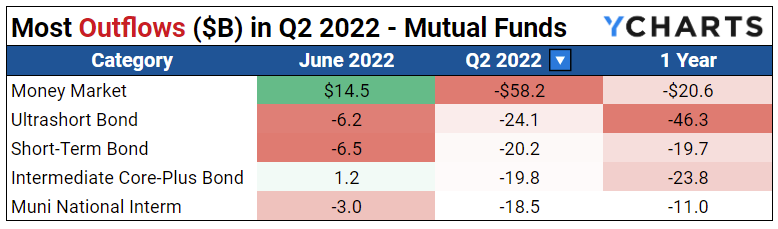
With no end in sight for rising interest rates, investors lost confidence in fixed income and fled Intermediate Core-Plus mutual funds, resulting in $19.8B in net outflows. While Money Market mutual funds saw the most outflows in Q2, investors in June decided to park their money in lieu of investing it and moved $14.5B into the category. Additionally, Ultrashort Bond mutual funds were swapped out for their ETF counterparts, losing $24.1B in assets in Q2.
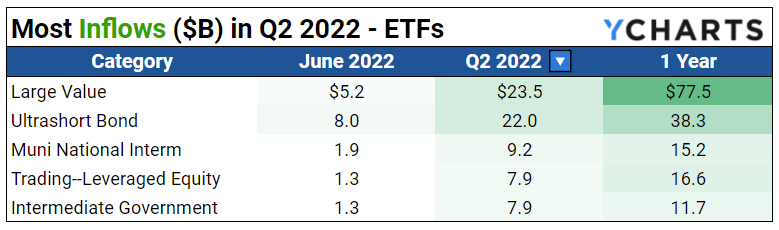
ETF Flows: Biggest Winners and Losers
In terms of both asset flows and performance, Value and Growth have jockeyed back and forth since the COVID market crash, but now it seems investors have picked a lane, preferring Value, as Large Value ETFs picked up $23.5B in Q2 amid rising inflation & interest rates.
In addition to government-backed bond funds, Ultrashort Bond ETFs gained momentum. Investors sought this fixed income category’s low duration and low interest rate sensitivity attributes and moved $23.5B into the category. Intermediate Government rounded out the top five for this quarter with $7.9B in net inflows.
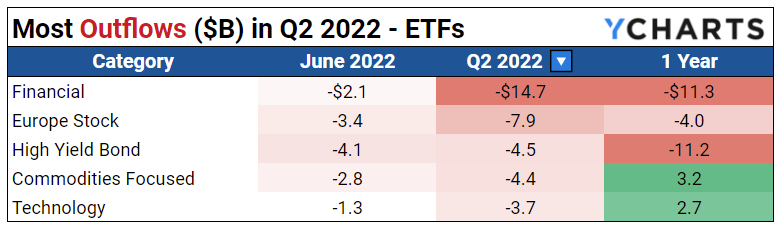
While banks recently beat their earnings estimates, investors pulled $14.7B out of Financial ETFs, the quarter’s biggest loser category. Rising rates generally benefit a bank’s revenue stream from a lending perspective, but investors don’t seem optimistic about the sector. If the current macroeconomic landscape worsens, banks could experience a higher percentage of defaults over the next couple of months – not exactly an investor’s favorite pony to bet on.
Surprisingly in light of performance, Commodities Focused ETFs experienced significant outflows, a favorite in Q1 and during periods of rapid inflation, and lost $4.4B in assets. When tracking the S&P GSCI Total Return, the index outpaced the S&P 500 31.82% to -16.06% year-to-date. Do investors think this trade is over?
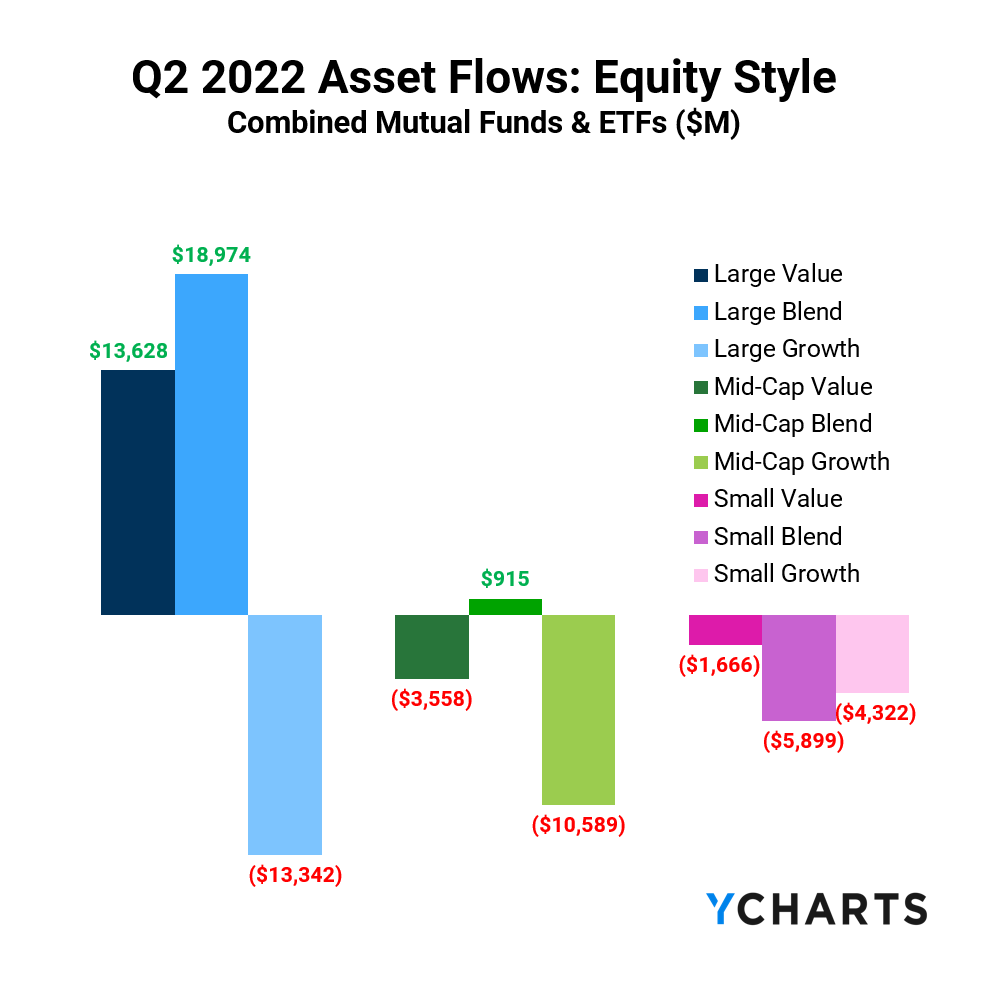
Equity Style Fund Flows and Performance
The table below shows a summation of combined mutual fund and ETF fund flows, plus average category performance, for the nine equity style boxes.
Value funds across the board experienced the least amount of bleeding during Q2 and the trailing twelve months, but Blend marginally outperformed Value across all market cap sizes in June. Additionally, Large Cap Blend was hit the hardest in Q2 compared to its Mid-Cap and Small-Cap counterparts – indicating that size may not be a major factor in recent risk assessments.
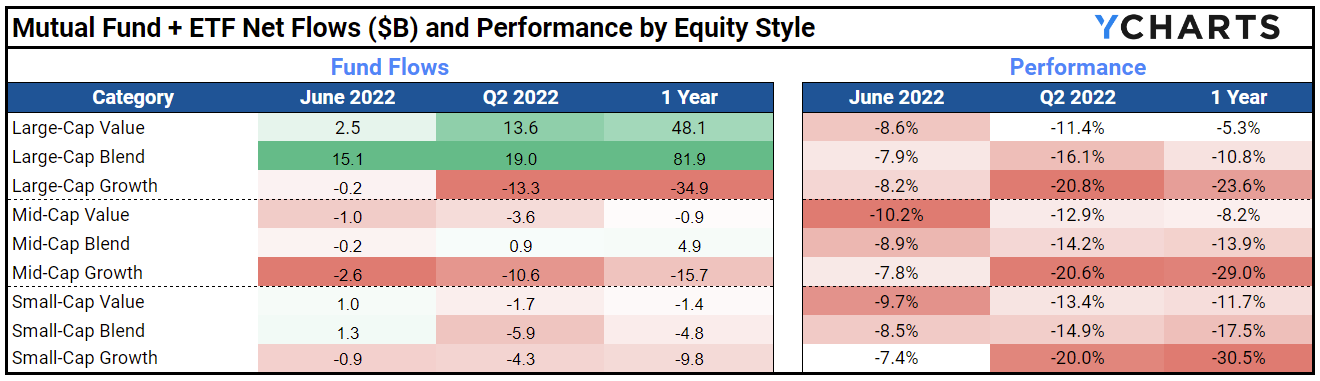
Overall, investors are losing confidence in equities. Q1 2022 saw $62.2B and $35.1B move into Large Blend & Large Value, respectively. And while the same categories received the most asset flows in Q2, investors put in less than half of what was invested in Q1.
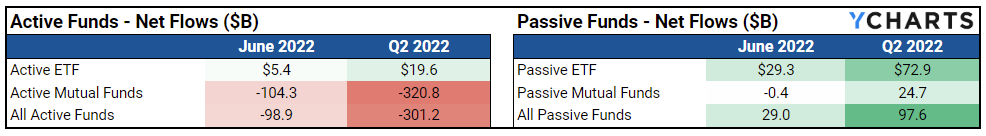
Investors Evacuate Active Mutual Funds, Lean Into Passive
Investors were not willing to risk it for the biscuit in Q2 and pulled $320.8B from active mutual funds, more than double the amount lost in Q1. While passive funds garnered about half the positive asset flows compared to last quarter, investor preferences toward broad market exposure, less risk, and lower fees meant that passive’s reign continued on.
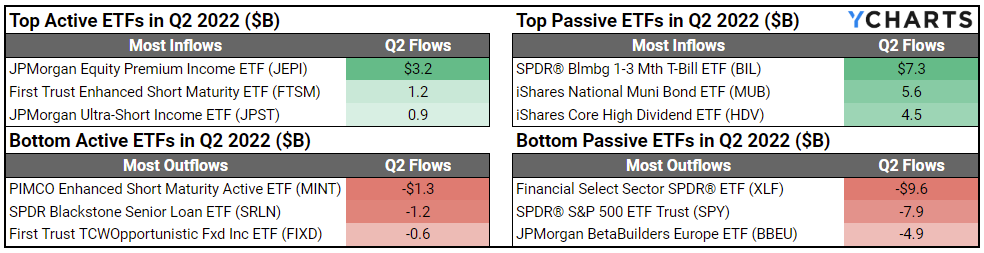
First Trust Enhanced Short Maturity ETF (FTSM), JP Morgan Ultra-Short Income ETF (JPST), and SPDR® Bloomberg 1-3 Month ETF (BIL) were some of the quarter’s biggest winners and were prime examples of investors seeking out short-duration bond investments amid expectations of another Fed rate hike.
For a second consecutive quarter, SPDR® S&P 500 ETF Trust (SPY) lands on the biggest losers list. The fund continues its fall from grace with investors no longer viewing broad market exposure as a “safe bet” during volatility. JPMorgan BetaBuilders Europe ETF (BBEU) also suffered significant outflows of $4.9B as European Equities, tracked via MSCI Europe (^MSEUR), continued to trail the S&P 500 (^SPX) -18.52% to -16.06% year-to-date.
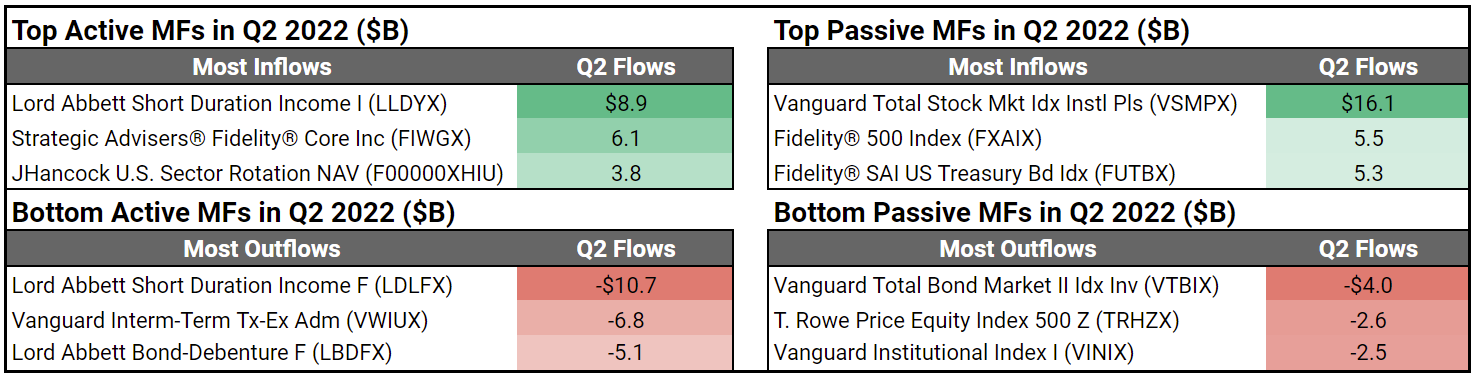
Investors moved into Vanguard Total Stock Market Index Institutional Plus (VSMPX) in droves with $16.1B flowing into the index fund, a stark contrast to the negative flows SPY experienced in Q2. Vanguard Total Bond Market II Index Investor (VTBIX) was hit hard, losing $4.0B in net assets – collateral damage in response to the move away from longer-term fixed income funds.
Investors Seek Refuge from Market Drawdowns Any Way Possible
Investors have embraced the “risk-off” mindset as they brace themselves for the second half of 2022. Inflation, market volatility, geopolitical uncertainties, and supply chain issues may be easing up, but don’t look to be resolving themselves anytime soon. So what should investors do to protect their assets?
With two Fed meetings scheduled for Q3, everyone will be holding their breath and watching to see if any future rate hike will finally put a damper on inflation. It will be interesting to see how investors react in next quarter’s edition of fund flows, which will undoubtedly hinge on the market’s reaction to Fed actions.
Miss our last webinar covering the latest fund flows trends for Q2 2022? Watch the full replay here:
Connect with YCharts
To learn more, schedule time to meet with an asset management specialist, call us at (773) 231-5986, or email hello@ycharts.com.
Want to add YCharts to your technology stack? Sign up for a 7-Day Free Trial to see YCharts for yourself.
Disclaimer
©2022 YCharts, Inc. All Rights Reserved. YCharts, Inc. (“YCharts”) is not registered with the U.S. Securities and Exchange Commission (or with the securities regulatory authority or body of any state or any other jurisdiction) as an investment adviser, broker-dealer, or in any other capacity, and does not purport to provide investment advice or make investment recommendations. This report has been generated through application of the analytical tools and data provided through ycharts.com and is intended solely to assist you or your investment or other adviser(s) in conducting investment research. You should not construe this report as an offer to buy or sell, as a solicitation of an offer to buy or sell, or as a recommendation to buy, sell, hold or trade, any security or other financial instrument. For further information regarding your use of this report, please go to: ycharts.com/about/disclosure