2021 Fund Flows: Fixed Income & Large Blend Win, Growth Loses
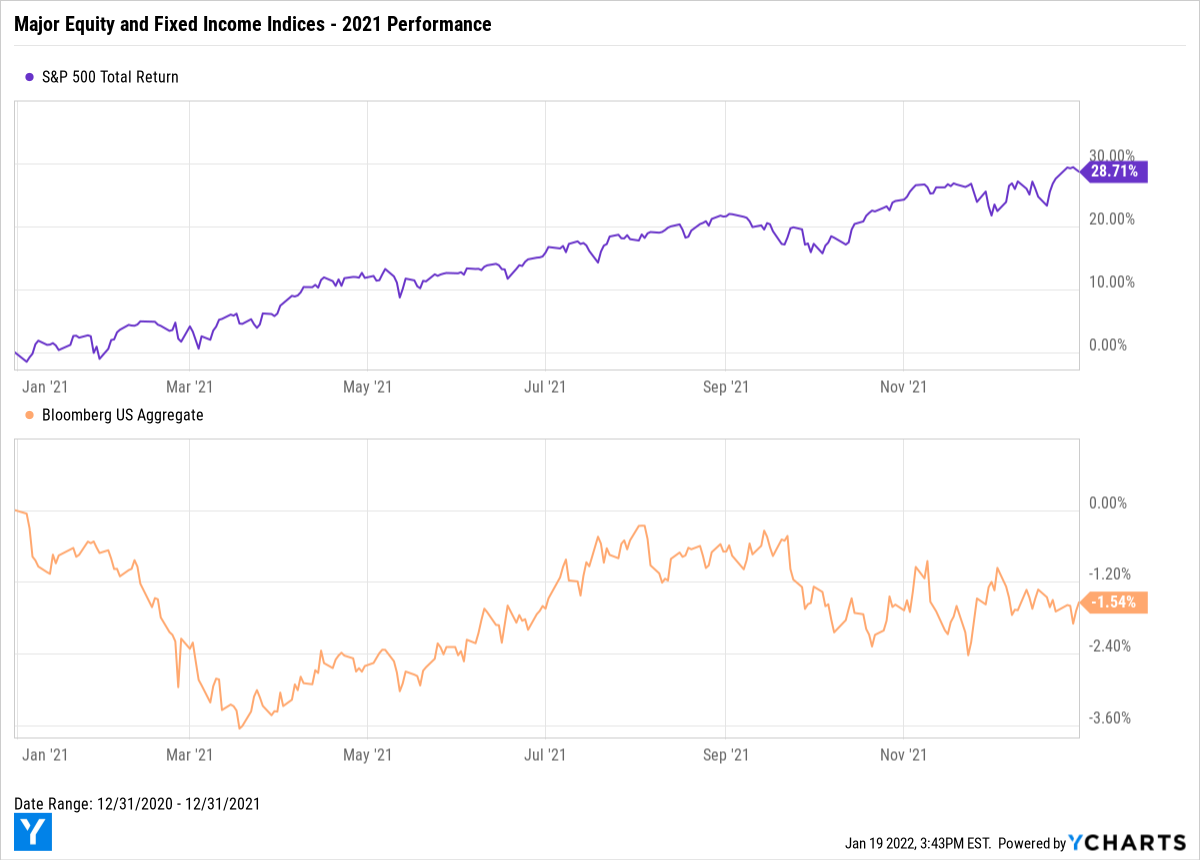
After bouncing back from a Q3 dip and fighting through volatility all year, the S&P 500 (^SPX) ended 2021 just below its all-time high. The index’s 28.7% total return continues quite a streak for stocks, making 2021 the fifth time in the last 6 years that the S&P 500 has posted double-digit returns.
Meanwhile, in fixed income… The Bloomberg US Aggregate (^BBUSATR) hit a calendar year low in March, got close to even in August, but eventually ended the year 1.54% lower as rates began to rise.
Download Visual | Modify in YCharts
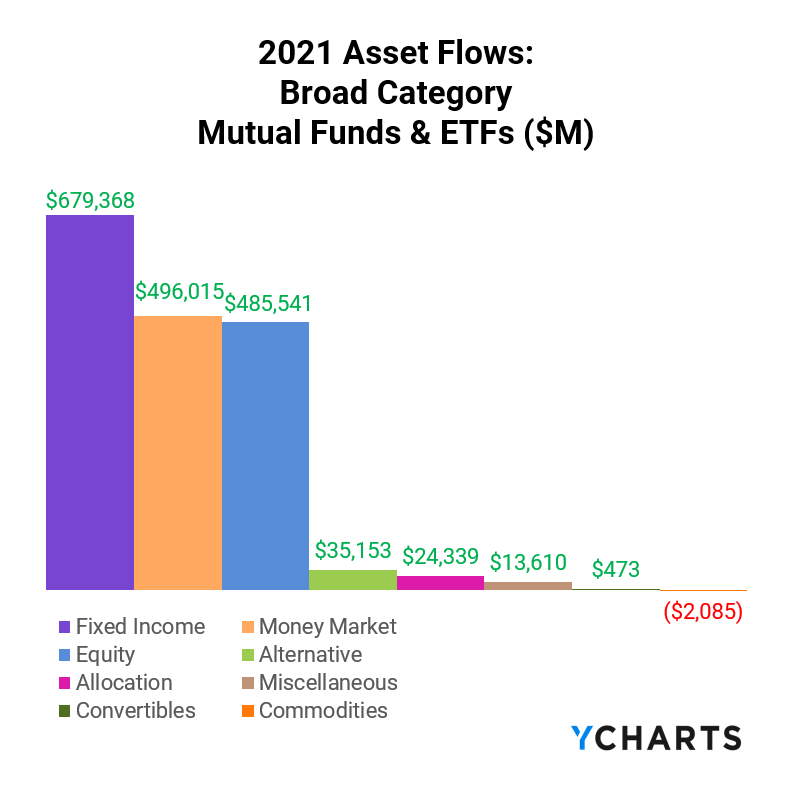
But despite the wide performance gap between equities and bonds, investors have shown they are increasingly risk-averse. Net inflows into Fixed Income and Money Market funds topped $679B and $496B in 2021, respectively. The combined asset flows into these two broad categories were more than double what investors put into equities, despite a 28.7% annual return by the S&P 500 and AGG’s 1.5% decline.
What can fund flows data tell us about investor sentiment heading into 2022? Does the January pull-back by stocks point to continued interest in fixed income funds? And if so, which categories will investors find most attractive in the new year?
To answer these questions, we look to fund flows.
Fund flows are the net cash inflow into a fund (purchases) or net outflow from a fund (redemptions). Irrespective of fund performance, when a mutual fund or ETF has positive fund flows (or net issuances for ETFs) in a given period, that fund’s managers then have more cash to buy more holdings. The opposite is also true: as fundholders sell shares, fund managers sell out of positions and use the cash to pay redemptions.
This means that fund flow data can indicate higher or lower demand for different asset types, depending on which funds and categories have relatively large inflows or outflows.
Are you discussing fund flows with advisors and clients? Reach out to see how YCharts improves the quality and efficiency of your sales conversations.
Mutual Fund Flows: Biggest Winners and Losers
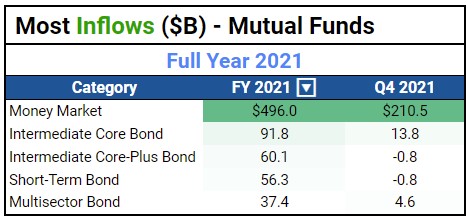
2021’s mutual fund flows mirrored the trends seen in 2020 with Money Market, Immediate Core Bond, Intermediate Core-Plus Bond, and Short-Term Bond ranking similarly in the top four. Money Market mutual funds attracted more than 5x the amount of asset inflows than the second-most popular category, Intermediate Core Bond.
An indication of the extent to which investors put their cash “on the sidelines”, Money Market mutual funds attracted $210.5B in Q4 alone, over 40% of its net fund flows through all of 2021. COVID-19 case spikes due to holiday travel and the Omicron variant were assumedly strong forces that pushed investors away from stocks, and even bonds.
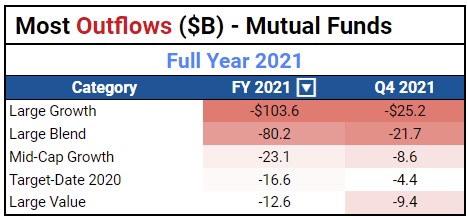
While all five mutual fund categories that attracted the most asset flows in 2021 were of the Fixed Income variety, the five with the largest net-negative flows were all Equity categories.
Large Cap mutual funds just couldn’t catch a break—Large Growth, Large Blend, and Large Value appear in the “biggest loser” table for categories with the most net negative asset flows for the second consecutive year. (The ETF tables below show an interesting, equal-but-opposite trend for Large Cap ETFs in 2021.) Mid-Cap Growth and Target-Date 2020 mutual funds round out the top five with net negative flows totaling $23.1B and $16.6B, respectively.
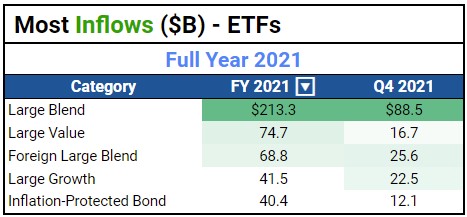
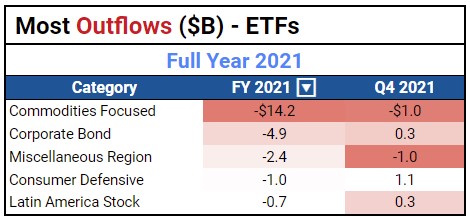
ETF Flows: Biggest Winners and Losers
Large Cap ETFs, unlike their mutual fund cousins, were among the most popular in 2021. Large Blend attracted the most attention and ended the year with $213.3B of new net assets—investors seemingly didn’t want to choose between value and growth.
Foreign Large Blend ETFs posted $68.8B of net positive asset flows on the year, while Inflation-Protected Bond ETFs maintain investors’ interest as inflation rose past 7% with no signs of slowing.
Commodities Focused ETFs were the biggest loser of 2021. A total of $14.2B was pulled from these ETFs as gold falls out of favor as an inflation hedge, a rare occurrence given rising inflation.
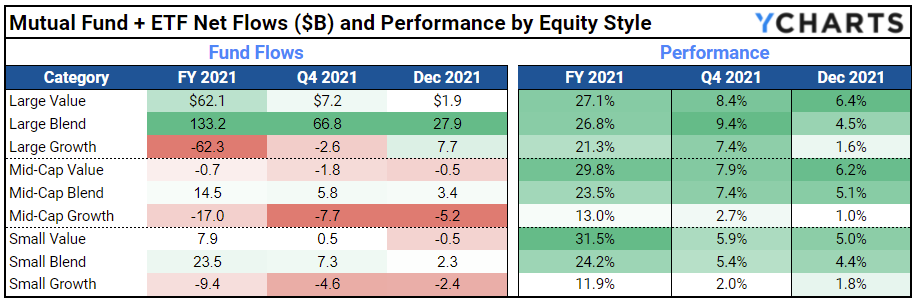
Equity Style Fund Flows and Performance
In 2021 investors pulled money from growth funds of all sizes. Large Growth, Mid-Cap Growth, and Small Growth had net negative asset flows of $62.3B, $17B, and $9.4B, respectively.
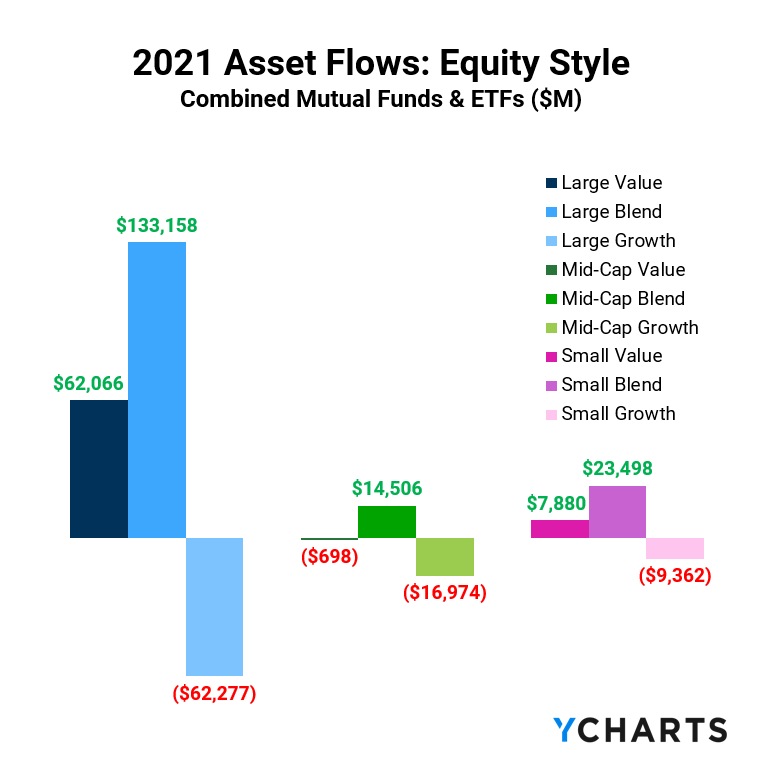
In retrospect, this proved to be the wise move as Growth funds lagged Value and Blend styles across Large, Mid, and Small Caps, returning 21.3%, 13%, and 11.9% in 2021, respectively.
Q4 Active Loses Momentum as Passive Marginally Favored in 2021
In 2021, investors directed $1.56T to passive mutual funds and ETFs, edging out active funds which ended the year with $1.29T in net asset flows. While investors pooled a total of $695.5B in passive ETFs, over 8x what was invested in active ETFs, asset flows into active mutual funds eclipsed those of passive ones by almost 40%.
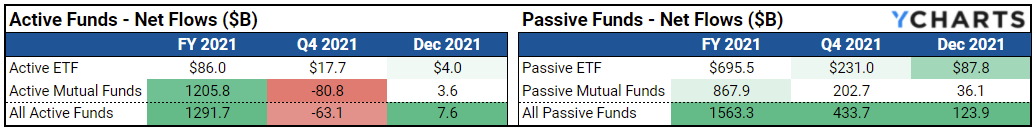
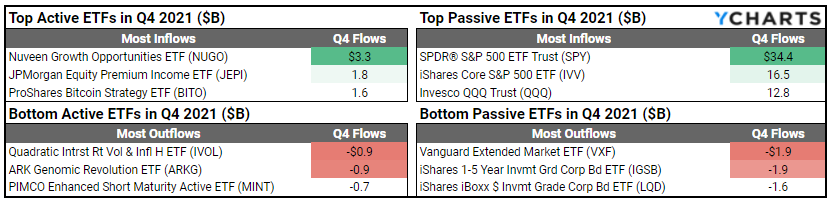
Investor appetite for Bitcoin and cryptocurrencies was a popular talking point in 2021, exemplified by ProShares Bitcoin Strategy ETF (BITO) collecting $1.6B of asset flows, despite its recent debut in October 2021.
Looking closer at the active and passive ETFs with the largest net positive and net negative flows in Q4 2021, Vanguard’s Extended Market ETF (VXF) was the biggest loser with Q4 outflows of $1.9B. The Nuveen Growth Opportunities ETF (NUGO), which also debuted in late 2021, was the year’s most popular active ETF.
Where will the money go in 2022?
“Risk-off” activity in 2021 has so far been justified in 2022, with the S&P 500 down more than 5% after just a few weeks of trading. With no end in sight for rising inflation rates, investors may continue the current trend with Fixed Income funds seeing the lion’s share of new assets early in the year.
All that said, stocks showed some bouts of volatility in 2021 but went on to gain 28% in the year. Nothing is certain at this point, except that we’ll see you next quarter for another recap of the latest fund flows for Q2 2022!
Connect with YCharts
To learn more, schedule time to meet with an asset management specialist, call us at (773) 231-5986, or email hello@ycharts.com.
Want to add YCharts to your technology stack? Sign up for a 7-Day Free Trial to see YCharts for yourself.
Disclaimer
©2022 YCharts, Inc. All Rights Reserved. YCharts, Inc. (“YCharts”) is not registered with the U.S. Securities and Exchange Commission (or with the securities regulatory authority or body of any state or any other jurisdiction) as an investment adviser, broker-dealer or in any other capacity, and does not purport to provide investment advice or make investment recommendations. This report has been generated through application of the analytical tools and data provided through ycharts.com and is intended solely to assist you or your investment or other adviser(s) in conducting investment research. You should not construe this report as an offer to buy or sell, as a solicitation of an offer to buy or sell, or as a recommendation to buy, sell, hold or trade, any security or other financial instrument. For further information regarding your use of this report, please go to: ycharts.com/about/disclosure.
Next Article
Can You Hedge Inflation with an ETF? Or Bitcoin?Read More →