Recession Forecasting with Michael Gayed
FEATURING THE LEAD-LAG REPORT‘S PUBLISHER, MICHAEL GAYED
I’m a firm believer that when it comes to examining current economic and market conditions, the bond market gets it right more often than the stock market. With inflation rates soaring and the Fed ending its years-long ultra-loose monetary policy conditions, the big question is whether or not the Fed will be able to navigate this challenging environment. The bond market, based on the shape of the Treasury yield curve, doesn’t think it can. The Fed may want to achieve both inflation control and economic growth, but it may have to choose between one or the other.
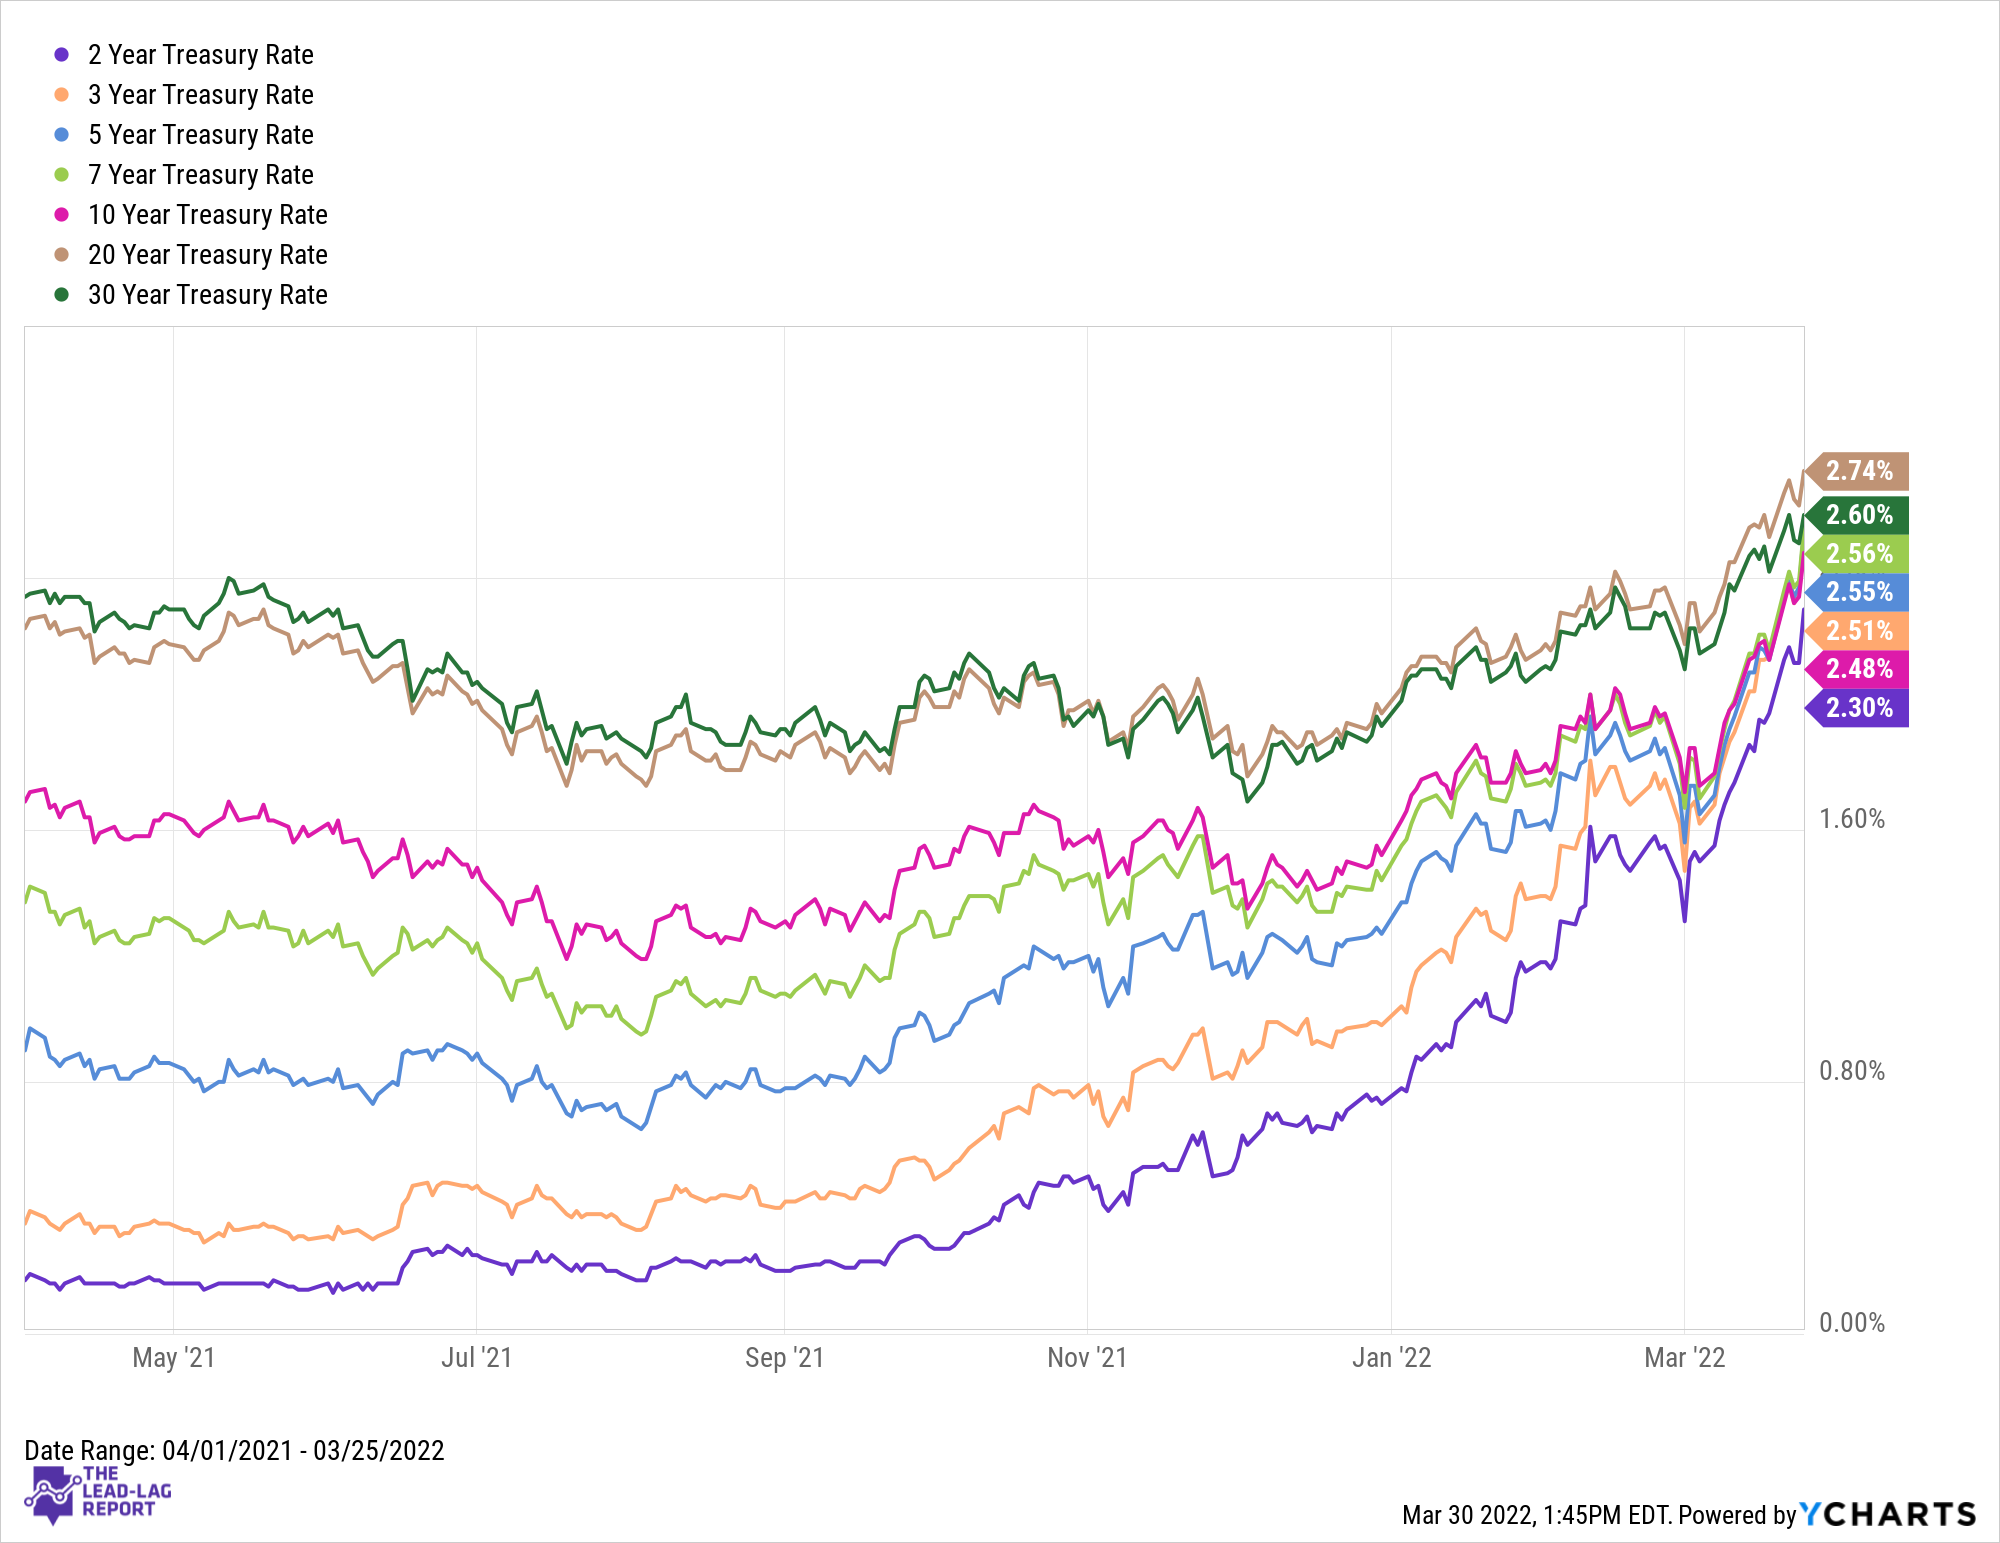
The yield curve started to shift during the 2nd half of 2021 when it became clear the Fed would begin tightening.
Download Visual l Modify in YCharts

This flattening of the curve only accelerated when the Fed indicated at its December meeting that the cycle launch would begin in Q1 2022. As you can see above, the middle of the curve (3 years to 10 years) is effectively flat. Parts of the Treasury curve have already inverted, including the 10Y/3Y and the 30Y/20Y.
What does this all mean and why are Treasury yield curve inversions important indicators of the economy?
The short end of the yield curve generally reflects short-term expectations of what the Fed will do with interest rates. Market participants generally use either the 2-year yield or 3-month yield to measure this. The long end of the curve is reflective of long-term Fed interest rate policy decisions and/or future growth expectations. If the rate curve becomes inverted, it’s an indication that the market expects rates to be lower in the future than today. That typically means rate cuts and those are usually associated with a slowdown in growth.
This is evident by what these yields have done over the past year.
Download Visual l Modify in YCharts
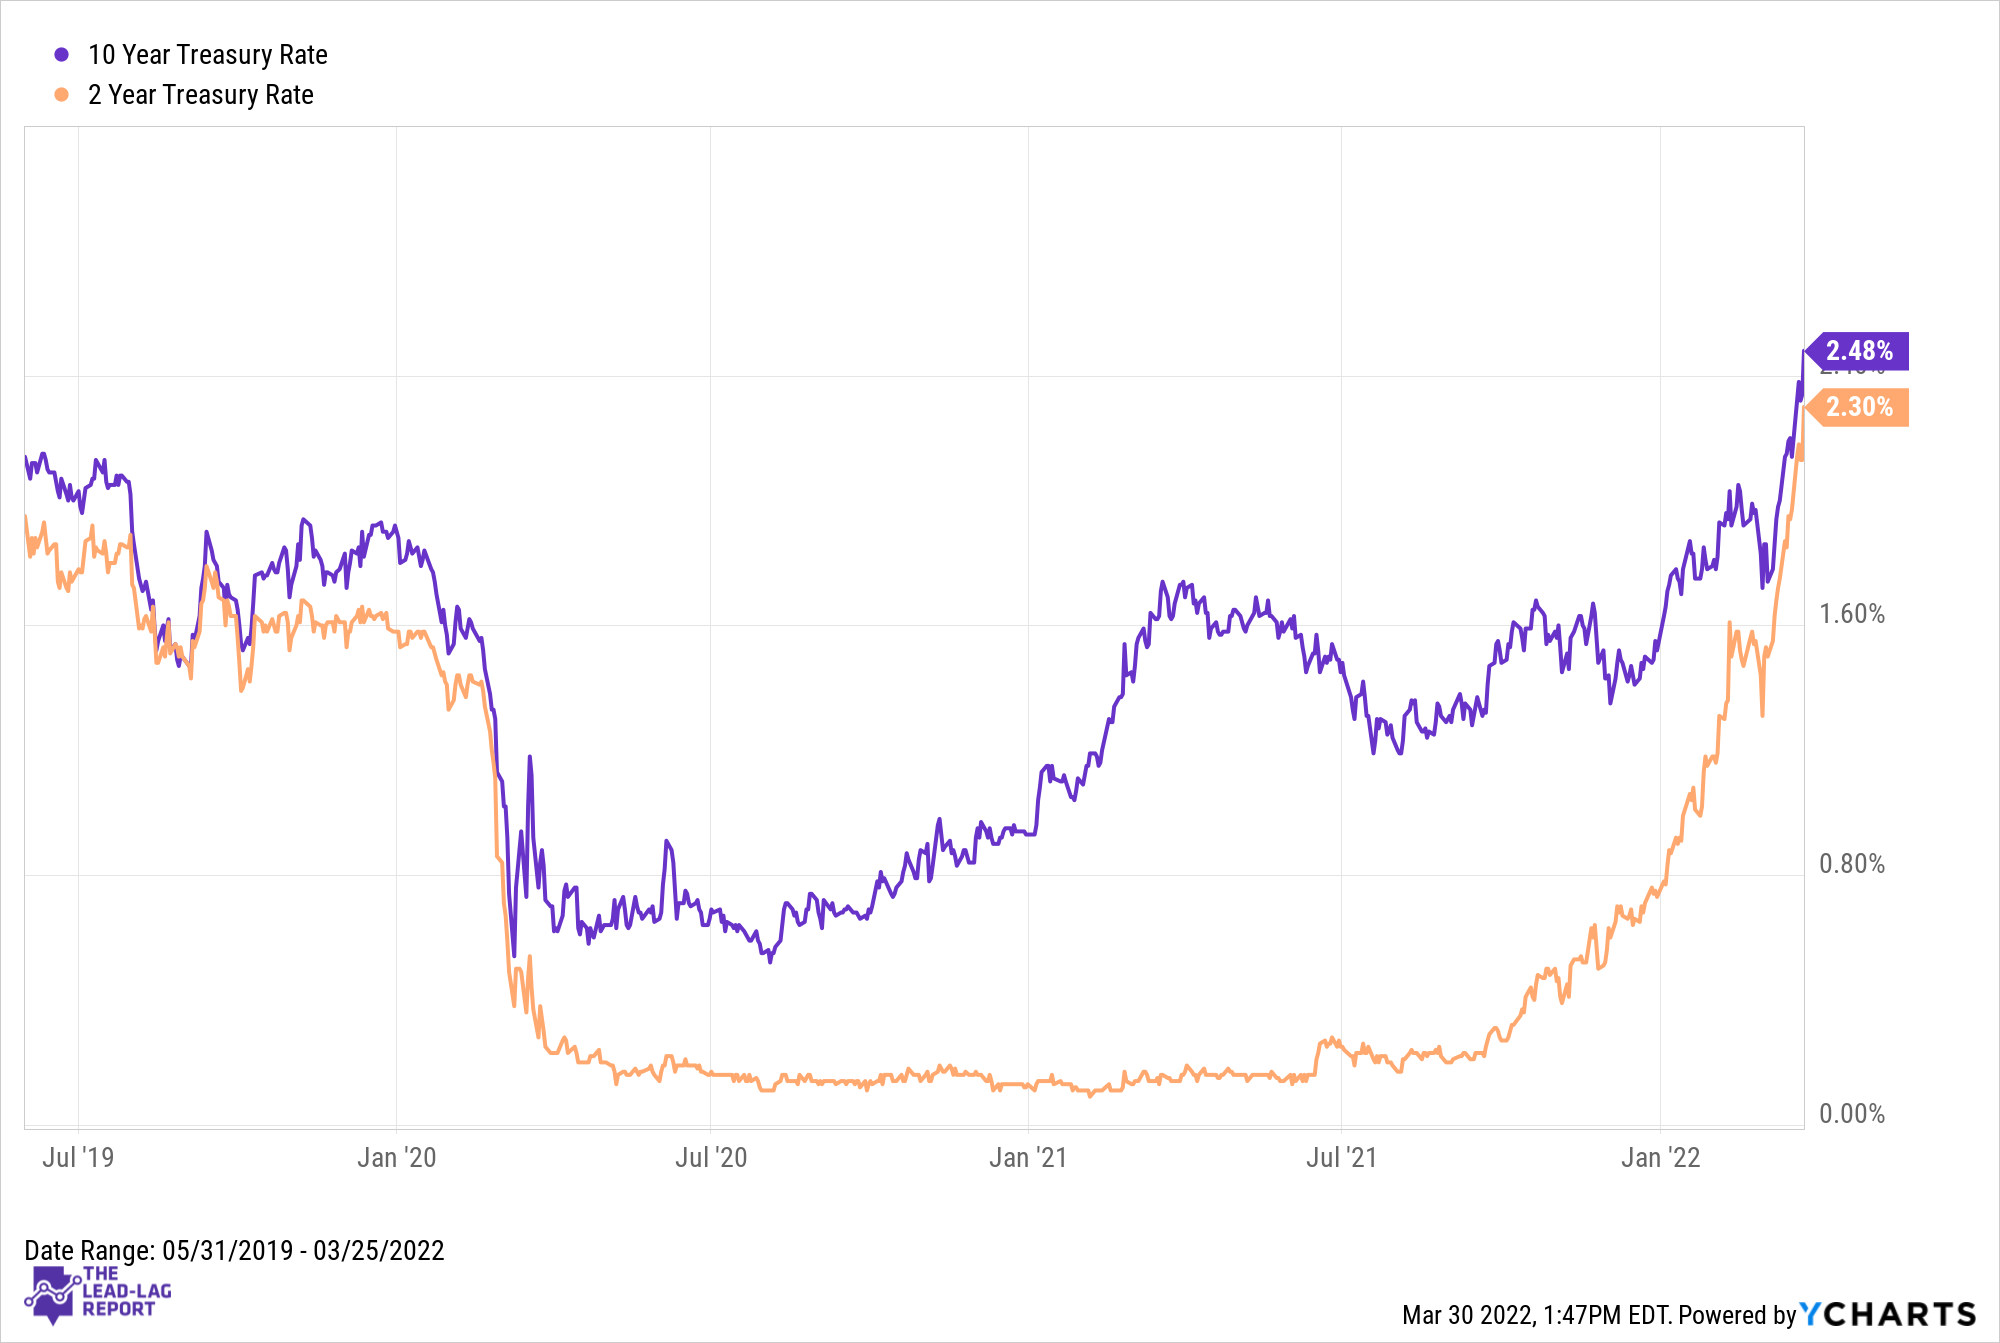
The 2-year moved higher as soon as the Fed indicated an end to loose conditions was coming. It accelerated when the central bank indicated it would happen in Q1. The markets have grown progressively more hawkish since then and the 2-year yield chart has gone parabolic.
The 10-year hasn’t moved nearly as fast. It largely remained flat until earlier this year. The Russian invasion of Ukraine almost forced it higher as food and energy inflation soared, but it clearly hasn’t been rising as fast as the short end has. The 10Y/2Y spread is positive for now, but it looks like it’s only a matter of time before it turns negative.
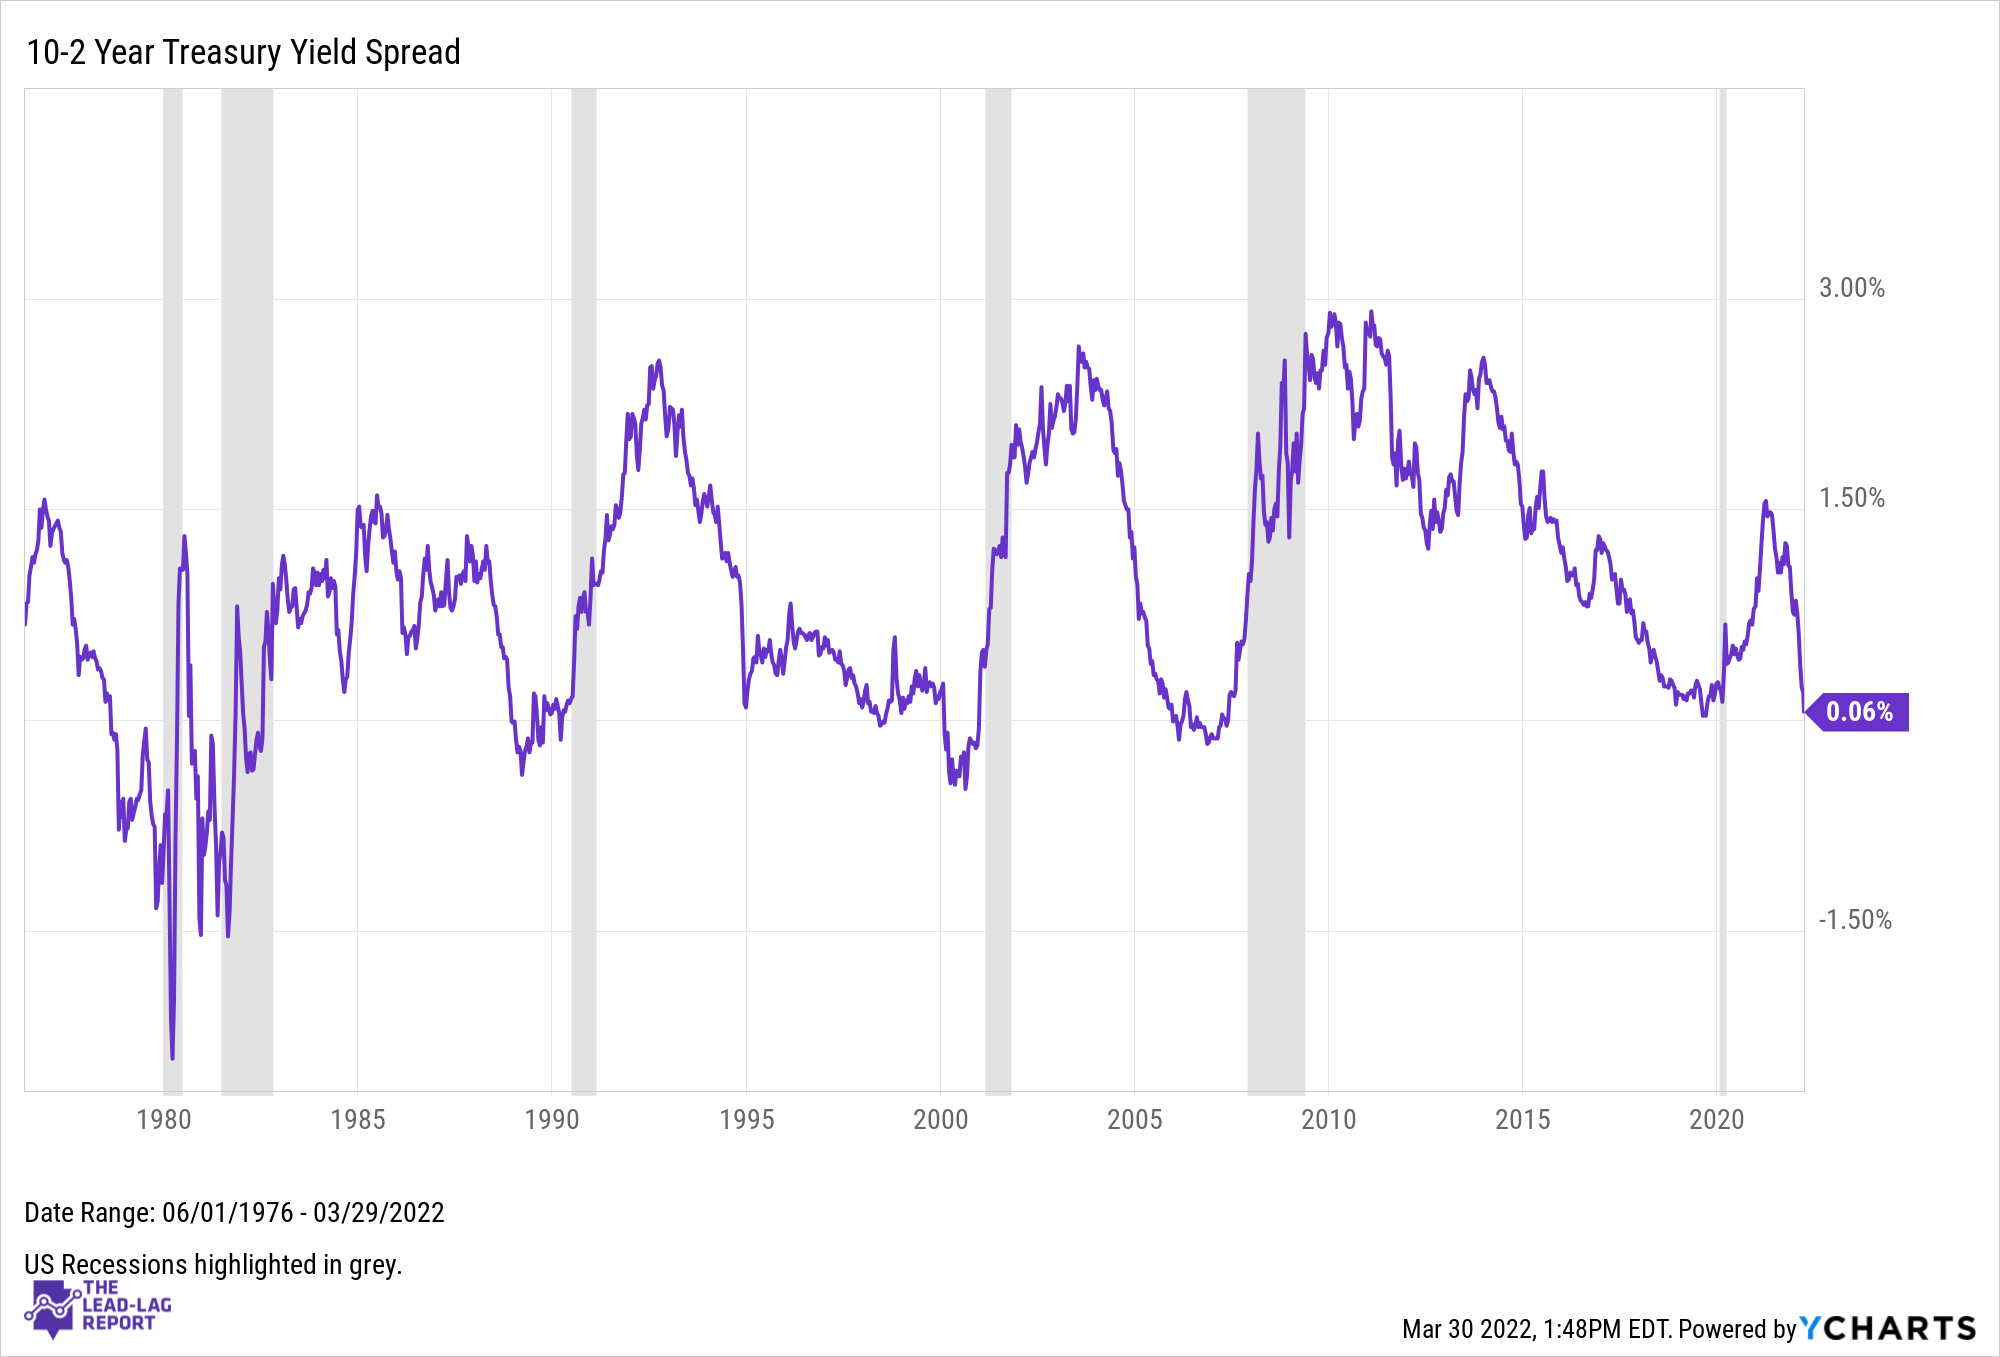
The 10Y/2Y spread is used as a recession indicator because it has led every recession going back to the 1960s when it has turned negative. Of course, this isn’t a guarantee, but the logic behind why it has worked historically is sound.
As mentioned, other parts of the yield curve have already inverted. Is that a sign of danger?
Pre-COVID, the markets paid a lot of attention to the 10Y/3M yield spread. Because the 3-month bill measures expectations in the near future, it’s more of an immediate risk signal. While the markets are talking inversion, look where this spread is at right now.
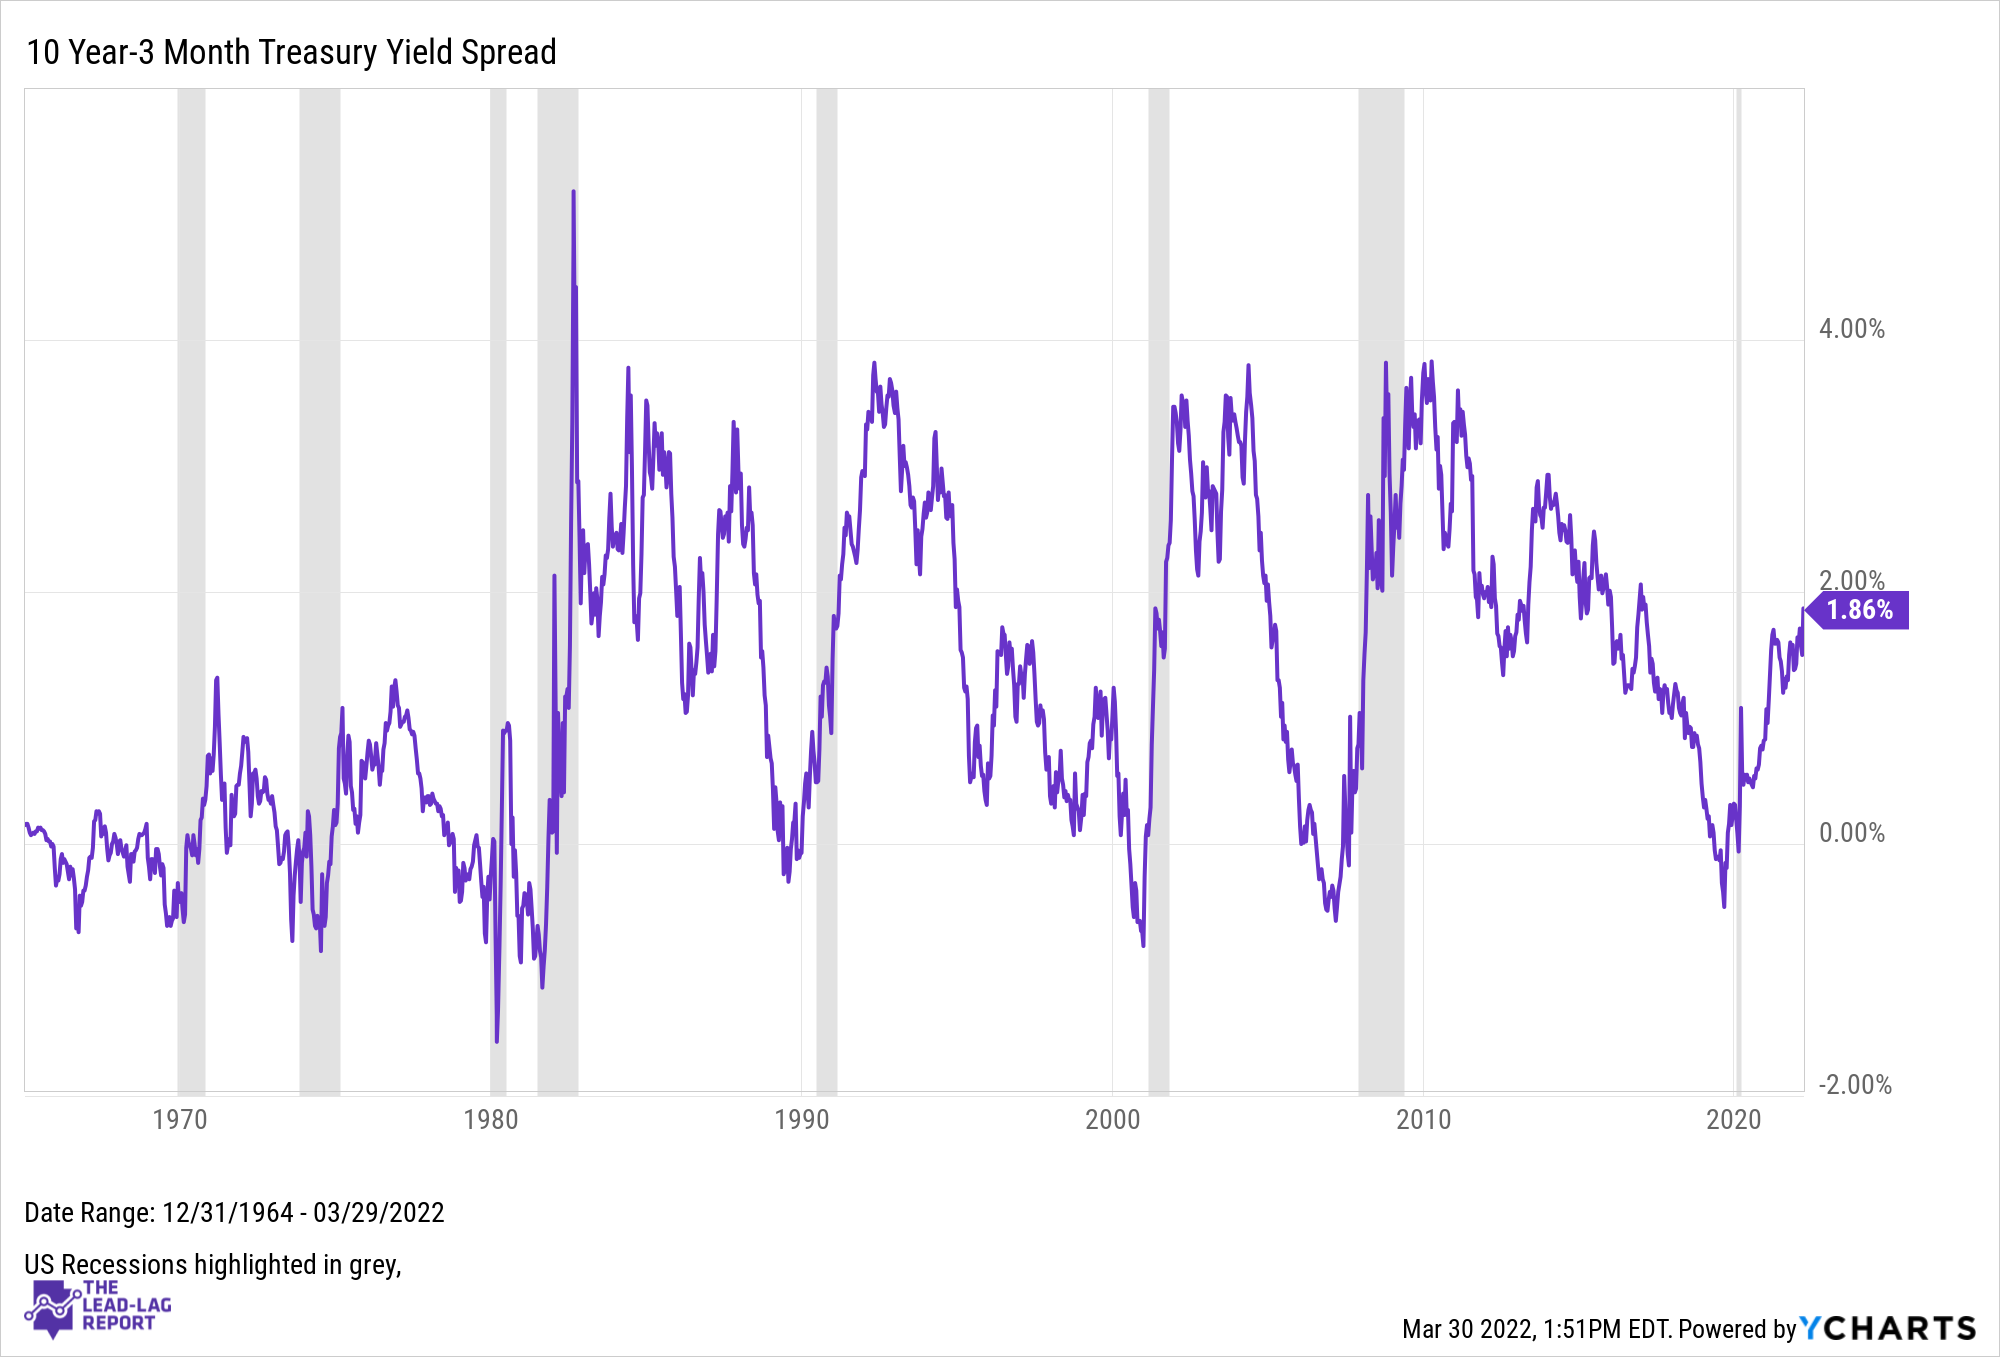
It’s actually expanding, not narrowing. The 10Y/3M spread is telling us that recession risk in the near-term is small. This makes some intuitive sense since consensus expectations still call for positive growth in 2022. While growth rates are certainly slowing, this is telling us that we’re not likely at immediate risk of recession right now.
The 10Y/3Y spread, a much closer cousin to the 10Y/2Y, just turned negative.
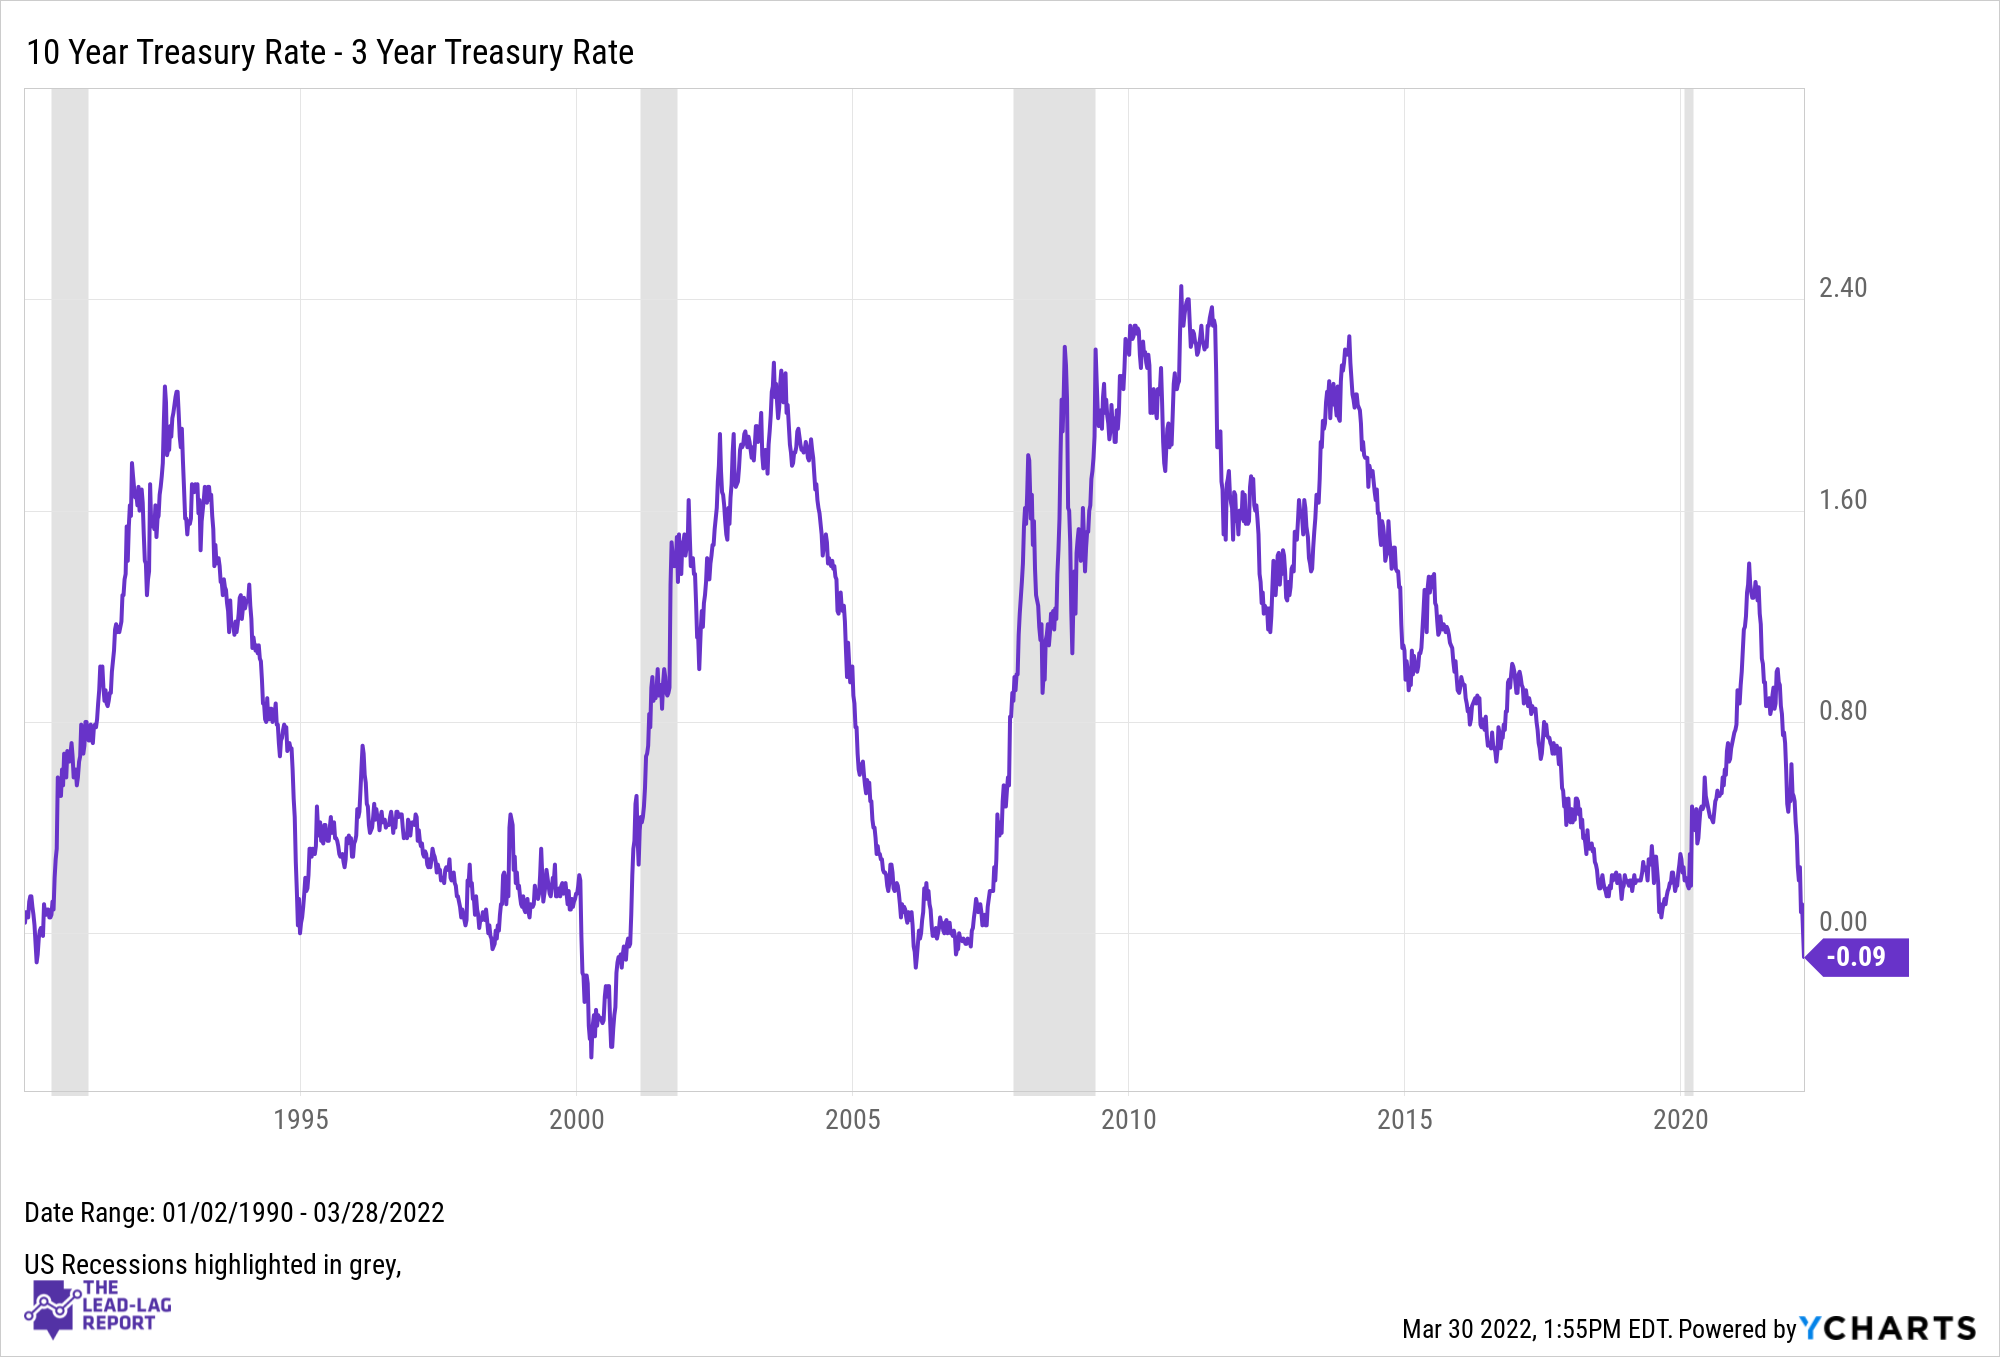
Download Visual l Modify in YCharts
This spread is noteworthy for its swift decline. It’s almost certainly a reflection of the rapid rise in inflation, which has been exacerbated by the conflict in Ukraine. The markets expect a swift and sharp rate hiking cycle followed by a pause in about 18 months (or sooner if things really go south). Like the most commonly used 10Y/2Y spread, this also has a history of preceding recessions and shouldn’t be ignored.
Conclusion: The risk of recession in 2022 seems relatively low, but bond traders think that the bigger risk will arrive in about 24-36 months. I’m skeptical that it could take that long for U.S. growth rates to turn negative and wouldn’t be at all surprised to see a recession officially start in the next 18-24 months. The Fed, inflation and the war in Ukraine are just a few of the factors that could impact this forecast quite quickly.

Featuring 5x Dow & Founders Award Winner. Risk-On/Off $RORO ETF, Junk-On/Off $JOJO ETF, & $ATACX Mutual Fund Portfolio Manager. Publisher Of The Lead-Lag Report, Michael Gayed. For more insightful articles written by Michael, please head to his newsletter, The Lead-Lag Report.
Connect With YCharts
To get in touch, contact YCharts via email at hello@ycharts.com or by phone at (866) 965-7552
Interested in adding YCharts to your technology stack? Sign up for a 7-Day Free Trial.
Disclaimer
©2021 YCharts, Inc. All Rights Reserved. YCharts, Inc. (“YCharts”) is not registered with the U.S. Securities and Exchange Commission (or with the securities regulatory authority or body of any state or any other jurisdiction) as an investment adviser, broker-dealer or in any other capacity, and does not purport to provide investment advice or make investment recommendations. This report has been generated through application of the analytical tools and data provided through ycharts.com and is intended solely to assist you or your investment or other adviser(s) in conducting investment research. You should not construe this report as an offer to buy or sell, as a solicitation of an offer to buy or sell, or as a recommendation to buy, sell, hold or trade, any security or other financial instrument. For further information regarding your use of this report, please go to: ycharts.com/about/disclosure
Next Article
Interest Rates Are Getting Weird with Ben CarlsonRead More →