Victors of Today’s Market Volatility with Beth Kindig
FEATURING I/O FUND’S, TECHNOLOGY INDUSTRY ANALYST, BETH KINDIG @Beth_Kindig, and Bradley Cipriano
Markets have been volatile in 2022 and growth stocks have had a rollercoaster year so far. Countless high-performing technology stocks have been sold indiscriminately this year. For instance, growth leaders such as CrowdStrike, Datadog, and Snowflake were all down over 20% at one point in 2022. With Q4 earnings underway, many of these high-quality growth stocks have recovered from the lows after beating and raising expectations but are still down on a year-to-date basis. Moreover, blue-chip technology companies such as Apple and Microsoft are also down in 2022, with the Nasdaq-100 down 14% so far in 2022.
However, not all technology stocks have been sold off in 2022. In fact, there are a handful of large cap technology stocks (>$10 billion market cap) that are up YTD and up over the last six months.
In the discussion that follows, we review the large cap technology stocks that have outperformed in 2022 to get an idea of what the market has been favoring. We used YCharts’ built-in screener to find technology stocks with a market cap of at least $10 billion that were up on a YTD basis. We further limited our search to companies that were also up over the last six months to avoid companies that have merely bounced off the lows.

Technology stocks: what’s working in 2022?
The following >$10 billion technology stocks are up YTD and are up over the last six months:
• Fair Isaac Corp ($FICO) Market Cap: $13B
• NortonLifeLock Inc ($NLOK) Market Cap: $16B
• Corning Inc ($GLW) Market Cap: $35B
• Concentrix Corp ($CNXC) Market Cap: $10B
• Check Point Software Technologies Ltd ($CHKP) Market Cap: $17B
• Hewlett Packard Enterprise Co ($HPE) Market Cap: $22B
• Dell Technologies Inc ($DELL) Market Cap: $45B
The above companies are in multiple industries, ranging from Software Publishers ($FICO, $NLOK); Semiconductors ($GLW); Computer and Equipment Manufacturing ($DELL, $HPE); Cybersecurity ($CHKP); and Customer Solution Services ($CNXC).
YTD Technology Outperformers
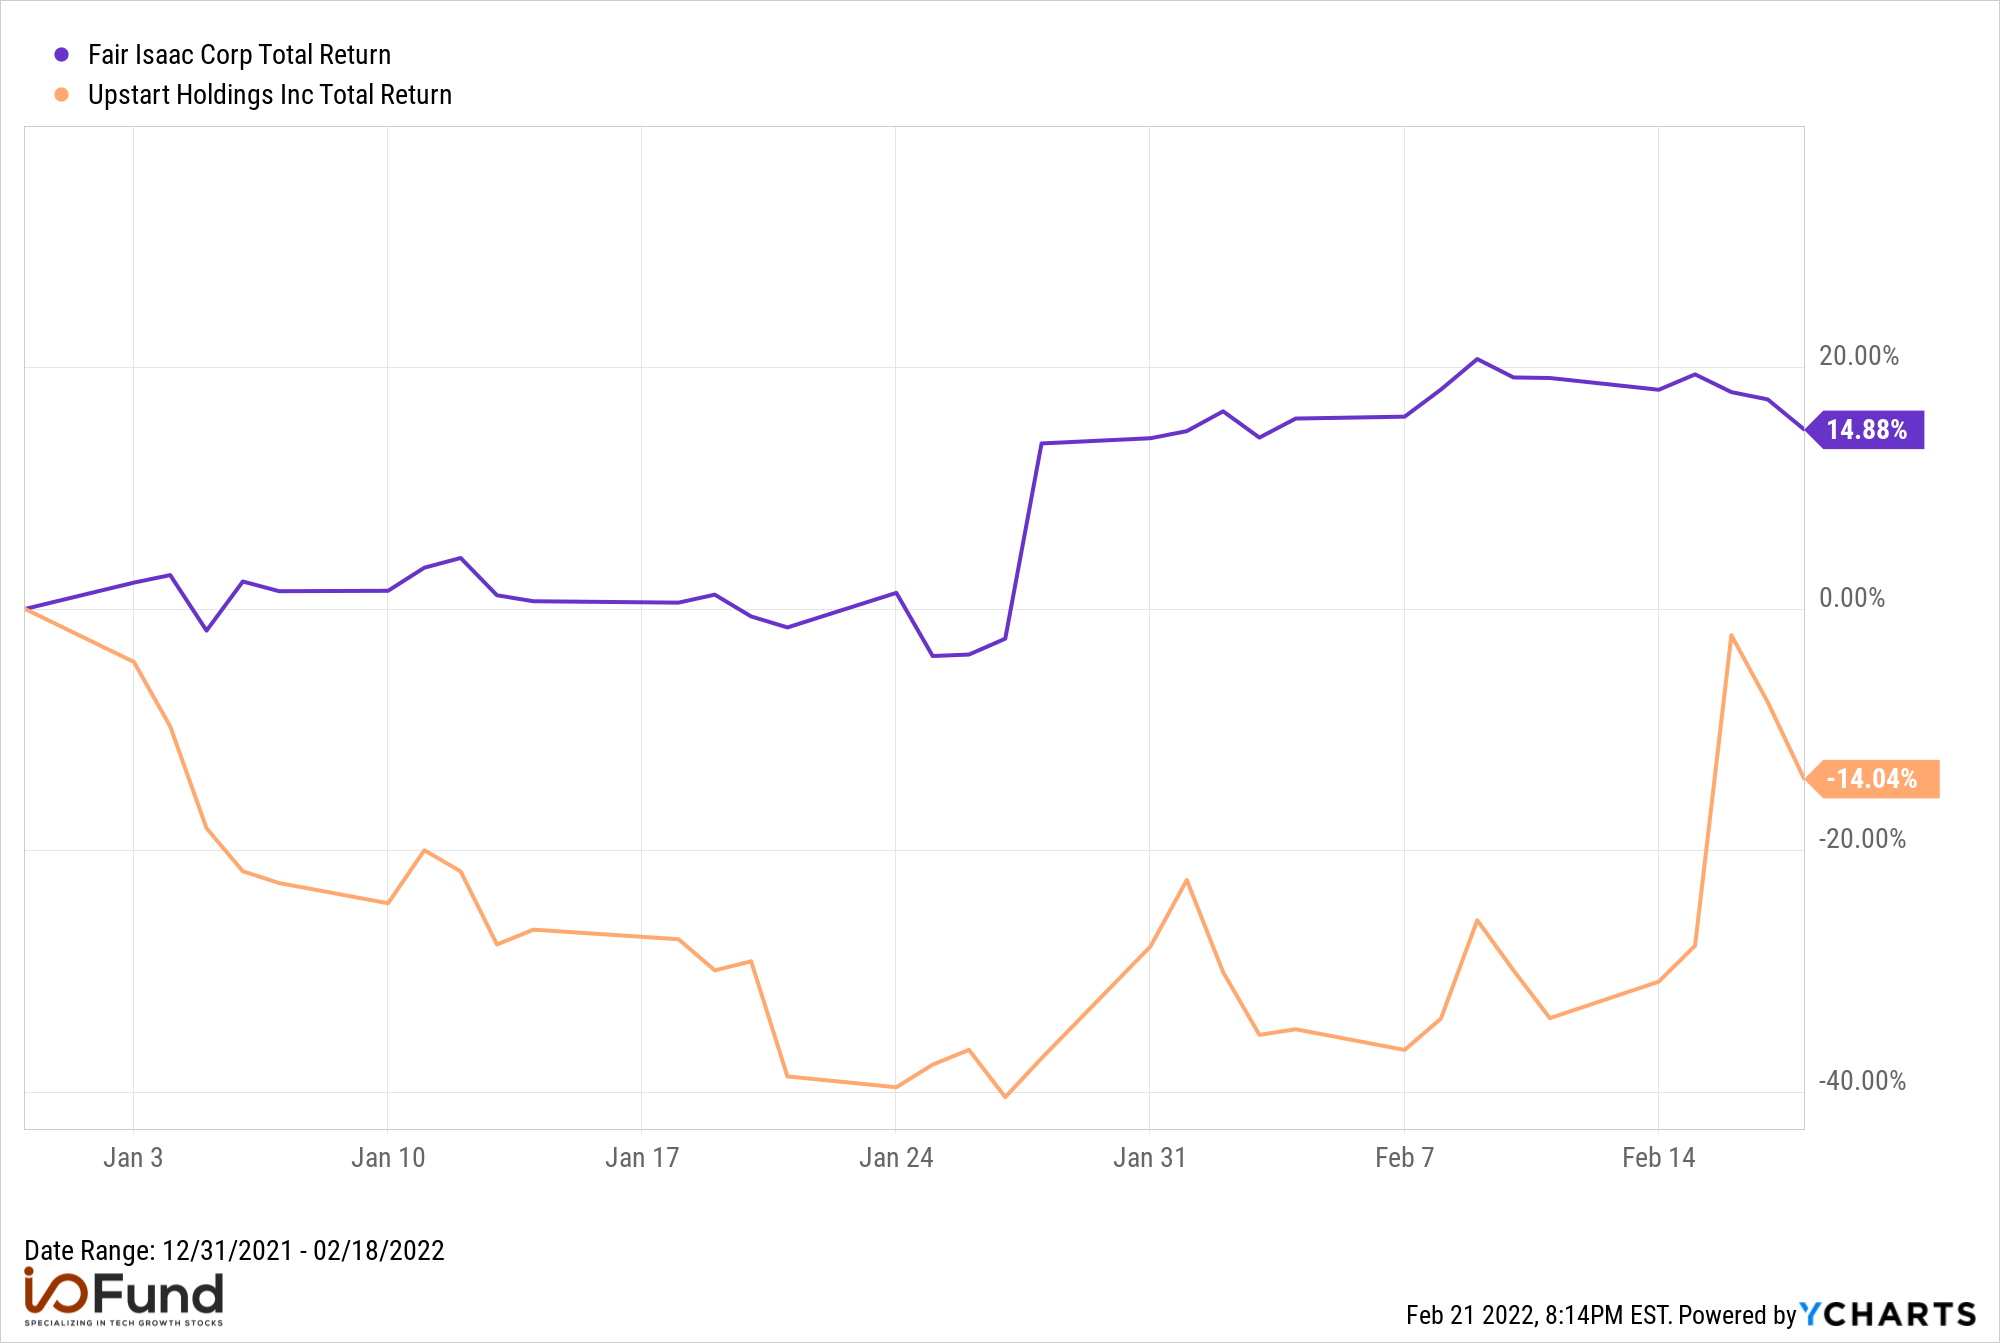
The below chart shows the YTD performance for the above-mentioned technology stocks. Fair Isaac Corp (FICO) has been the strongest large cap technology stock on a YTD basis and is up nearly15% in 2022. Relative to the Nasdaq-100, FICO has outperformed by nearly 30% on a year to date basis.
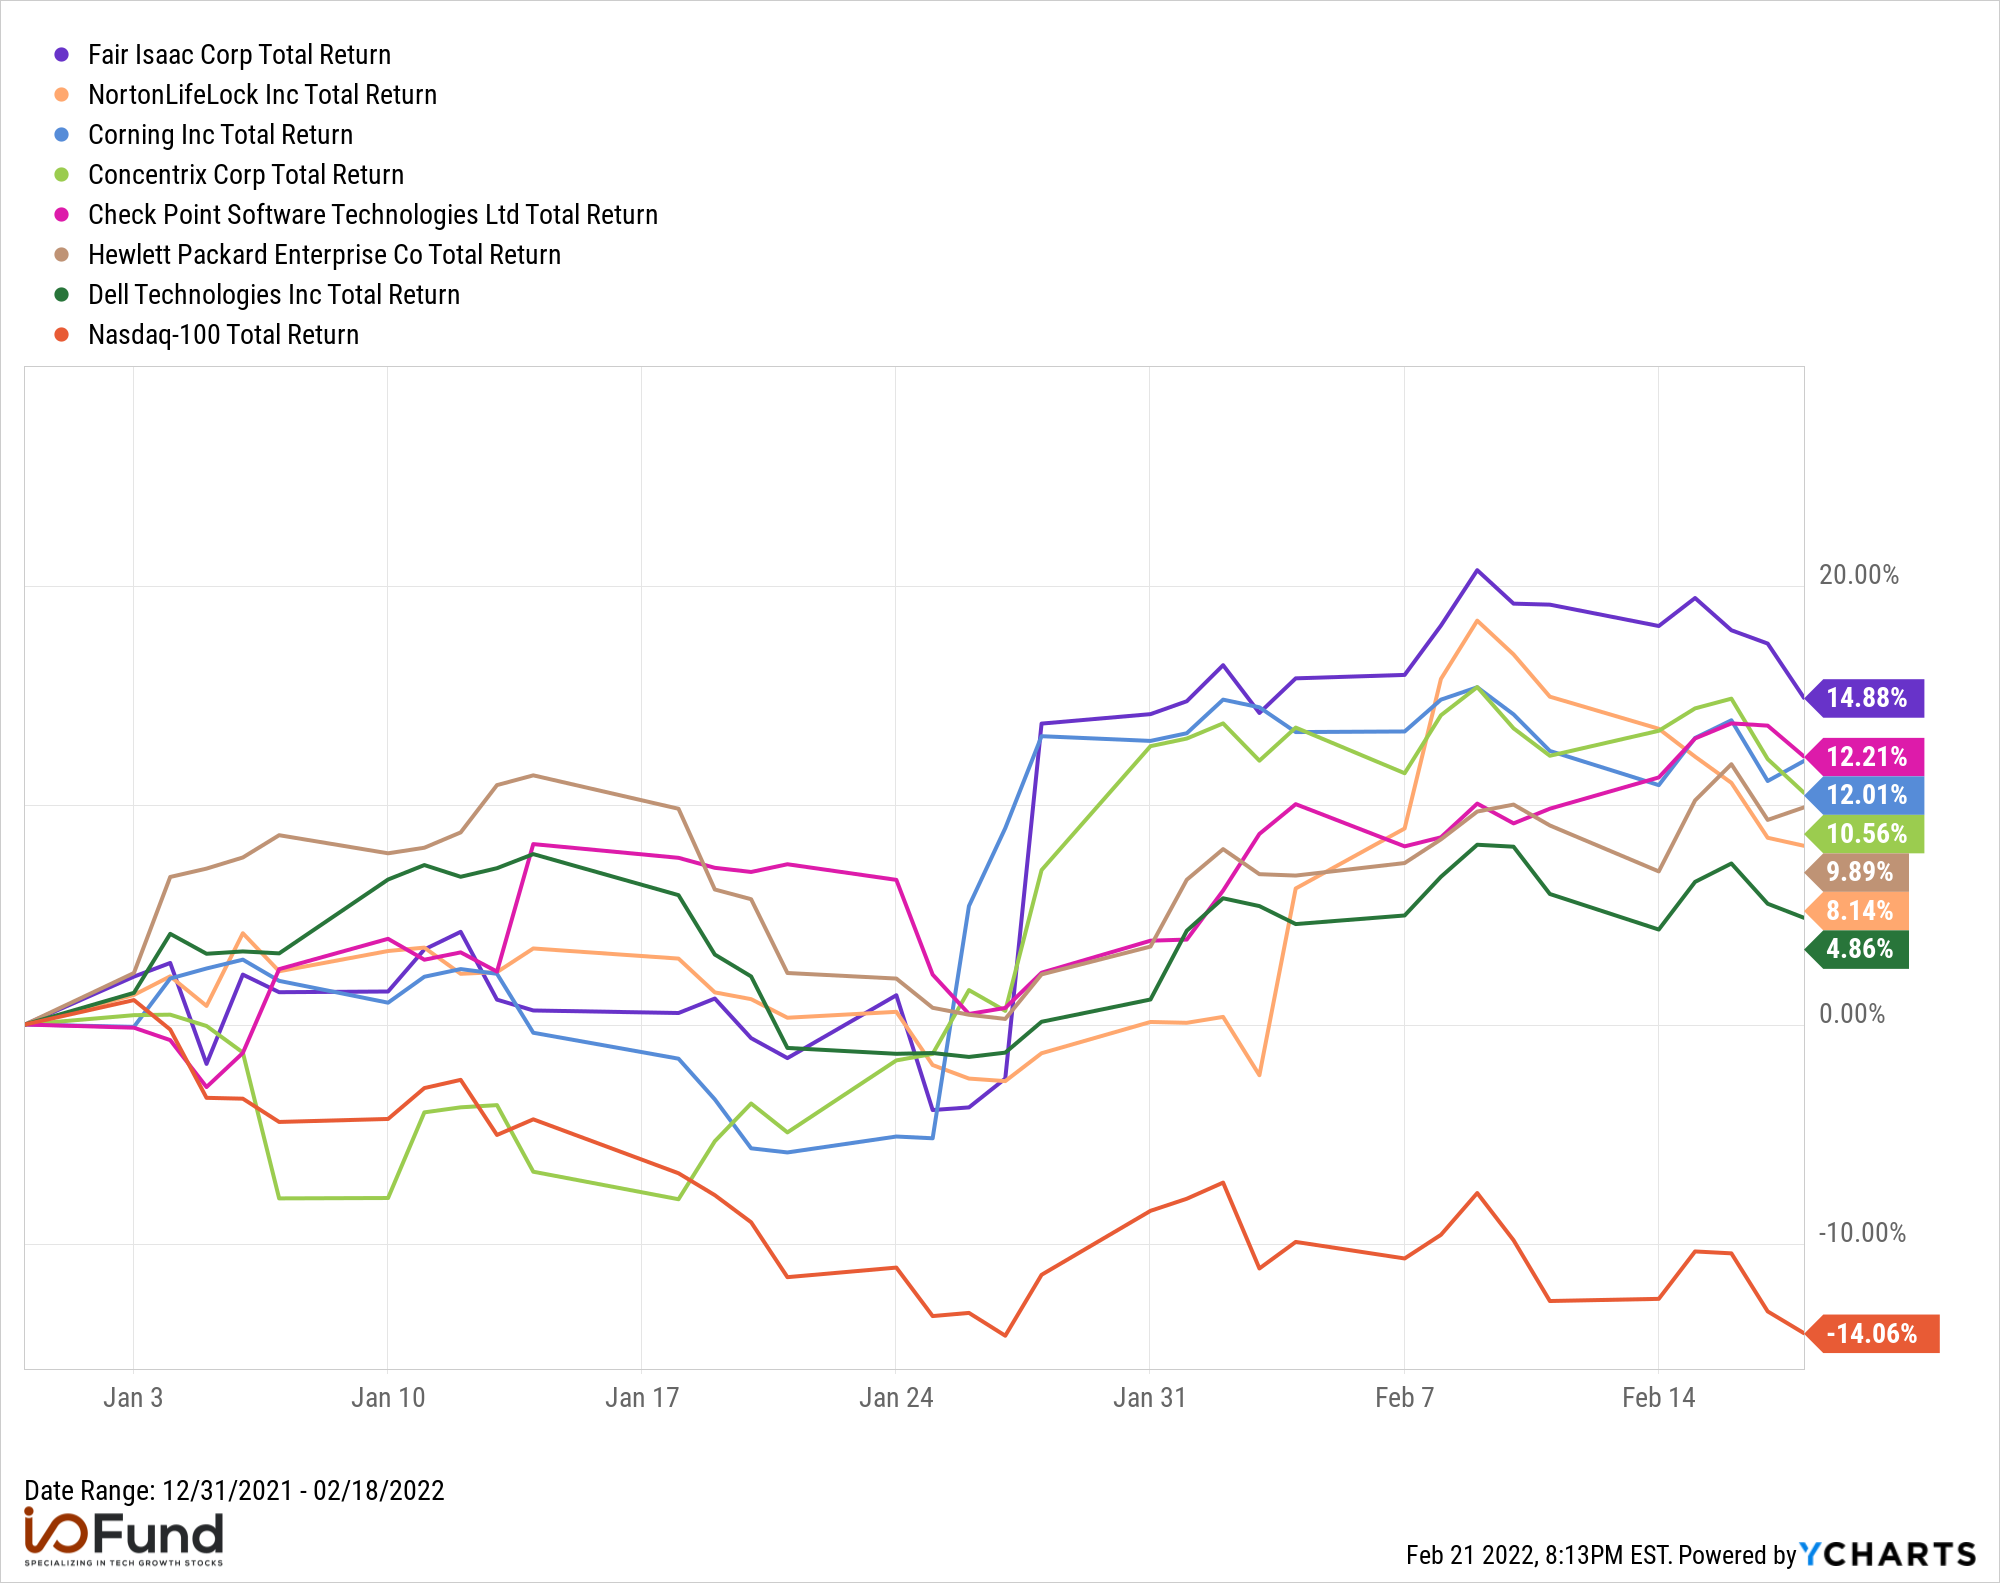
FICO is well known for its predictive credit score, and it is notable that the company has outperformed YTD as there have been new high-profile contenders, such as Upstart ($UPST), which claims to have developed a more efficient model for pricing credit risk. The market may not be convinced that FICO’s legacy approach will be disrupted.
Download Visual | Modify in YCharts
Last six months technology outperformers
Looking over a longer time horizon, Concentrix (CNXC) has been one of the strongest large cap technology companies and is up 10% YTD and also up nearly 20% over the last six months. Concentrix is a recent spin-off from SYNNEX, and the company explains in its 10K that it is a” leading global provider of technology-infused Customer Experience solutions”. Concentrix’s sales grew 18% YoY to $6 billion in 2021, while adjusted EPS increased much faster at over 65% YoY. As we’ll discuss in more detail below, the market appears to be awarding companies with strong earnings.
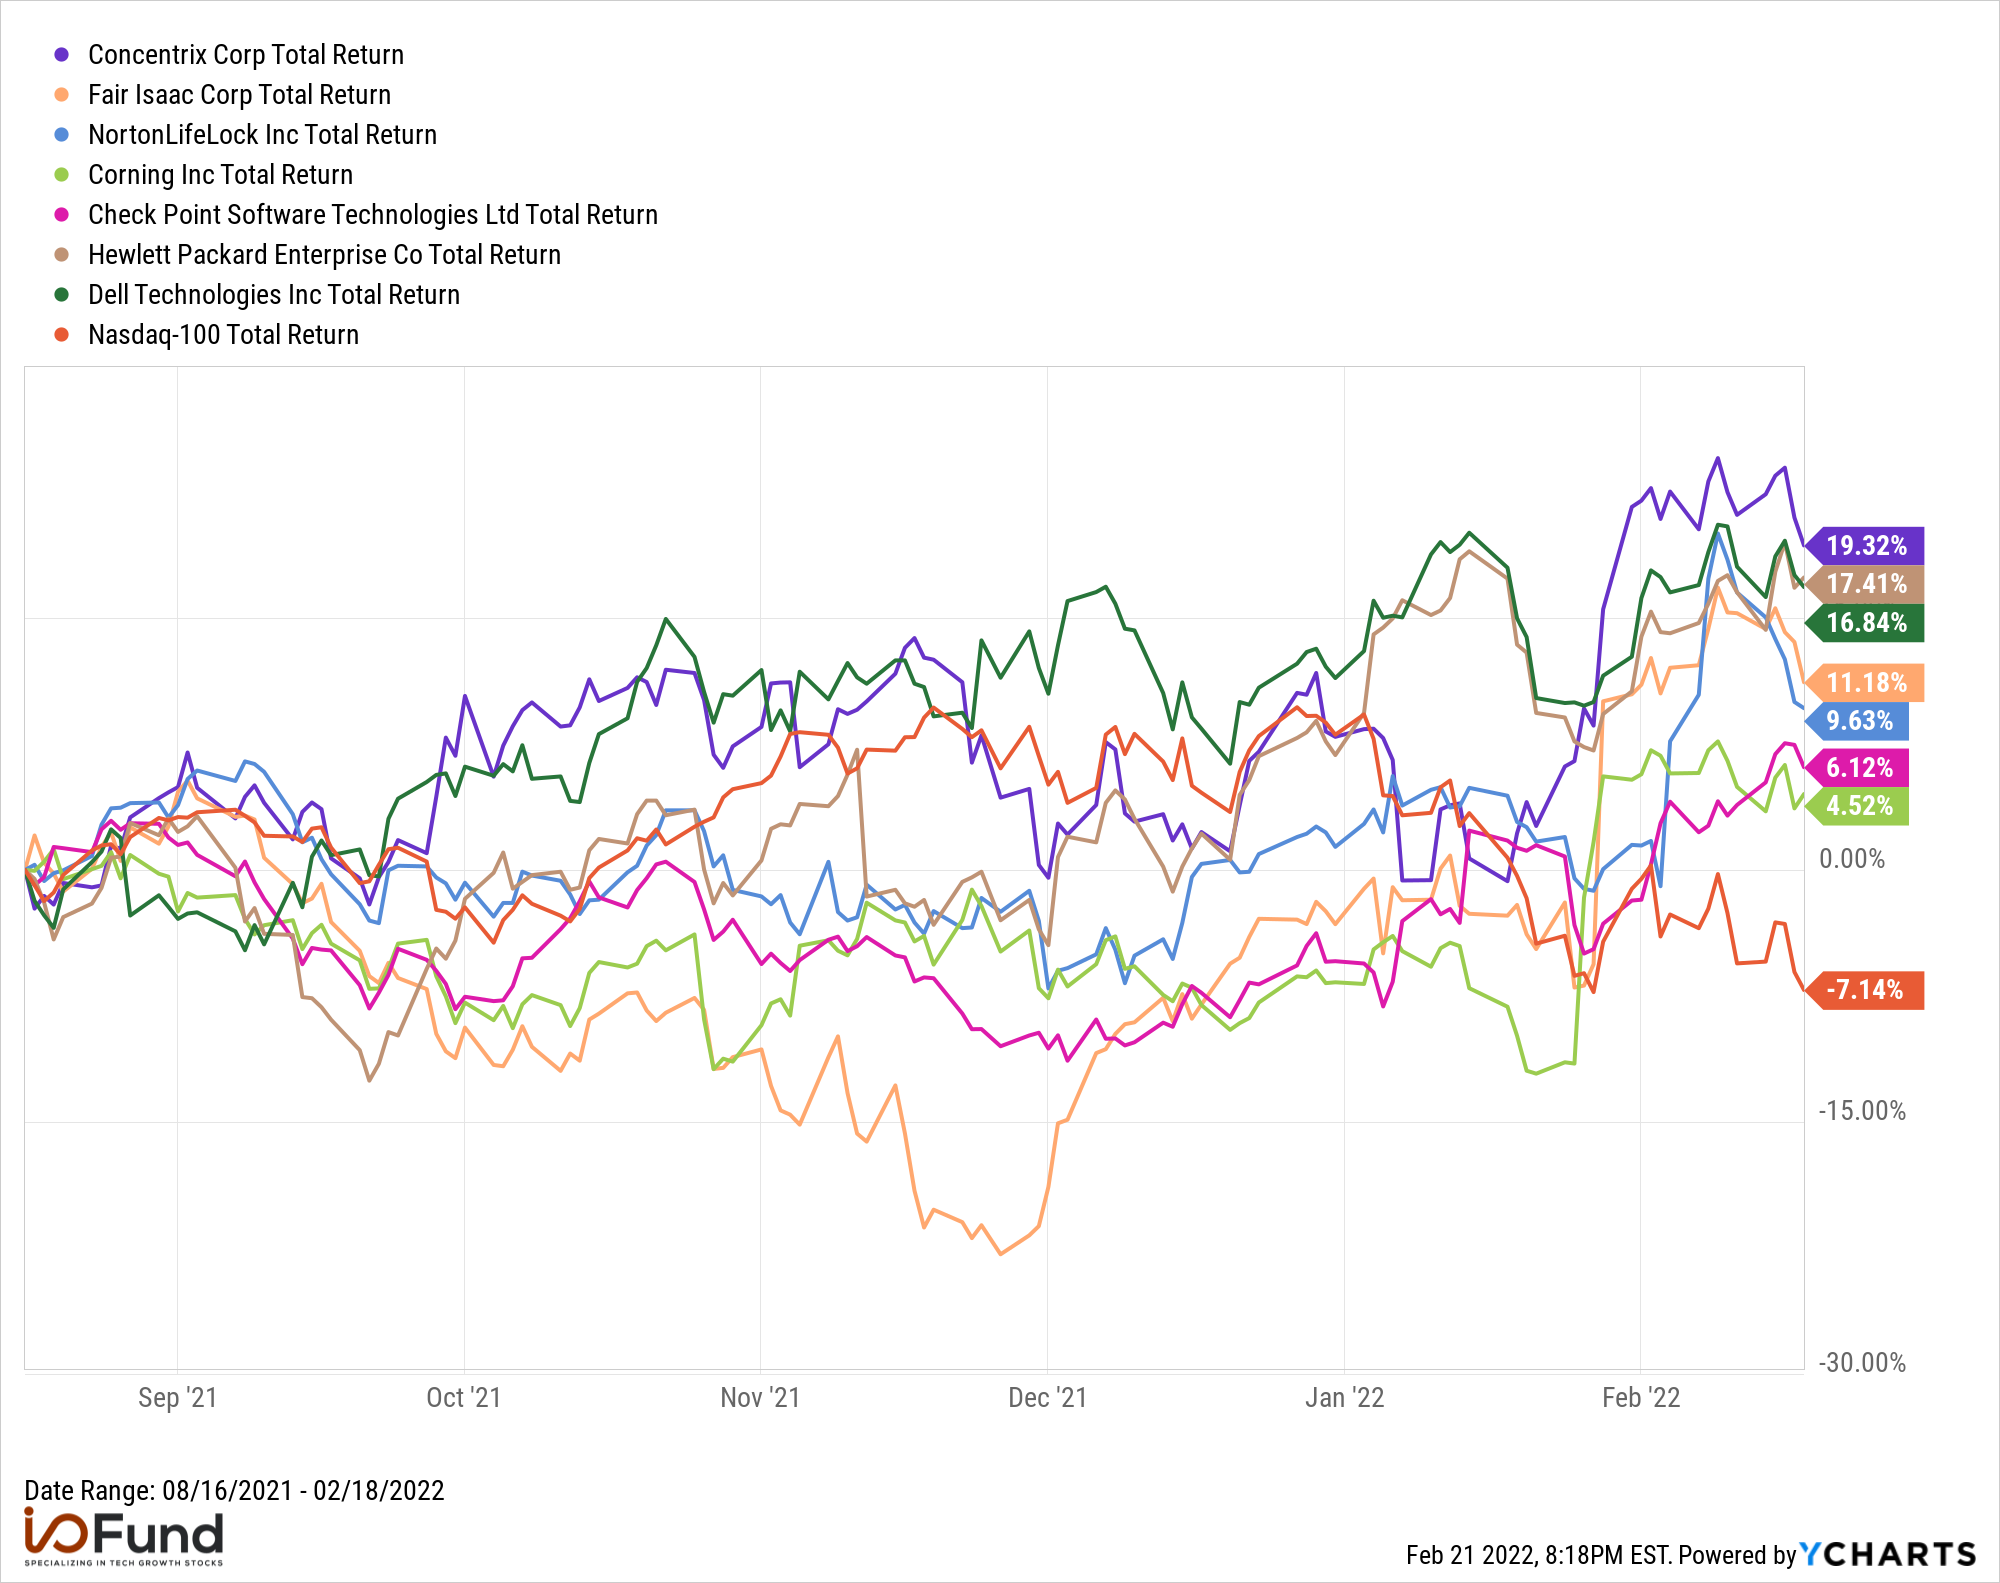
Likely a driver of Concentrix’s YTD returns has been rising growth expectations for earnings. The consensus estimate for Concentrix’s EPS growth has risen recently and is up 5% over the last 90 days . An increase in earnings estimates suggests that Concentrix has been outperforming and that its outlook has improved, which supports a higher valuation.
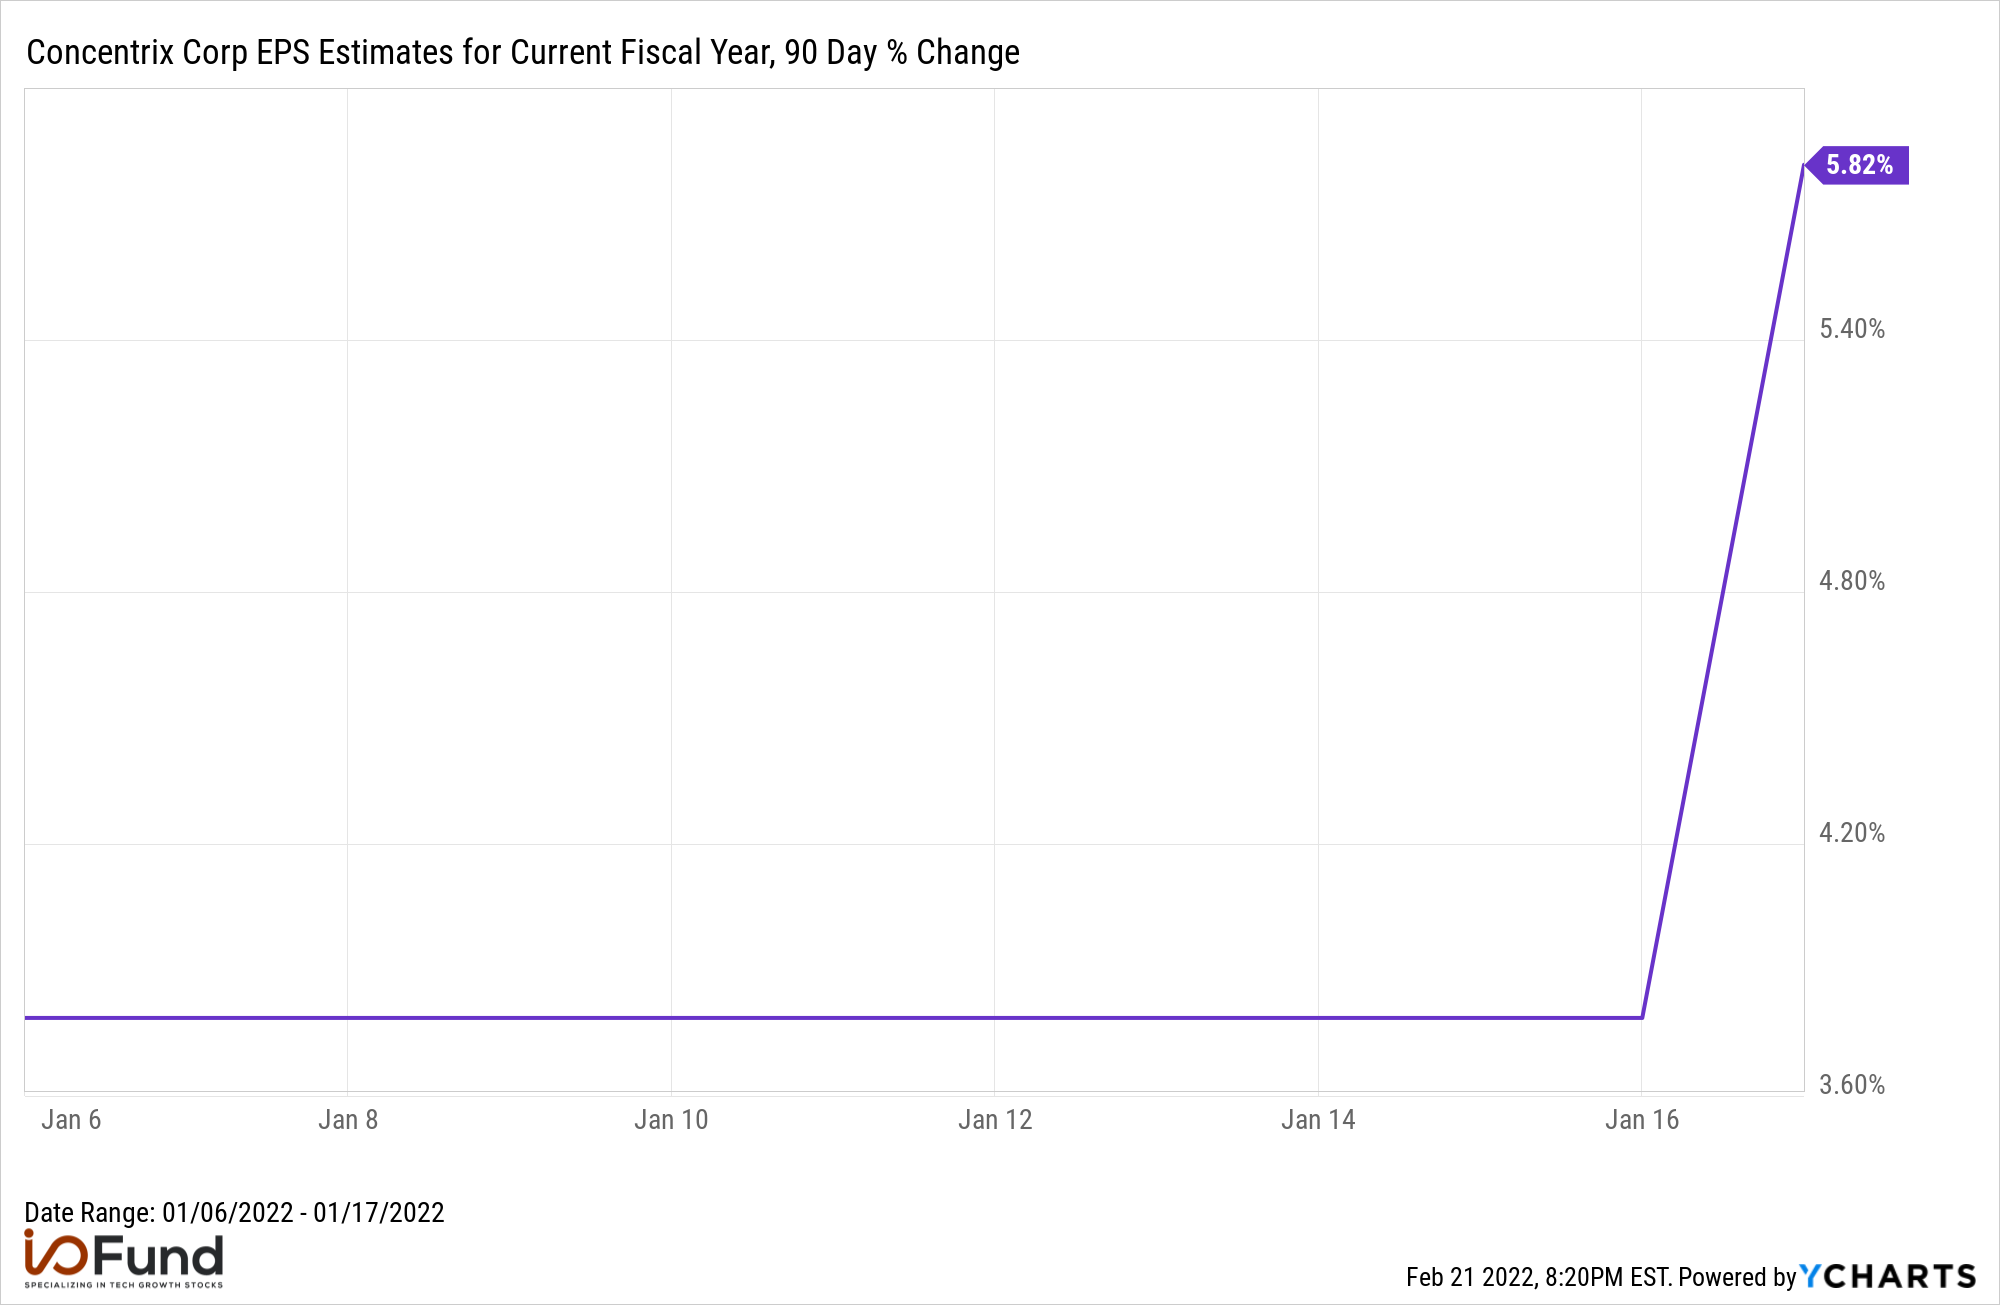
Download Visual l Modify in YCharts
Multiples
It is also notable that the outperforming large cap technology stocks discussed above have relatively low 1 year forward price-to-earnings multiples. As shown below, the highest PE multiple of the group is FICO at 28x, with the median multiple at 15x.This compares to a weighted forward PE multiple of ~30x for the Nasdaq-100, highlighting the market’s preference for value.
It is also noteworthy that multiples have remained relatively static over the last six months for the above listed tech stocks. This highlights that returns have been driven by earnings growth rather than higher valuations, suggesting that there may be further upside to returns if multiples expand.
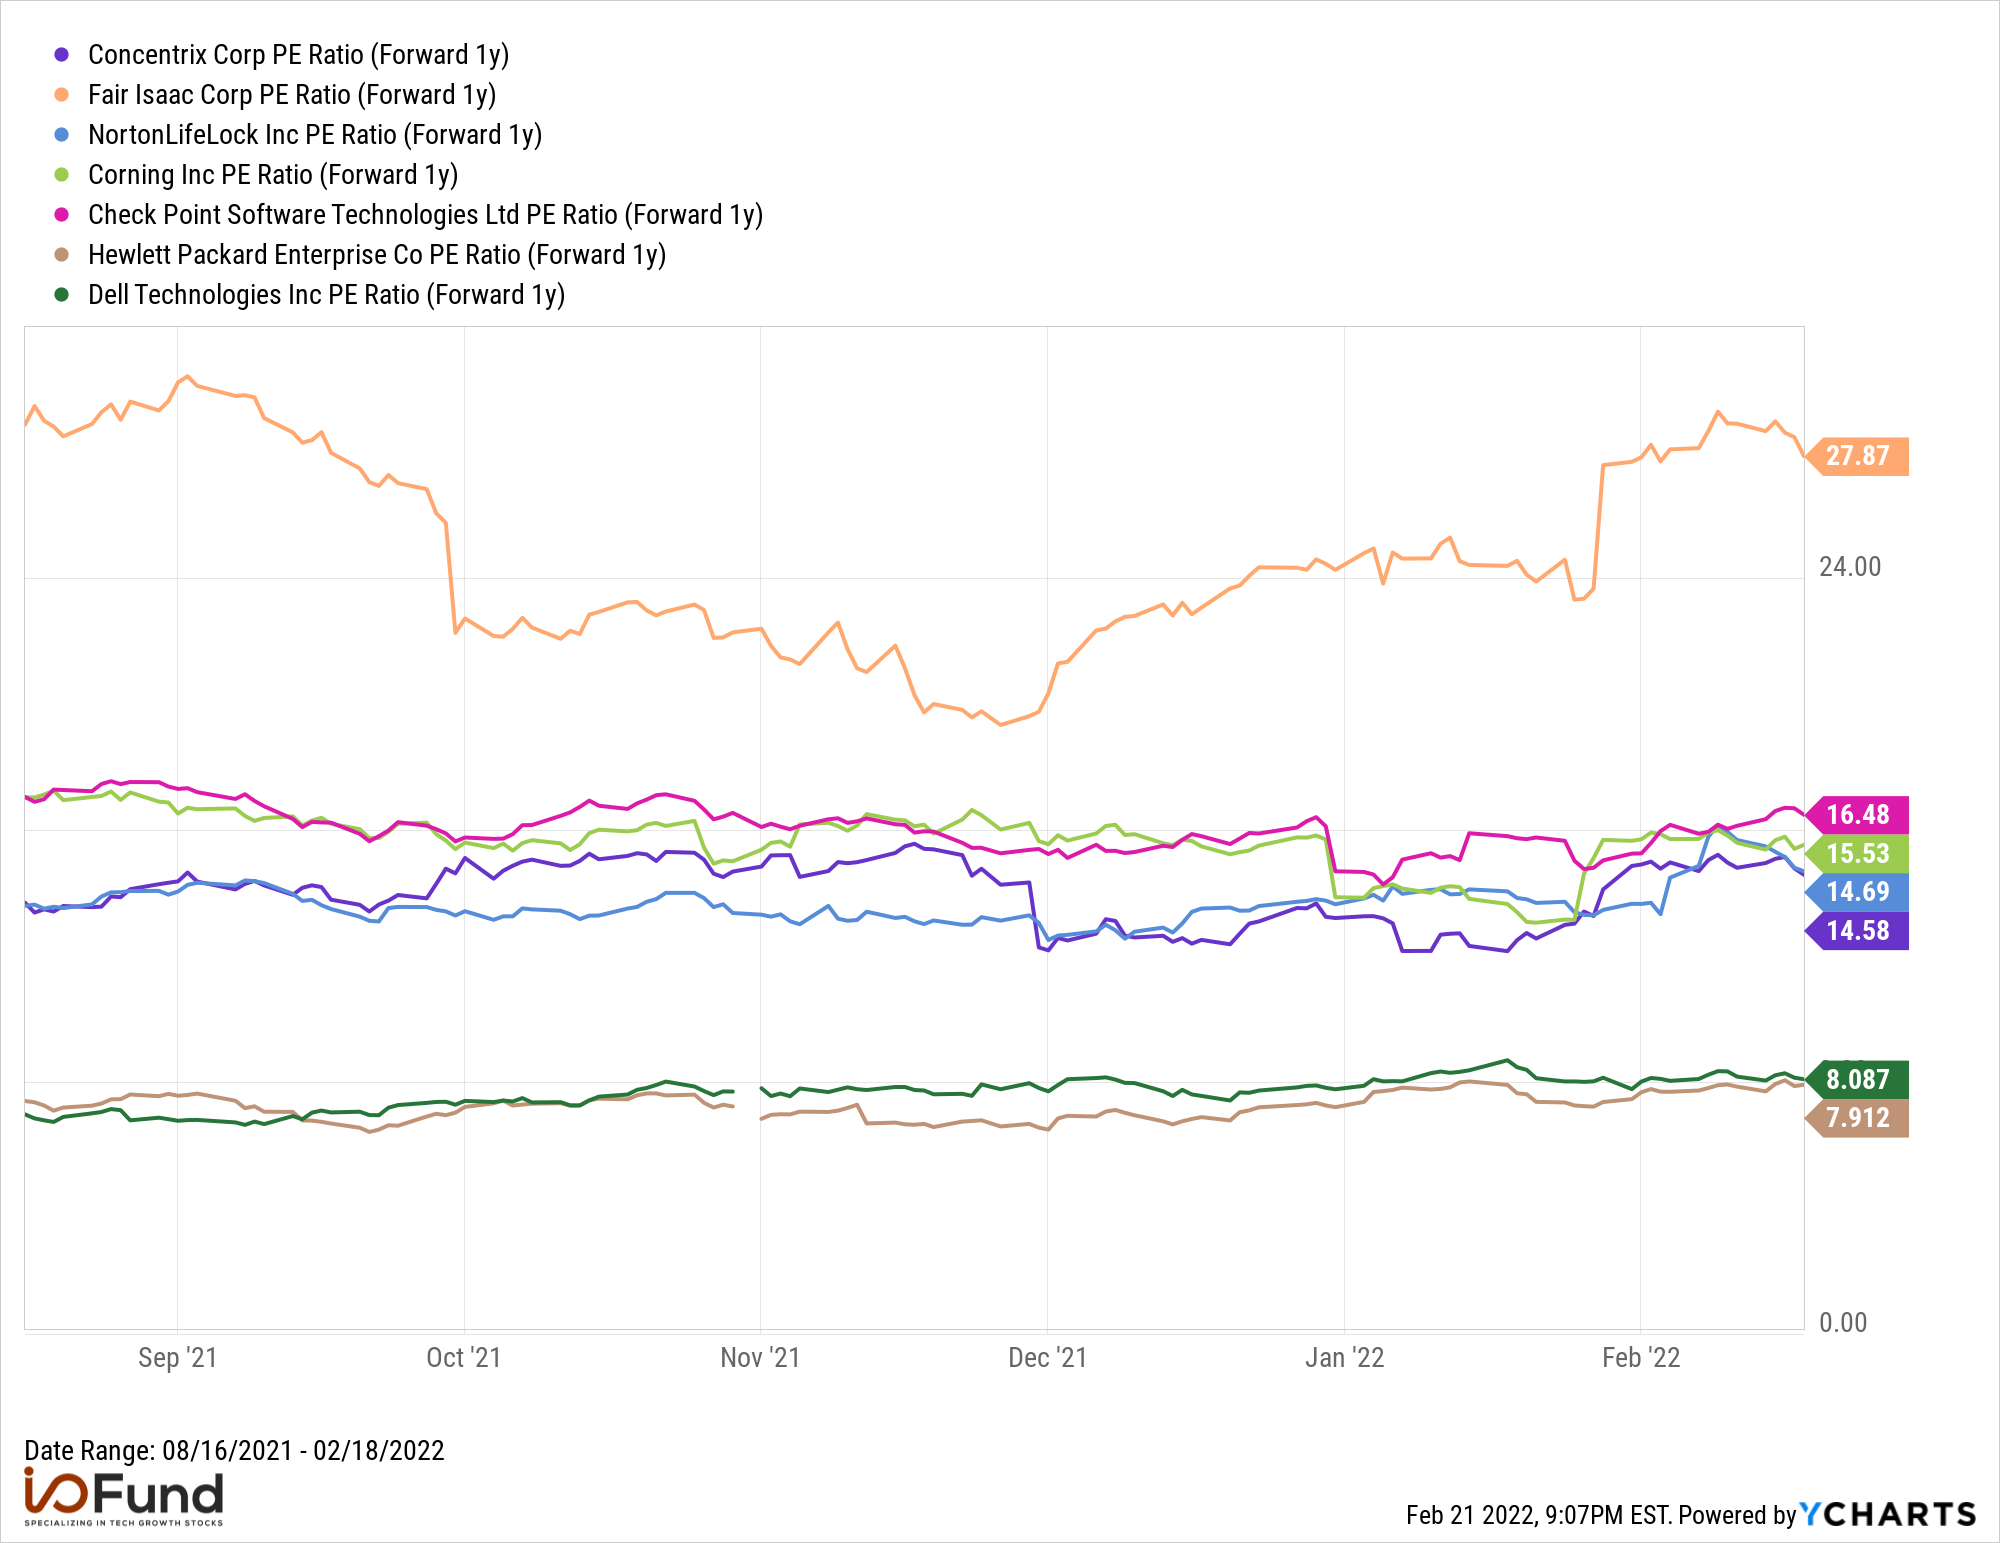
Download Visual l Modify in YCharts
The below graph further highlights the market’s preference for ‘value’, as none of the outperforming large cap technology stocks have a price-to-sales multiple above 10x (on a 1-year forward basis), with a median multiple of 5x. This is below the Nasdaq-100’s weighted forward PS multiple of ~9x. This trend further highlights the market’s preference for cheap stocks.
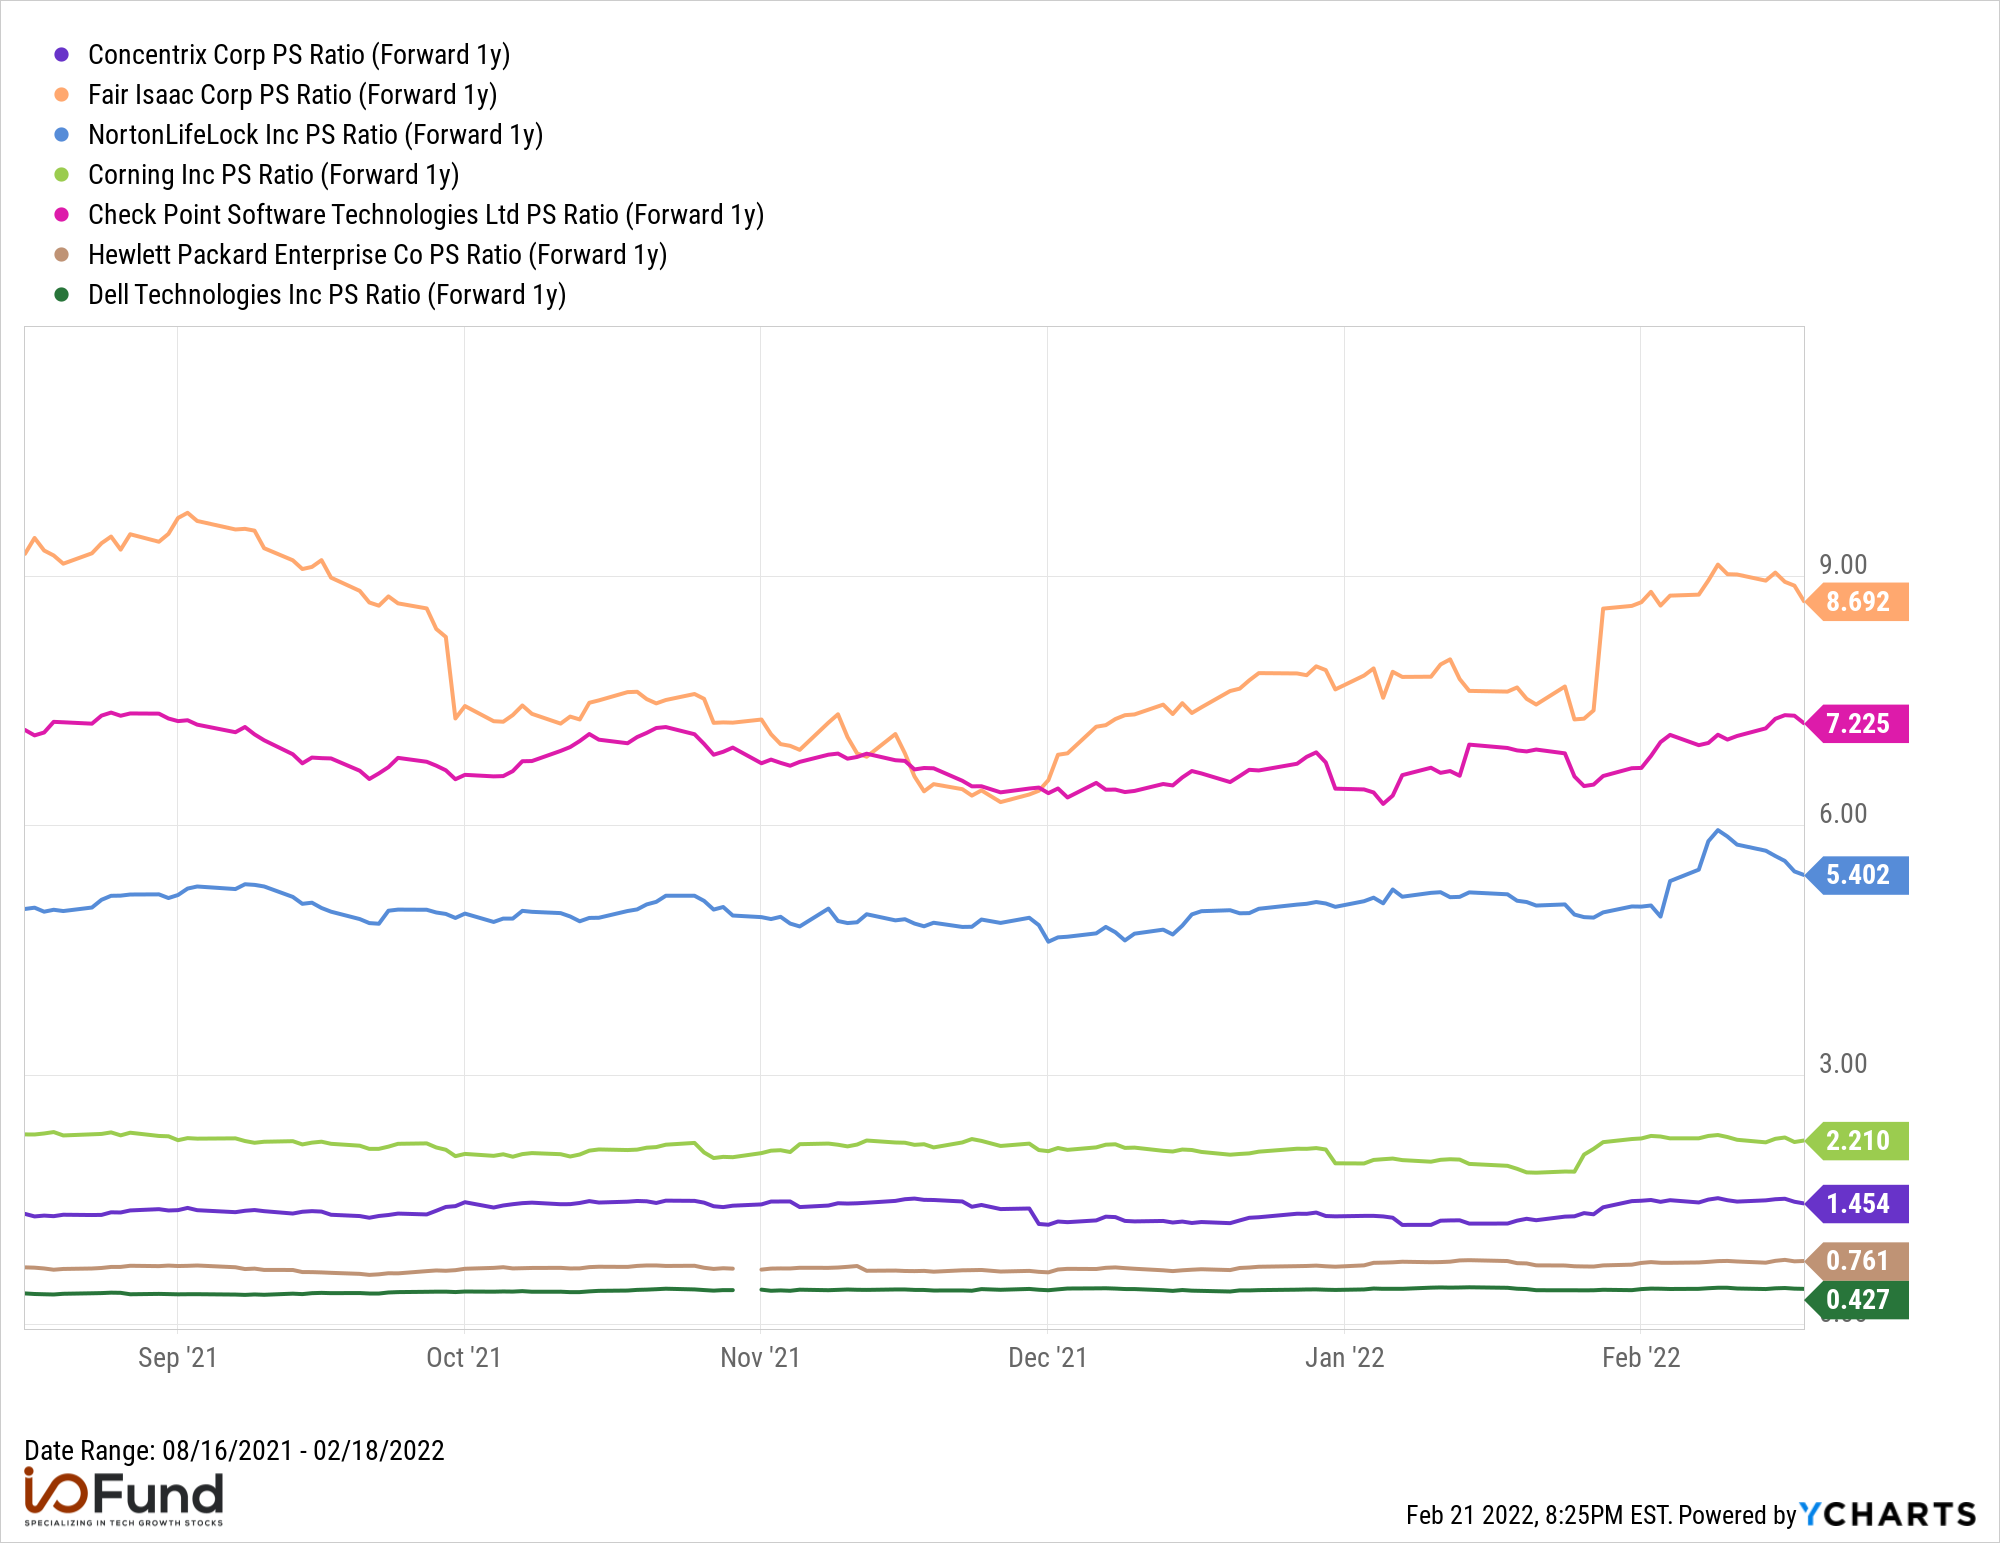
Download Visual l Modify in YCharts
Takeaway
In 2022, the market has sold-off tech stocks, and the Nasdaq-100 is down 14% YTD. However, there have been a handful of outperforming technology stocks in 2022 in industries ranging from software, customer services, and equipment manufacturers. So far, the market has favored companies with consistent earnings and relatively cheap multiples, as growth remains out of favor. However, tech is often a “winner takes most” market, so the companies that continue to outgrow their competition will likely outperform in the long run, regardless of near term volatility.

Beth Kindig (@Beth_Kindig) has ten years of experience in competitive analysis and product analysis in the tech industry dating back to 2011. Considering tech growth stocks took off after the financial crisis, she is an experienced professional in every sense of the word.
Disclosure: Beth Kindig and the I/O Fund may own shares in any of the discussed companies and do not have plans to change their respective positions within the next 72 hours. The above article expresses the opinions of the author, and the author did not receive compensation from any of the discussed companies.
Connect With YCharts
To get in touch, contact YCharts via email at hello@ycharts.com or by phone at (866) 965-7552
Interested in adding YCharts to your technology stack? Sign up for a 7-Day Free Trial.
Disclaimer
©2021 YCharts, Inc. All Rights Reserved. YCharts, Inc. (“YCharts”) is not registered with the U.S. Securities and Exchange Commission (or with the securities regulatory authority or body of any state or any other jurisdiction) as an investment adviser, broker-dealer or in any other capacity, and does not purport to provide investment advice or make investment recommendations. This report has been generated through application of the analytical tools and data provided through ycharts.com and is intended solely to assist you or your investment or other adviser(s) in conducting investment research. You should not construe this report as an offer to buy or sell, as a solicitation of an offer to buy or sell, or as a recommendation to buy, sell, hold or trade, any security or other financial instrument. For further information regarding your use of this report, please go to: ycharts.com/about/disclosure
Next Article
Hedging Geopolitical Risk & the GPR Index with ETFsRead More →