US Existing Home Sales Monthly Update
The U.S. Existing Home Sales Report is a critical monthly economic indicator that tracks the number of previously constructed homes that were sold during the reporting month.
Released by the National Association of Realtors (NAR), this report provides valuable insights into the housing market’s performance and overall economic health. It reflects consumer demand for housing, trends in mortgage rates, and broader economic conditions. Analysts, investors, and policymakers closely monitor this data as it helps gauge market stability, consumer confidence, and potential impacts on related industries such as construction, finance, and retail.
Latest Data Release
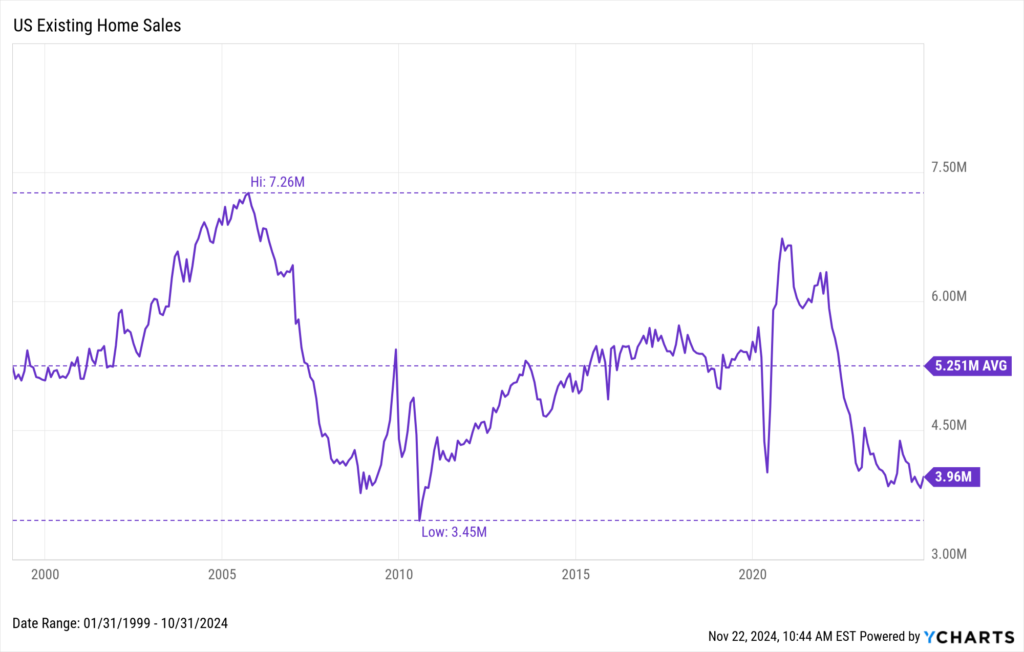
NAR released its latest monthly U.S. Existing Home Sales data on November 21st, 2024. The number of U.S. existing homes sold is at a current level of 3.96M, up from 3.83M last month and up from 3.85M one year ago. The following chart shows the trend of sales of existing homes over time.
Download Visual | Modify in YCharts
Analysis and Insights
Despite rising to 3.96 million, US existing home sales are well below the long-term monthly average of 5.25 million homes sold since 1999 and continue to sit around all-time lows. Following years of steady growth since reaching an all-time low of 3.45 million in July 2010, existing home sales have experienced volatile activity since plummeting in early 2020. After a rapid V-shaped recovery in the summer of 2020, rising interest rates have sent existing home sales tumbling since 2022.
Historical U.S. Existing Home Sales data on YCharts dates back to 1999. Users can create interactive charts to visualize trends and correlate them with other economic indicators. By examining this data, users can identify patterns, such as periods of sustained growth or contraction, and correlate them with broader economic events.
Access U.S. Existing Home Sales data on YCharts by following these simple steps:
- Log on to YCharts.com.
- From anywhere on the platform, type any of the following keywords: “US Existing Home Sales” into the search bar and click on the result.
- Once on the indicator page, users can toggle the navigation bar to browse historical data on a month-by-month basis or view data in an interactive chart.
Clicking “View Full Chart” will open data in an interactive Fundamental Chart to compare against other economic indicators, such as U.S. New Single Family Houses Sold. Recession periods can also be added to the backdrop on any chart. Additionally, users can export historical data to a CSV file for offline analysis by clicking the “Export” button.
Related Financial Indicators
YCharts’ aggregated report, Existing-Home Sales, contains several additional indicators related to overall U.S. Existing Home Sales. These indicators on YCharts are sourced directly from NAR’s reports, and they include:
- Midwestern US Existing Home Sales
- Northeastern US Existing Home Sales
- Southern US Existing Home Sales
- US Existing Home Inventory
- US Existing Home Sales MoM
- Western US Existing Home Sales
Implications for Investors and Policymakers
The U.S. Existing Home Sales economic indicator has significant implications for both investors and policymakers, influencing decisions across various sectors of the economy. Here’s a breakdown of how changes in this data can impact different business strategies and sectors:
Implications for Investors
- Market Sentiment and Stock Market Performance: Positive trends in existing home sales typically indicate a robust housing market, boosting investor confidence in related industries like home improvement, construction, and mortgage lending. This can lead to higher stock prices for companies in these sectors. Conversely, a decline in home sales may signal economic weaknesses, potentially leading to a market sell-off, particularly in housing-related stocks.
- Interest Rates and Bond Yields: Strong existing home sales might push the Federal Reserve to consider tightening monetary policy, leading to higher interest rates. This can impact bond yields, making them more attractive to investors. Declining home sales, however, could prompt the Fed to maintain or lower interest rates, which might reduce bond yields and push investors towards equities.
- Real Estate Investment: Rising existing home sales suggest a healthy real estate market, encouraging real estate investments and increasing property values. A downturn in sales could signal a cooling market, potentially leading to lower property values and affecting real estate investment strategies.
Implications for Policymakers
- Monetary Policy: Policymakers at the Federal Reserve use existing home sales data to gauge the health of the housing market and broader economy. Strong sales data may lead to tighter monetary policies to curb potential inflation, while weak data could prompt stimulus measures to support the economy.
- Fiscal Policy: Changes in home sales can influence government fiscal policies, particularly regarding housing subsidies, tax incentives for homebuyers, and infrastructure spending to support housing development.
- Economic Forecasting and Planning: Policymakers use this data to make informed decisions on economic forecasting, planning, and resource allocation. A strong housing market may lead to investments in related infrastructure, while a weak market might necessitate intervention to stabilize the sector.
Effects on Business Strategies and Sectors
- Housing and Construction: Homebuilders and construction companies adjust their strategies based on existing home sales trends. High sales may lead to increased construction activity, while declining sales might cause a slowdown in new projects.
- Financial Services: Banks and mortgage lenders closely monitor this data to adjust their lending strategies. An increase in home sales can lead to more mortgage originations, while a decrease may result in tighter lending conditions and a focus on refinancing existing loans.
- Retail and Consumer Goods: Retailers, particularly those in the home improvement and furnishings sectors, benefit from strong home sales as new homeowners invest in upgrades and decor. Declining sales could lead to a decrease in demand for these products, impacting sales strategies and inventory management.
- Energy and Utilities: A strong housing market often correlates with higher energy consumption and demand for utilities, prompting companies in these sectors to plan for increased capacity and infrastructure development. A slowdown in sales may lead to a reassessment of expansion plans.
- Consumer Confidence and Spending: Existing home sales data is a barometer of consumer confidence. Strong sales suggest consumers are willing to make large investments, which can spur spending across other sectors. Weak sales might indicate declining confidence, leading to more conservative consumer behavior and affecting businesses reliant on discretionary spending.
Changes in U.S. Existing Home Sales data are closely watched by investors, policymakers, and businesses alike, as they provide a window into the broader economic landscape and can significantly influence strategic decisions across multiple sectors.
YCharts Feature Highlights
Fundamental Charts
Visualize existing home sales movement over time by building a Fundamental Chart. Additional economic indicators, securities, funds, and indices can be added for an enhanced visual comparison. Emphasize critical junctures with interactive annotations, static Min, Max, and Average annotation lines, as well as aesthetic modifications such as custom colors or an Area Chart.
All charts are equipped with a recession overlay feature, which provides shaded gray boxes during U.S. recessions. This is especially useful for showing correlations between recessionary periods and housing market contractions.
Timeseries Analysis
Import one or several home sales indicators into Timeseries Analysis to conduct a thorough historical lookback across custom frequency periods. Data can be exported into CSV format for analysis in YCharts’ Excel Add-in or as a standalone file.
Comp Tables
Pull the existing home sales indicator in Comp Tables along with additional data points to compare movements over time, spot trends, and make informed investment decisions. Results can be exported to a CSV file or even a printable PDF for convenient, single-page analysis.
Alerts
YCharts provides real-time updates and customizable alerts for U.S. existing home sales, ensuring users stay informed of any significant changes. This feature is particularly valuable for active traders and portfolio managers who need to react swiftly to new economic data.
Conclusion
The U.S. Existing Home Sales economic indicator on YCharts is an invaluable tool for anyone looking to understand the housing market and its broader economic implications. Through its robust features, YCharts enables users to not only track historical trends but also to anticipate future movements and make data-driven decisions across various business and investment contexts.
Whether you’re an advisor looking to optimize client portfolios or a policymaker assessing economic health, YCharts’ comprehensive analysis of U.S. Existing Home Sales provides the insights needed to navigate the complexities of the market.
To arm yourself with YCharts’ extensive library of economic indicators, charting software, and analysis tools, get in touch for a personalized information session or start a free trial.
Whenever you’re ready, there are 3 ways YCharts can help you:
1. Looking to better communicate the importance of economic events to clients?
Send us an email at hello@ycharts.com or call (866) 965-7552. You’ll be directly in touch with one of our Chicago-based team members.
2. Want to test out YCharts for free?
Start a no-risk 7-Day Free Trial.
3. Download a copy of the Quarterly Economic Update slide deck:
Disclaimer
©2024 YCharts, Inc. All Rights Reserved. YCharts, Inc. (“YCharts”) is not registered with the U.S. Securities and Exchange Commission (or with the securities regulatory authority or body of any state or any other jurisdiction) as an investment adviser, broker-dealer or in any other capacity, and does not purport to provide investment advice or make investment recommendations. This report has been generated through application of the analytical tools and data provided through ycharts.com and is intended solely to assist you or your investment or other adviser(s) in conducting investment research. You should not construe this report as an offer to buy or sell, as a solicitation of an offer to buy or sell, or as a recommendation to buy, sell, hold or trade, any security or other financial instrument. For further information regarding your use of this report, please go to: ycharts.com/about/disclosure
Next Article
Your End-of-Year Guide to Tax-Efficient Portfolio PlanningRead More →