Win Advisor Mindshare. Earn Model Allocations. Scale Distribution Impact.
YCharts helps asset managers strengthen every stage of distribution, from pre-meeting positioning to post-meeting follow-up; enhancing consistency, quality, and growth in model allocations.


Success in Advisor Engagement and Model Wins

96% Wholesalers recommend YCharts,with 70% adoption across the largest asset managers.

9 in 10 wholesalers say YCharts improves how they position funds with advisors, making differentiation and portfolio fit more clear.

9 out of 10 wholesalers report that YCharts has helped or is expected to help win or expand model allocations.
A Dynamic, Competitive Advantage
YCharts empowers distribution teams to compare strategies, overcome objections, and answer advisor questions in real time. This strengthens relationships, drives decisions forward, and reduces “I’ll get back to you” moments.

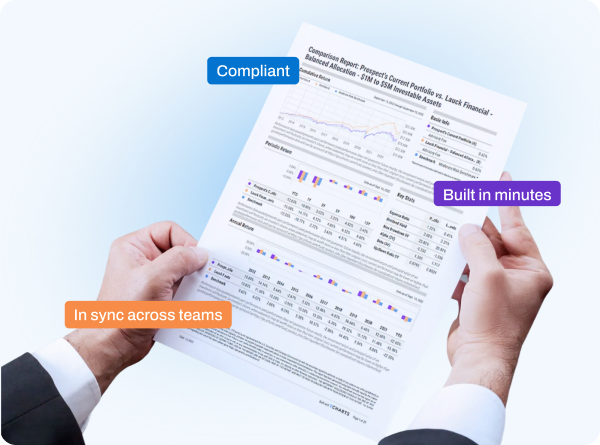
Compliantly Accelerate Sales Cycles
Not only do firm-approved templates help fund managers, OCIOs, and alternative asset managers deliver compliant, real-time follow-up, but they also reduce back-office strain, speed sales cycles, and win more business with advisors.
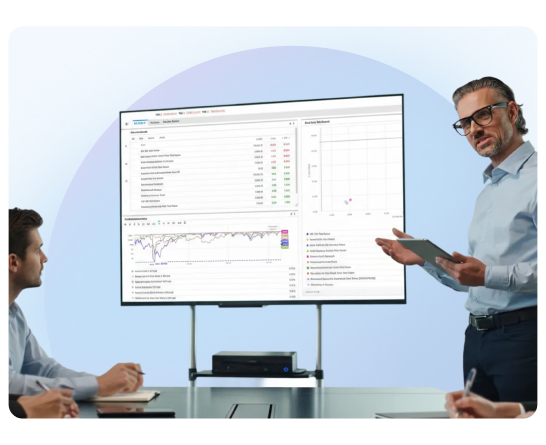
Present Where Advisors Already Make Decisions
9 in 10 wholesalers say YCharts meaningfully improves advisor presentations and engagement. Each conversation is powered by the same platform thousands of advisors use daily to analyze portfolios and make investment decisions.

“ At the point of sale, harnessing the power of visualization with an advisor can lead to more effective outcomes, increased engagement, better retention of knowledge, and of course higher sales and deeper relationships. YCharts is the equivalent of bringing a gun to a fist fight.”

Larry Milder, Head of National Sales at Catalyst Funds
Deliver Consistent, In-Meeting Impact
Give distribution teams the tools to position solutions, respond in real time, and accelerate outcomes consistently, compliantly, and at scale.


Differentiate Your Strategies Where Decisions Are Made
YCharts helps asset managers transform advisor meetings into allocation opportunities. Distribution teams compare strategies instantly, overcome objections with data-backed visuals, and deliver compliant materials immediately after conversations.
Teams improve meeting impact with greater consistency while strengthening positioning and accelerating model adoption.

Featured Insights
Stay ahead of where assets are moving to ground your outreach in current allocation trends.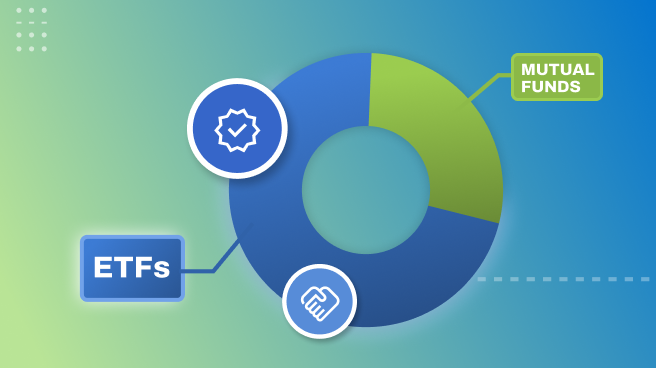
7 Categories Where Advisors Chose ETFs Over Mutual Funds in 2025

How YCharts Helps Asset Managers Secure Assets in the Model Explosion

Monthly Fund Flow Report