YCharts for Personal Investors & Educators

Screen for New Investment Ideas
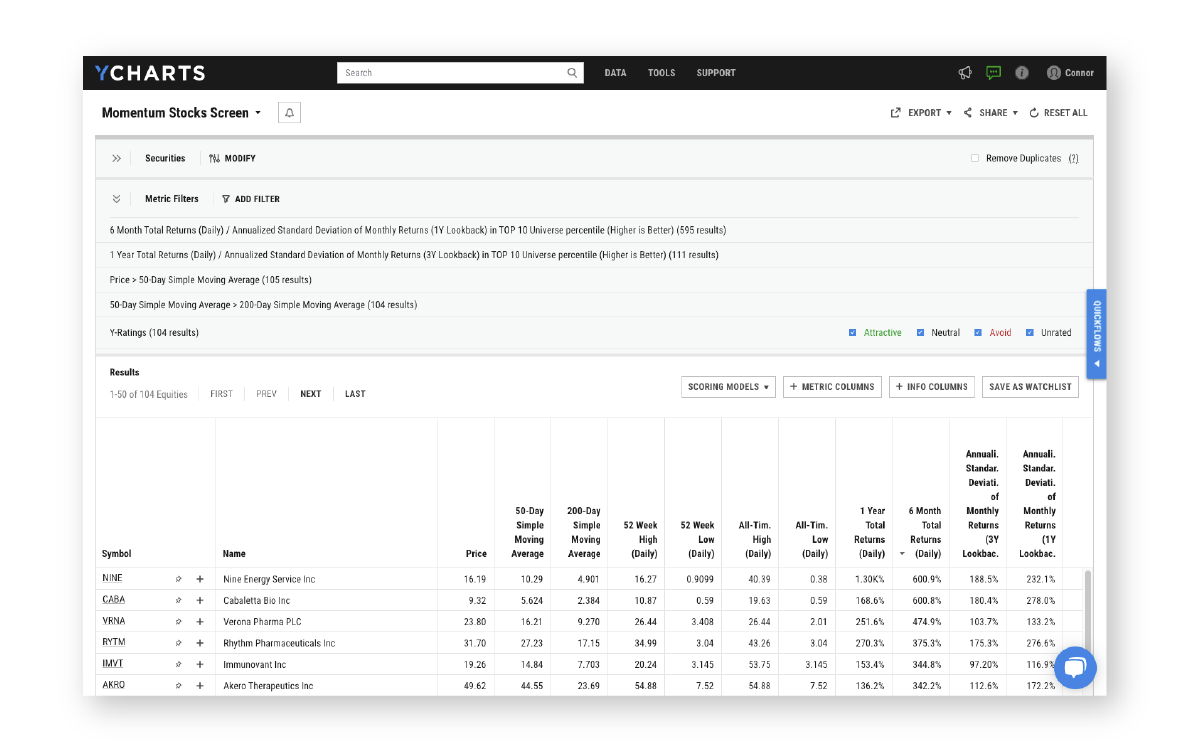
The YCharts Stock Screener narrows an expansive universe of 20,000+ equities using 4,500 quantitative and qualitative metrics. Build screens that bring your investment strategy to life or leverage any of 24+ pre-built screening templates, and receive alerts as securities enter or leave your Screener results.
Case Study
Zel Abdu
The Challenge
Zel formerly utilized as many as 15 different free resources to power his research and analysis. While the free sites and tools he was using were relevant, he wanted a single platform that provided both comprehensive datasets and an intuitive layout.
The Solution
Upon adding YCharts to his tech stack, Zel was able to streamline his research process and eliminate disparate tools. It’s proven to be the tool he uses most often because of its powerful functionality and expansive data.
The Playbook

Fundamental Charts

Timeseries Analysis
Compare and Rank Investment Opportunities
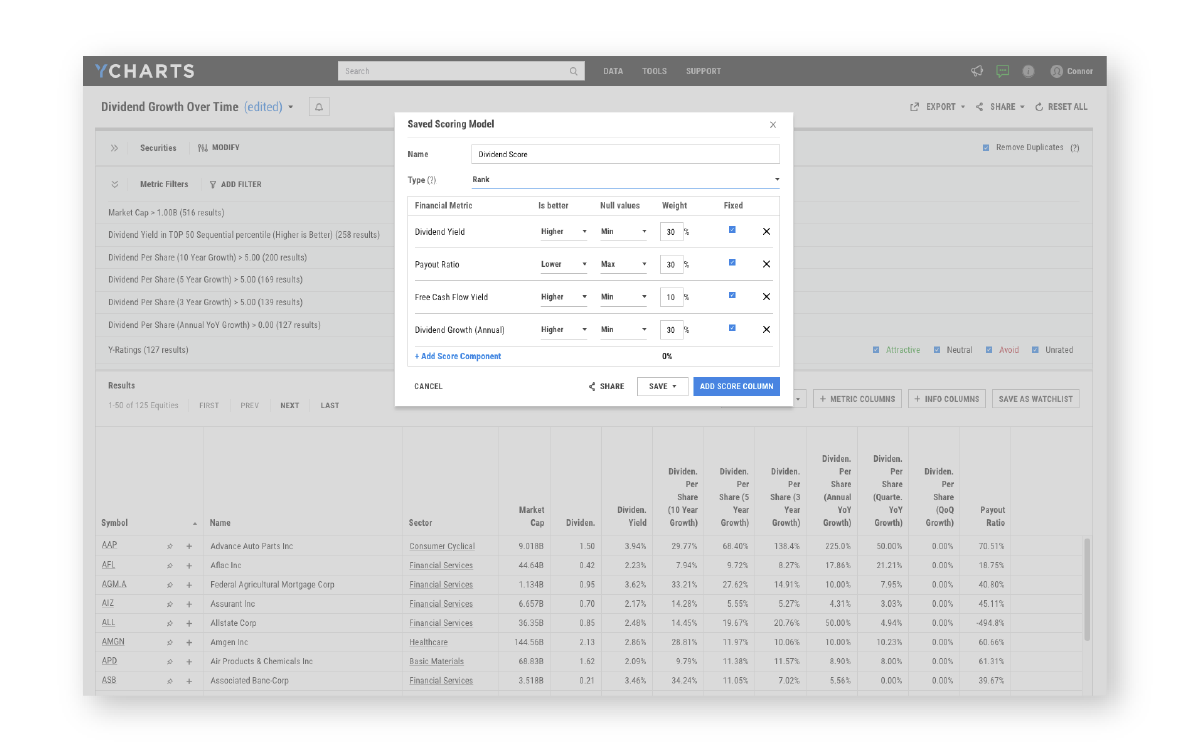
Build comprehensive data tables that compare and contrast securities, whether your current holdings or a watchlist of companies. To holistically evaluate different opportunities, use Scoring Models to select metrics of importance, assign weights to each, and create a custom ranking of your investment options.
More Ways Personal Investors & Educators Can Maximize YCharts
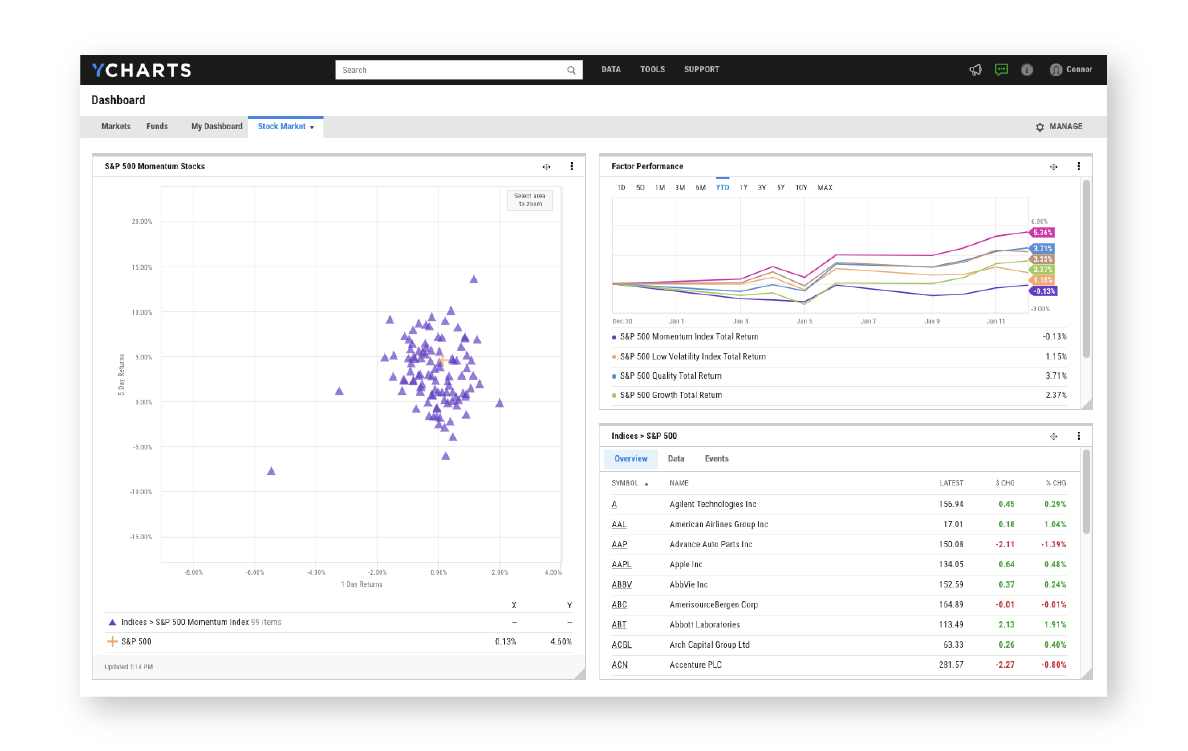
Monitor the Markets, Economic Trends, and Your Portfolio at a Glance
Stay ahead of market movements with a personalized Dashboard, intra-day pricing, and over a quarter million economic indicators. Customize all visuals, metrics, and data points to your liking to understand market trends at-a-glance.
Bring Real-World Investing Scenarios to the Classroom
Professors, instructors & educators of varying levels use YCharts investment software to teach their students about financial statements, valuation techniques, diversification & portfolio construction, and market cyclicality. High horsepower research tools with real market data, and none of the financial risk.
Case Study
Eric Robbins, CFA, CFP®, Penn State Behrend, Black School of Business

The Challenge
Finance isn’t always the easiest subject and Eric’s students often found it challenging to make sense of the vast amount of information available. Eric needed a better way to engage students with real-world, hands-on learning experiences.
The Solution
Eric uses YCharts to bring the real world data and trends into the classroom and has enabled his students to explore financial concepts at a deeper level.
The Playbook

Portfolios
Fundamental Charts
![]()
See What YCharts Can Do for You.
Talk to one of our Experts.
Request a demo to have one of our product specialists walk you through the platform.