Smarter Insights. Engaging Conversations. Scalable Growth.
Conduct due-diligence, optimize portfolios, and generate reports for client and prospect meetings—all in less time.
Tools

Dashboard
Keep your portfolios, top holdings, research lists, and favorite market & economic data front-and-center. Add watchlists, visuals, and earnings calendars & share with your team to stay aligned.
Learn More →

Portfolios
Visualize your investment strategies to test and validate new investment ideas, compare performance & risk, and drive report-generation. Seamlessly import portfolio data via integration or file upload.
Learn More →

Fundamental Charts
Visualize any trend, any metric, and any security. From alpha to z-score & equities to SMAs, annotate charts with call-outs, overlay economic data, and add your firm’s logo and color scheme.
Learn More →

Portfolio Optimizer
Build the optimal allocation strategy to mitigate exposure to risk, maximize portfolio performance, and enhance data-driven decision-making for portfolio management.
Learn More →

Fund Screener
Narrow a universe of 45,000+ mutual funds, ETFs & CEFs using your chosen criteria like performance & risk metrics, category rankings, brokerage-availability, security exposures & more.
Learn More →

Stock Screener
Filter 20,000+ equities and ADRs using 4,500+ qualitative and quantitative metrics. Generate smarter ideas and construct better portfolios using custom Scoring Models & your choice of data.
Learn More →
Integrations
Orion
Easily import client accounts and model portfolios from Orion to YCharts. Create compelling portfolio comparison reports, test hypothetical replacements, and identify drivers of performance & risk.
Learn More →
Black Diamond
Integrate Black Diamond and YCharts to analyze asset allocations and security-level holdings, create custom reports, and streamline sharing of client communication and prospecting materials.
Learn More →
Schwab Advisor Center
Import and analyze client portfolio data, and quickly jump to Schwab Advisor Center® from within your YCharts account. Test replacements, create custom reports, and share visuals with clients & colleagues.
Learn More →
Redtail
Generate proposals and portfolio comparison reports, analyze performance & risk, and save time by importing Redtail data for client accounts and model portfolios into YCharts.
Learn More →
Addepar
Quickly and seamlessly access client data from Addepar within YCharts to prepare meeting materials, create reports & visuals, and dig deeper on exposures, allocations & holdings.
Learn More →
Pershing
Easily import portfolio holdings and weights from Pershing to YCharts to analyze model and client portfolios’ performance, risk, asset allocations, security-level holdings, and more.
Learn More →
Data

Stocks
Intraday pricing and 30 years of history for 20,000+ equities and ADRs traded on North American exchanges. Financial statements, consensus analyst recommendations, and firm-branded tearsheets.

Mutual Funds & ETFs
A universe of 45,000+ funds, plus CEFs and UITs, including asset flows, manager info, brokerage availability, category rankings, and more. Sourced from Morningstar.

ESG
More than 30 environmental, social & governance data points for North American companies, including greenhouse gas (GHG) emissions. Also aggregated at the portfolio & fund levels. Sourced from MSCI.

Economic Data
An industry-leading compilation of 500,000+ economic indicators & data points, plus a sortable calendar. Sourced by YCharts from the Federal Reserve, Bureau of Labor Statistics, and other institutions.

Fundamentals
Full suite of valuation ratios and metrics including earnings-per-share (EPS), price-to-earnings (P/E), sales (P/S), and free cash flow (P/FCF). Plus sector and industry averages for holistic comparisons.

SMAs
A centralized, researchable database of nearly 10,000 Separate Accounts (SMAs) from dozens of asset managers. Fundamental metrics and fund characteristics sourced from Morningstar.
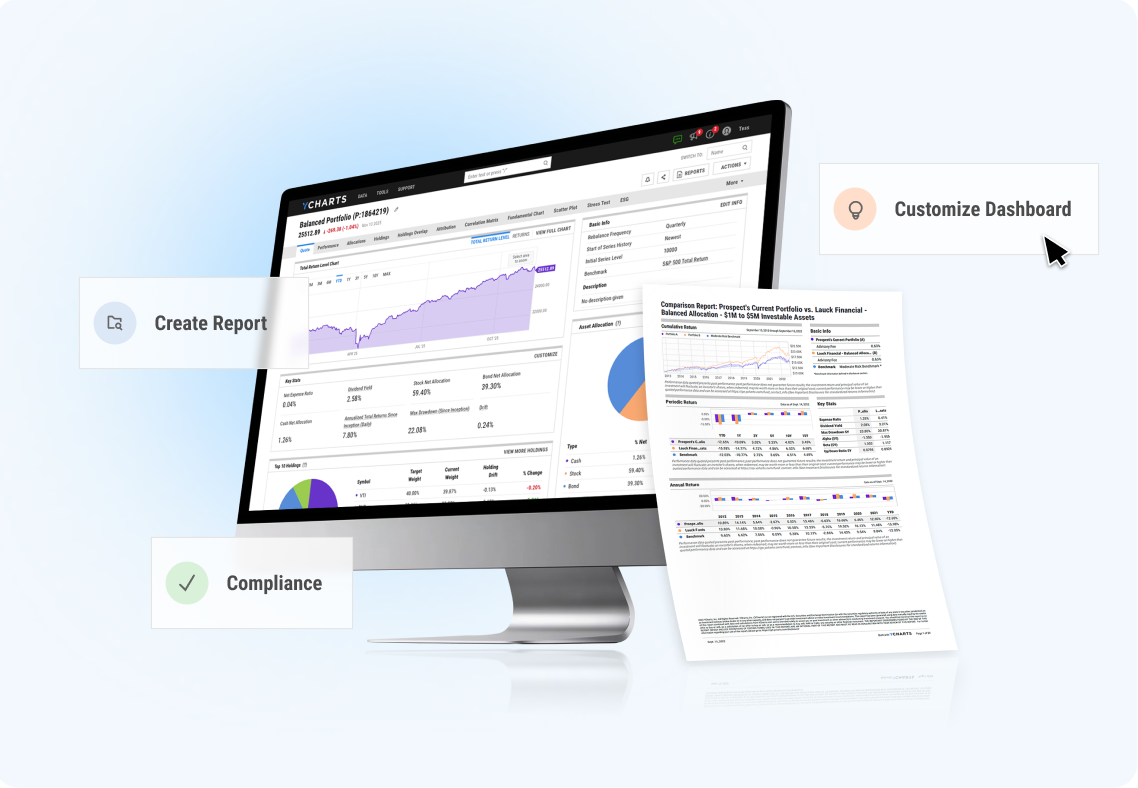
Proposals

Report Builder
Leverage this intuitive, drag-and-drop designer to create your ideal report or presentation. Featuring 5 different report types, 30+ modules, and several templates to choose from–and counting.
Learn More →

Talking Points
Leverage over 4,000+ metrics, including performance, risk, and more, to select attributes that best showcase the distinct value propositions of your strategy & creating tailored proposals and reports.
Learn More →

Custom Reports
Create an engaging experience for all your clients & prospects. Pre-built reports for portfolios, funds & stocks are customizable for length, data, visuals, and a logo & colors of your choosing.
Learn More →
![]()
See what YCharts can do for you.
Talk to one of our experts.
Reach out for a personalized demo with a YCharts product specialist.