
Report Builder
Customize your ideal investment reports and presentations for clients, prospects, and colleagues.


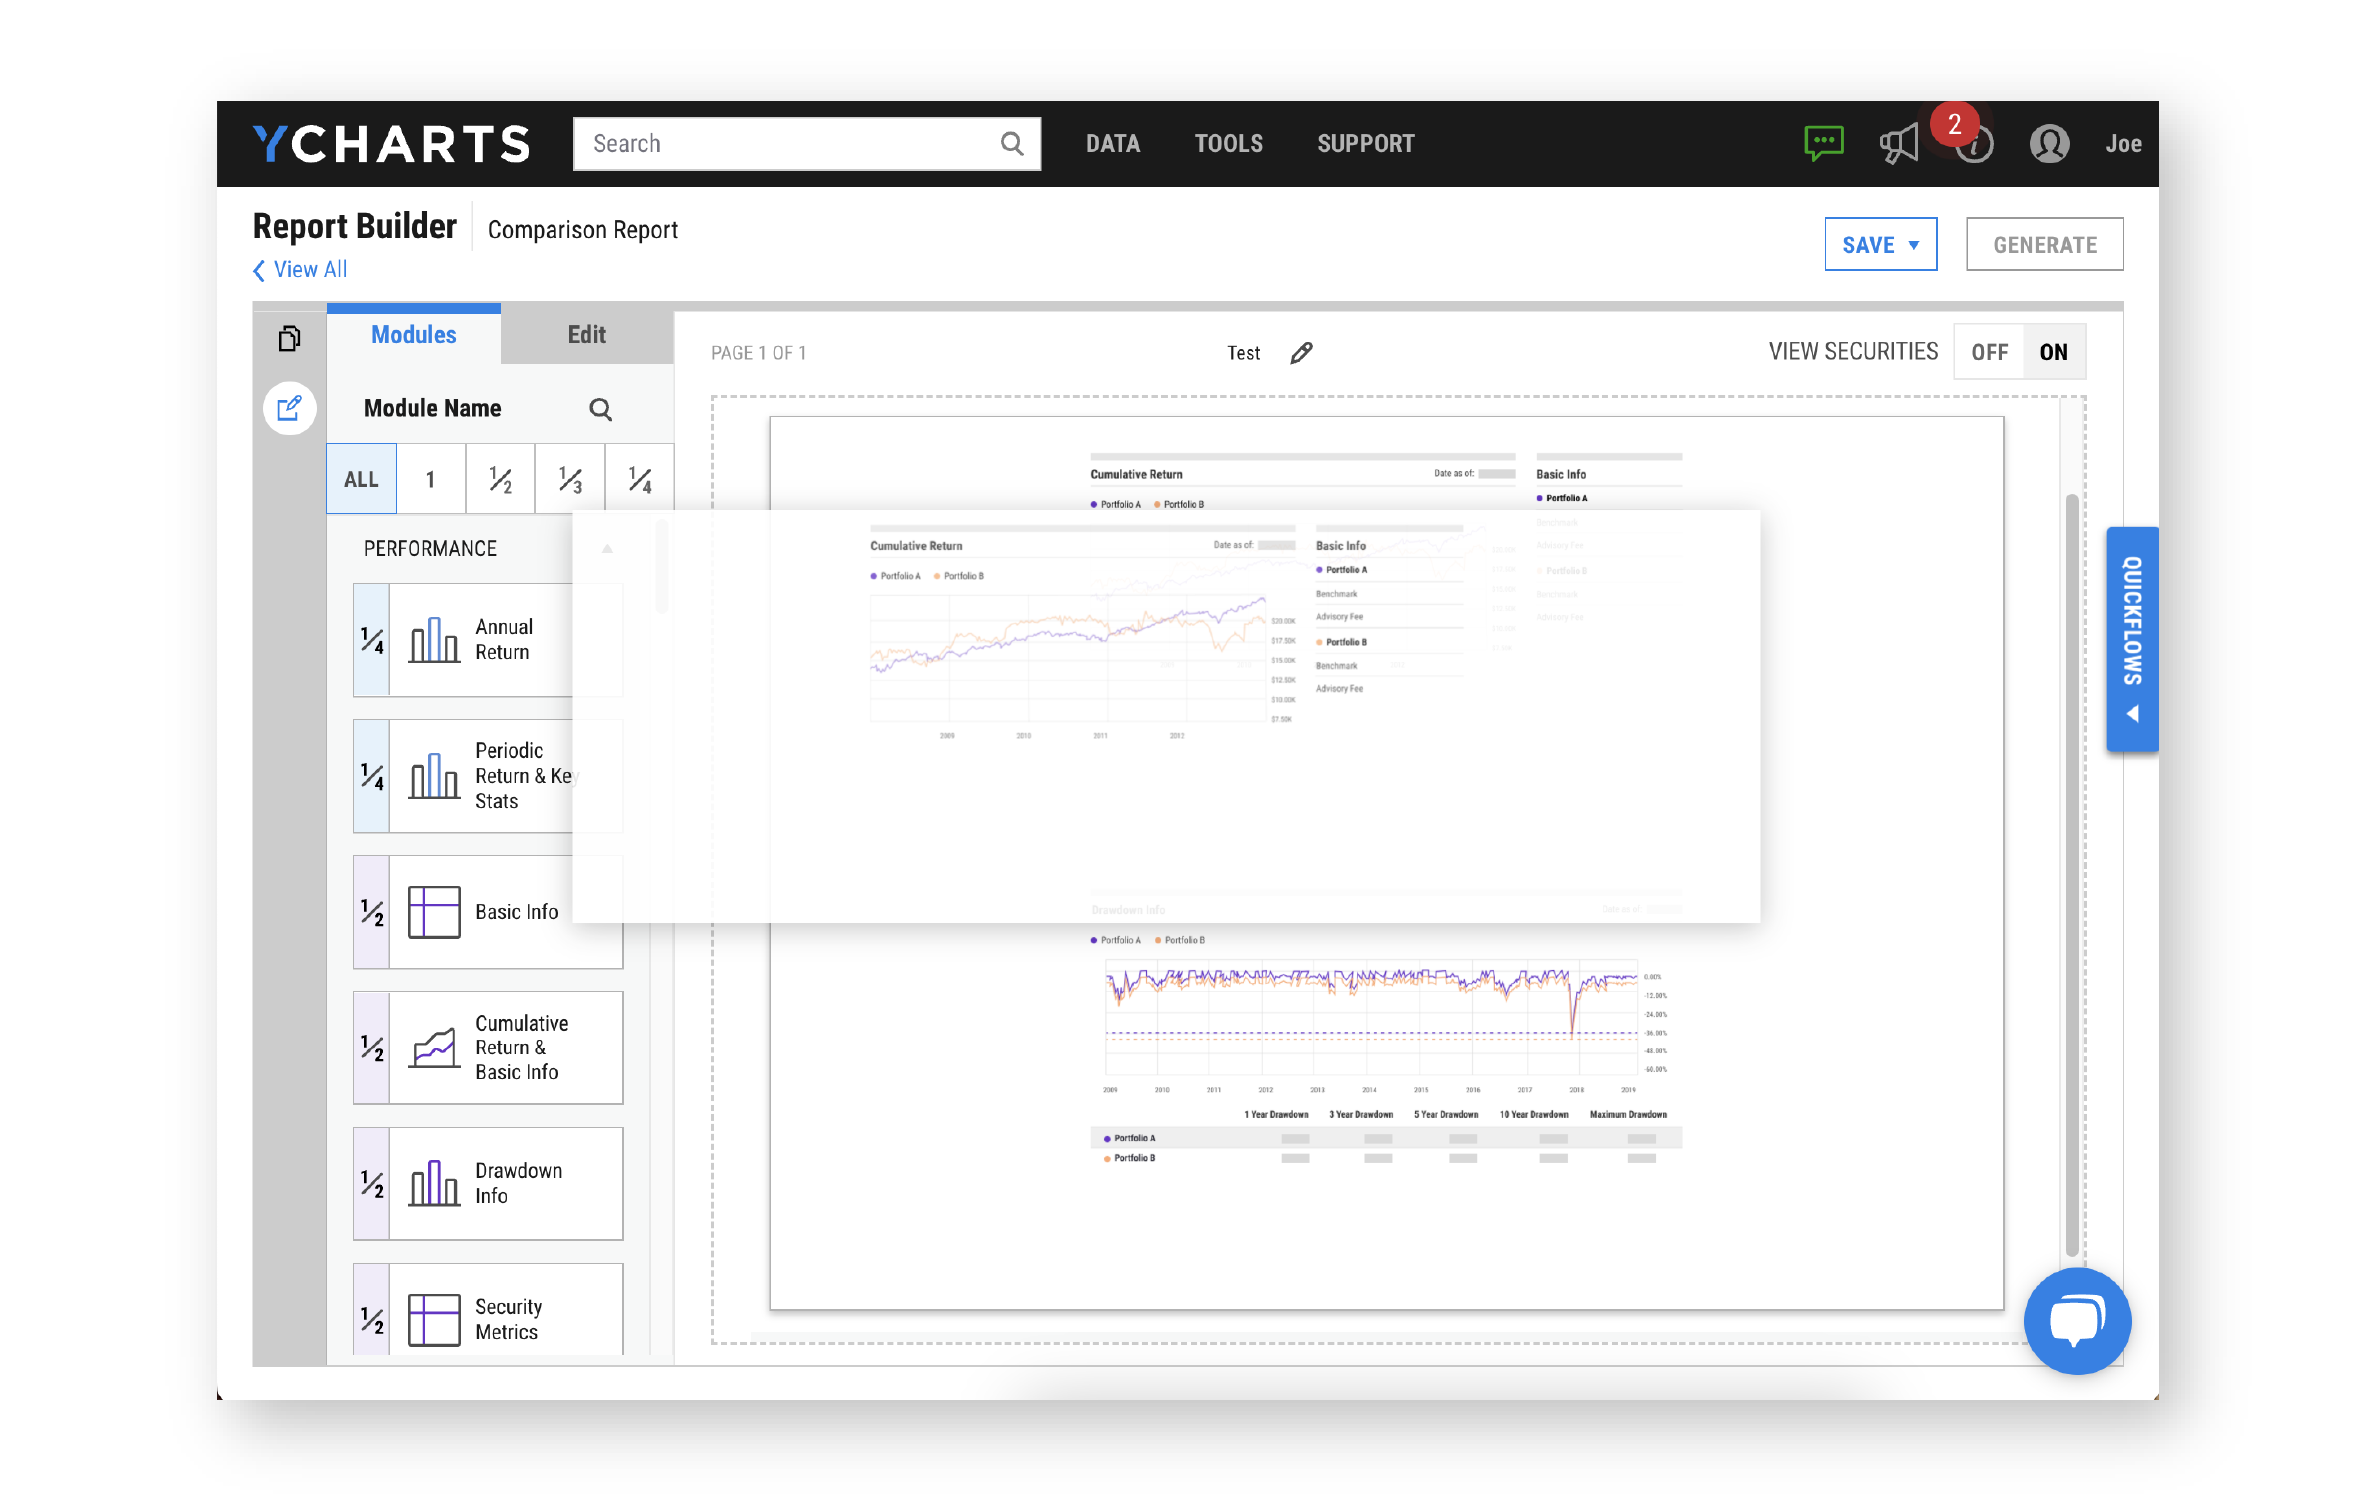
Choose from dozens of modules to build the perfect report
Report Builder is an intuitive, drag-and-drop tool that lets you create fully customized investment reports and PDF presentations. With five different report types that can feature your firm’s logo and branding along with 30+ modules covering returns, risk, allocations, exposures, holdings breakdowns and more, anyone can build their ideal report in no time.
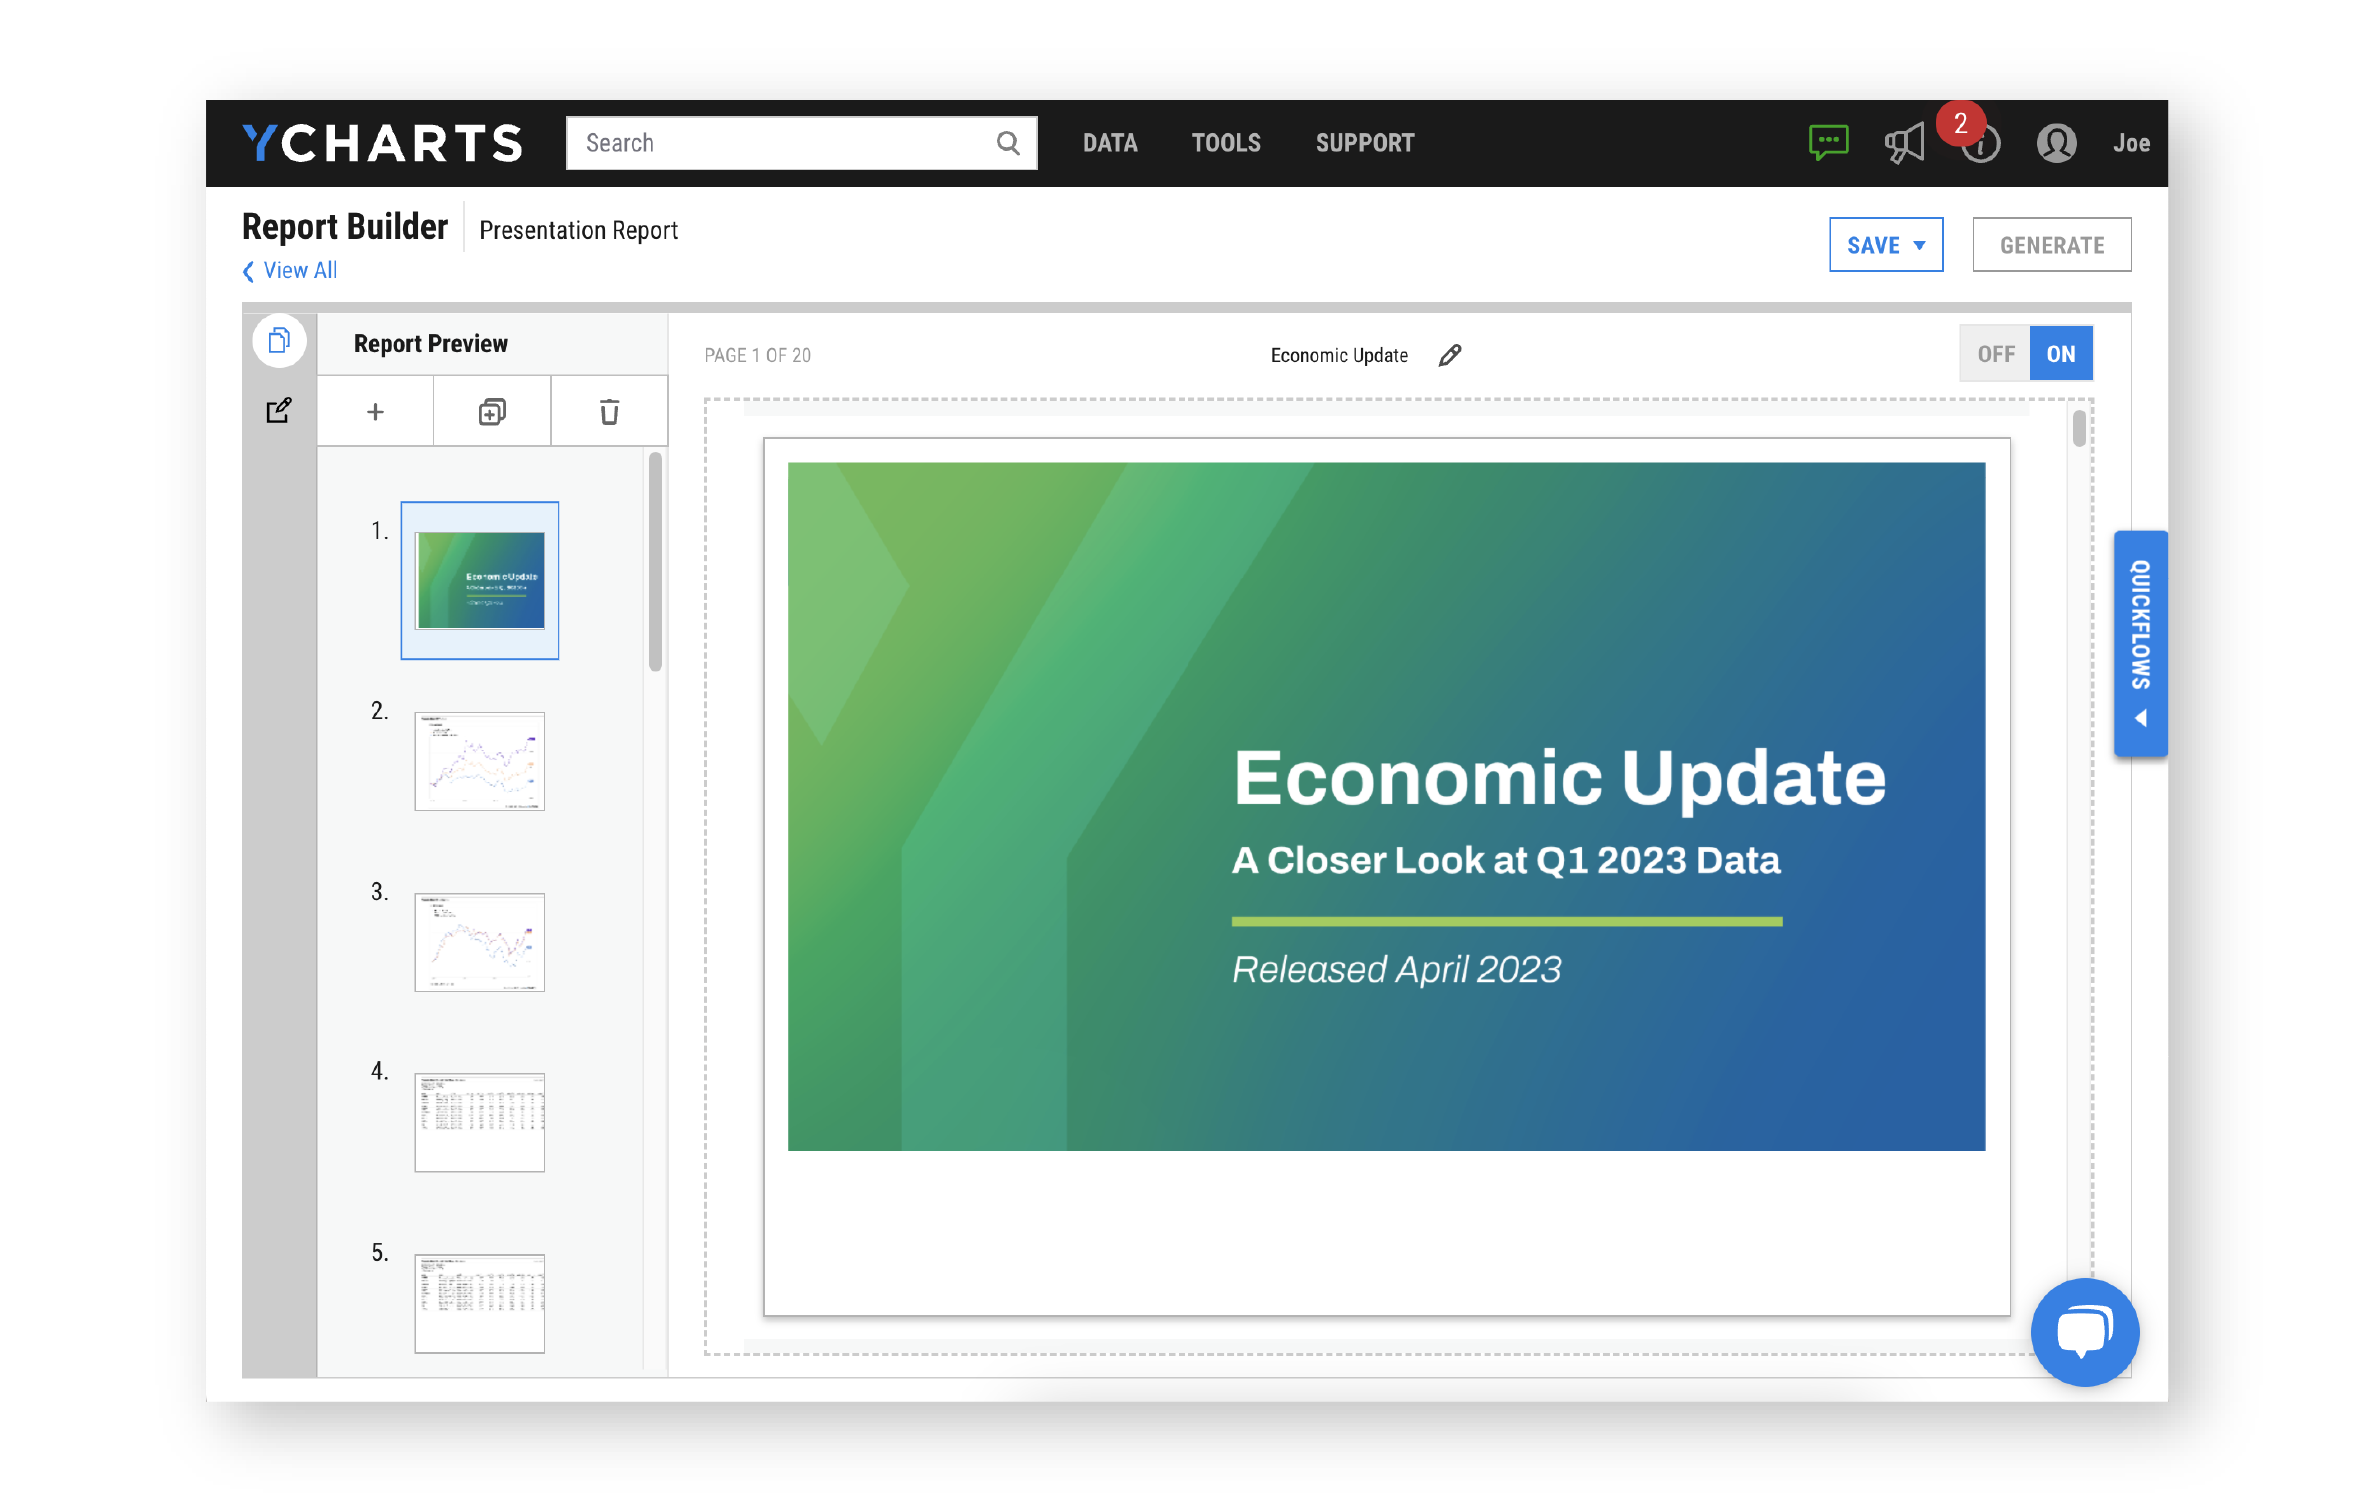
Create high-impact presentations to spur engaging conversations
Full-size images (JPEG, PNG, or PDF file, up to 30 pages) including Investment Policy Statements (IPS), proprietary research materials, or disclosures fit seamlessly alongside YCharts-powered modules within Report Builder. Further personalize each report or template by adding your firm’s fact sheets, market outlook, or other materials to make it your own.
See Report Builder in Action


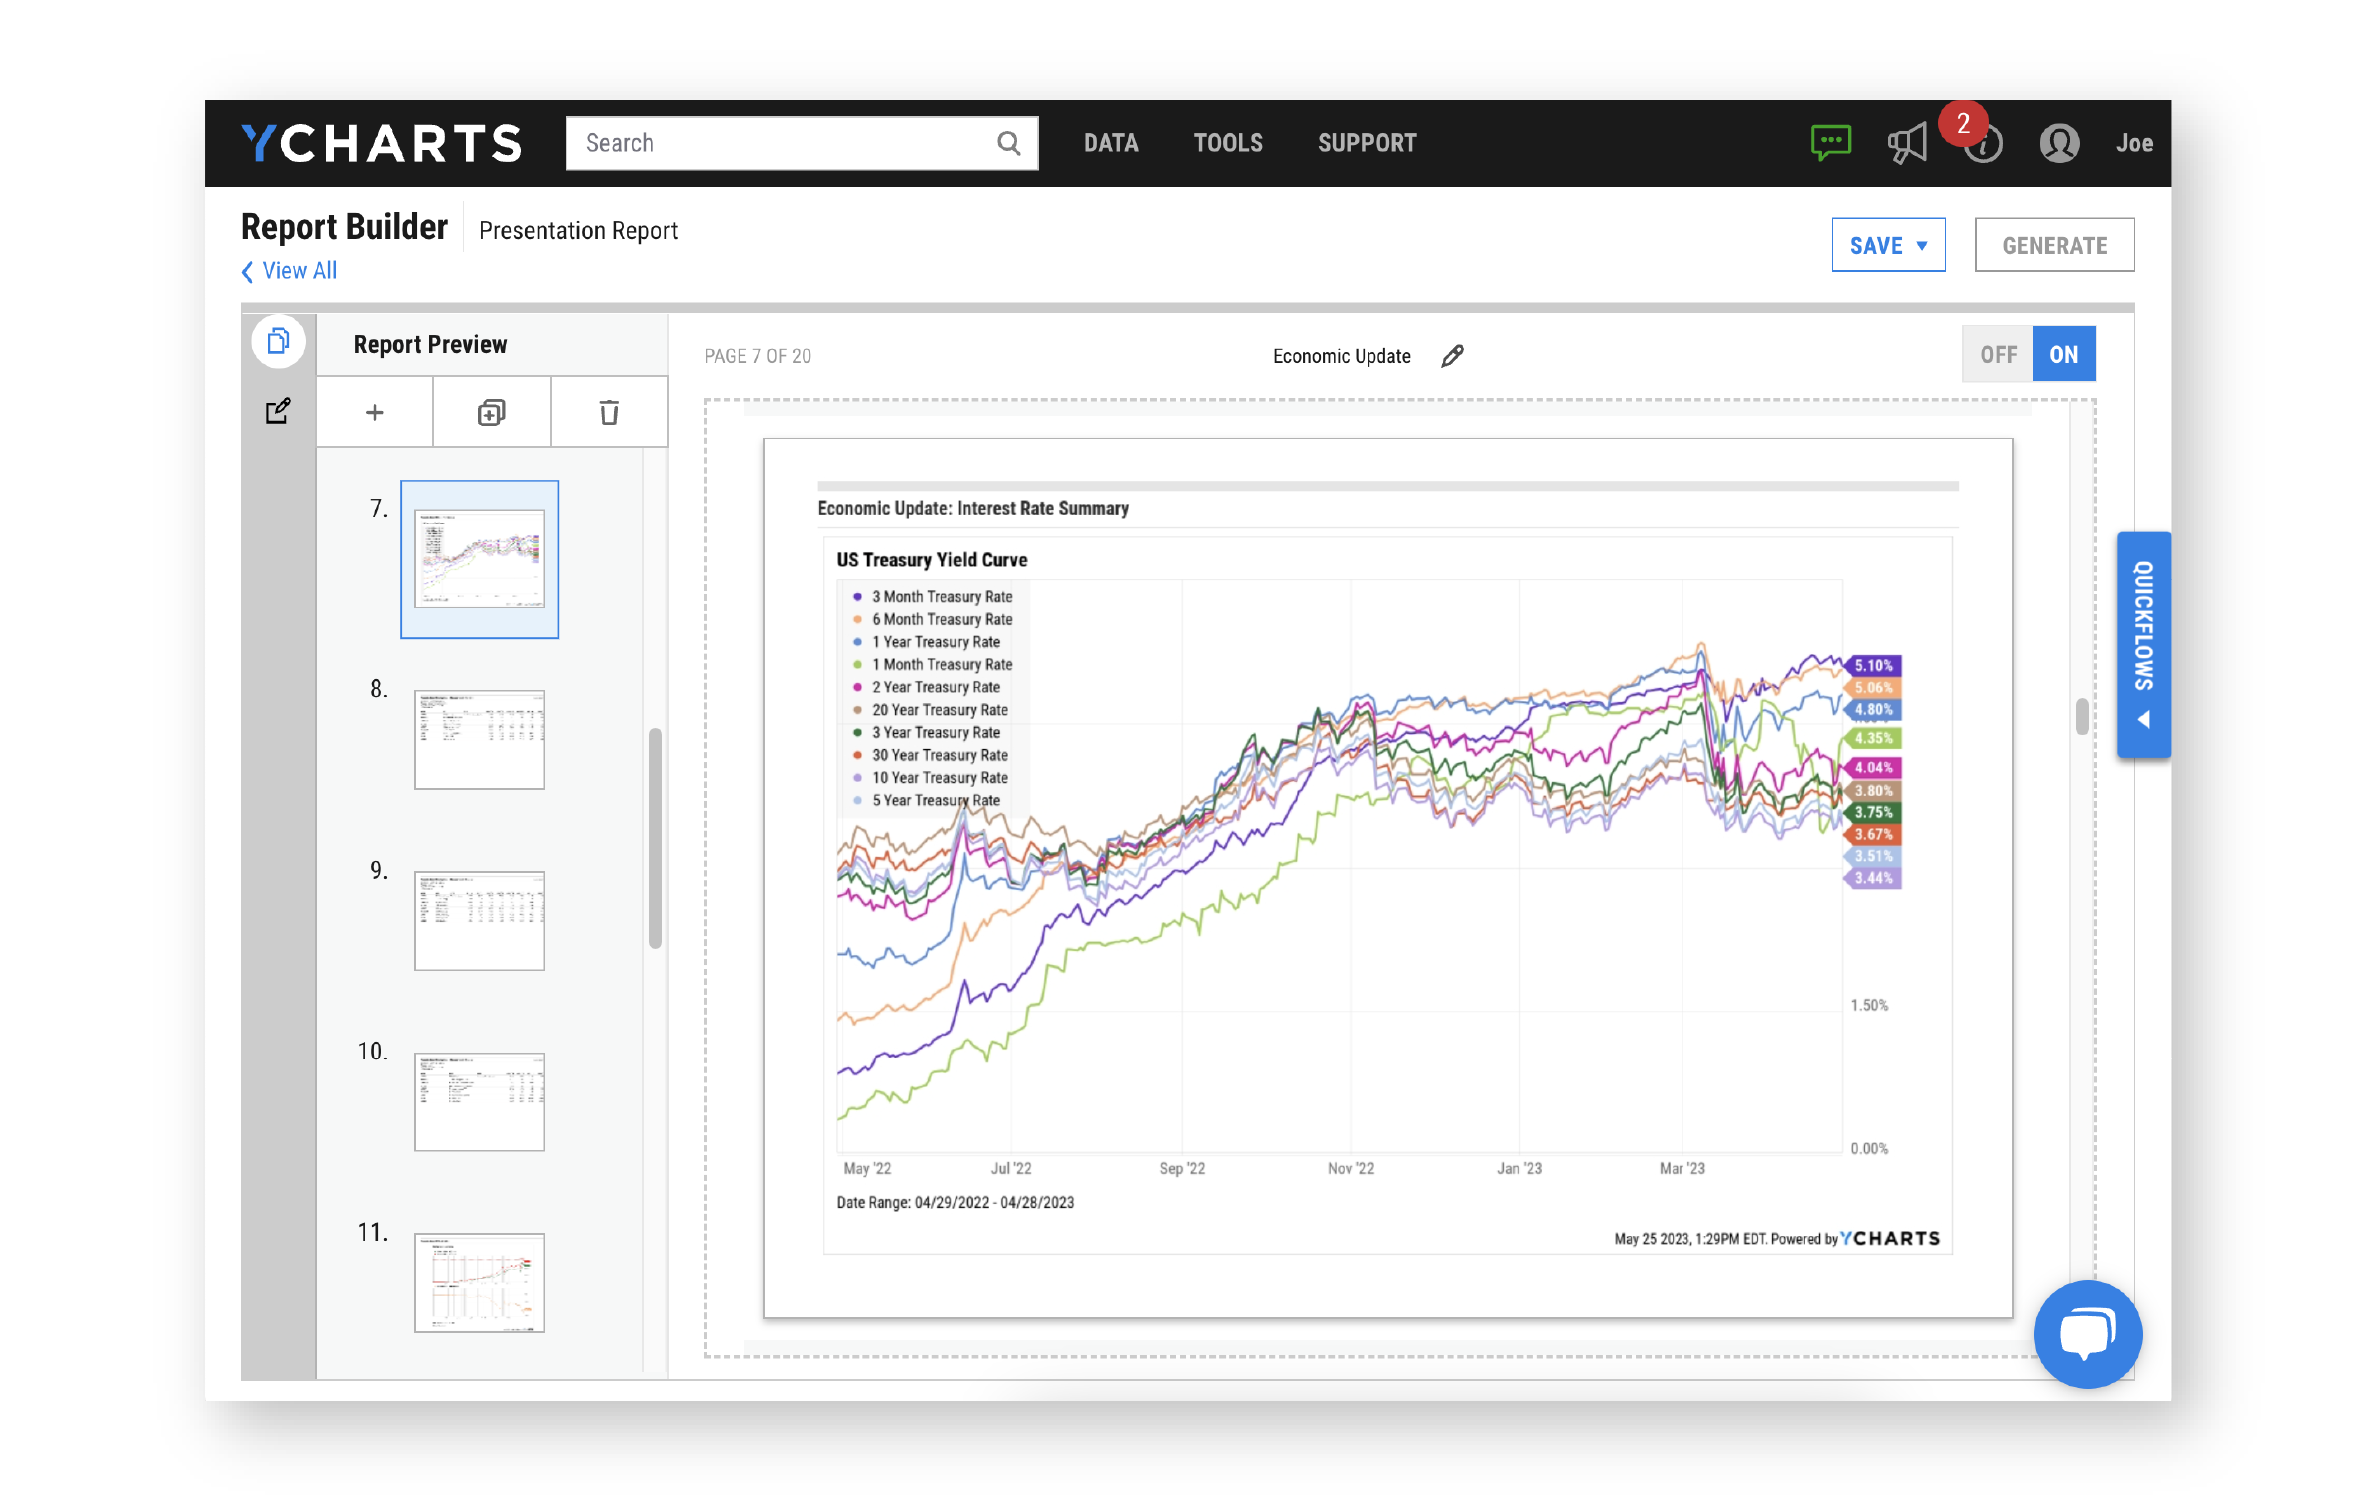
Illustrate your investment analysis and portfolio strategy
Efficiently prepare for your next meeting and create tailored proposals using previously saved assets, including charts & data tables, clean 1-page tearsheets, and incorporate economic data. Layouts can be easily changed using the drag-and-drop designer tool, saving time and effort while allowing you to create an ideal output on the fly.
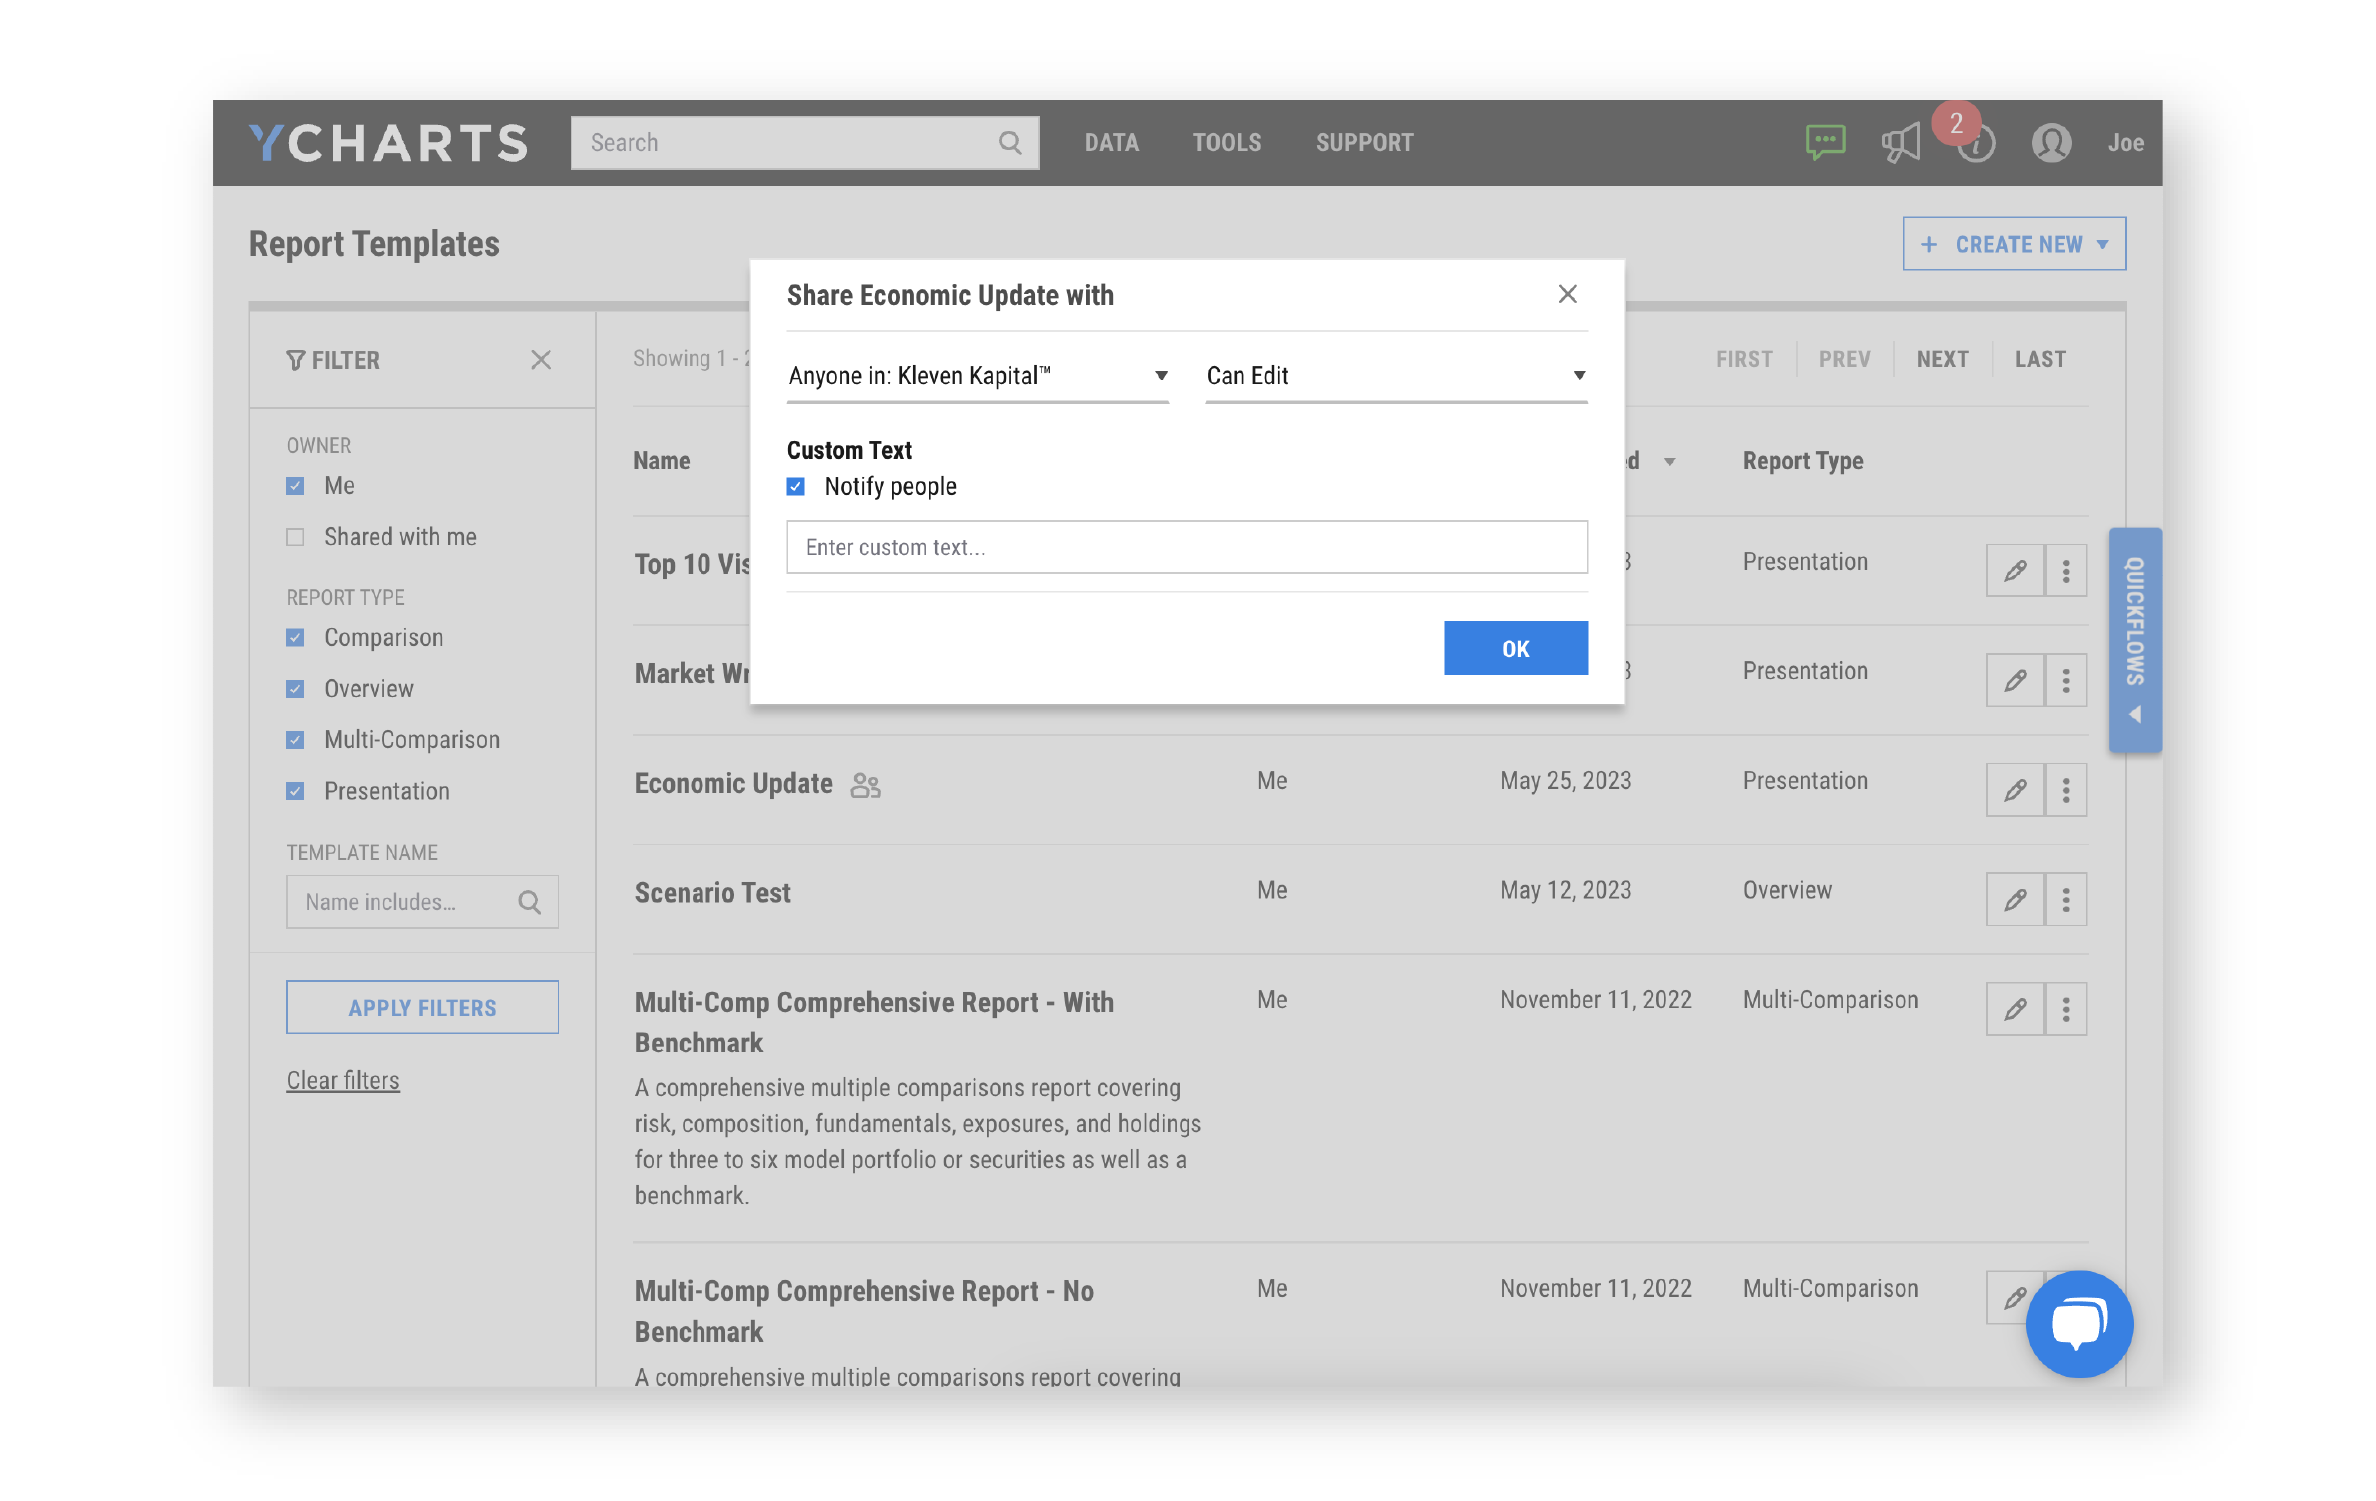
Share reports and templates across teams with ease
Create and share report, tearsheet, and presentation templates with colleagues for easy collaboration, arming teams with collateral to gather new assets. Home office users can also restrict templates to ensure that reports created by your team are compliance-friendly and touch on each strategy’s key strengths.
![]()