Using Capital Gains Insights to Strengthen Advisor Partnerships
The S&P 500 was up 22% through the end of September, the Fed just made what appears to be an insurance cut, and bond investors are still getting near-decade-high yields. If investors looked at their portfolio in 2024, feelings of euphoria would be understandable.
But in the fourth quarter, the price of market success becomes top of mind and can take a bite out of that euphoria as advisors begin prepping for the capital gains distributions that will be coming from some of their clients’ holdings.
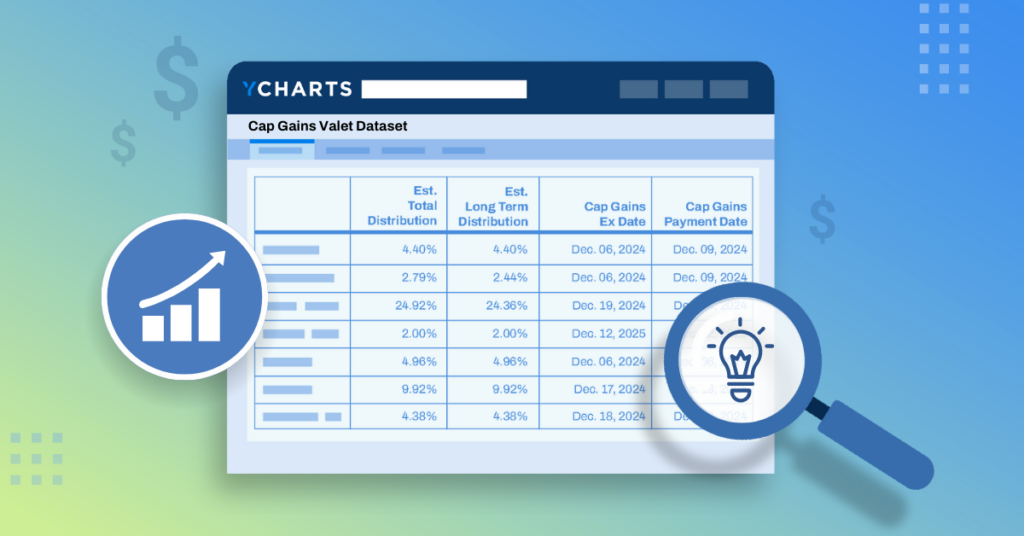
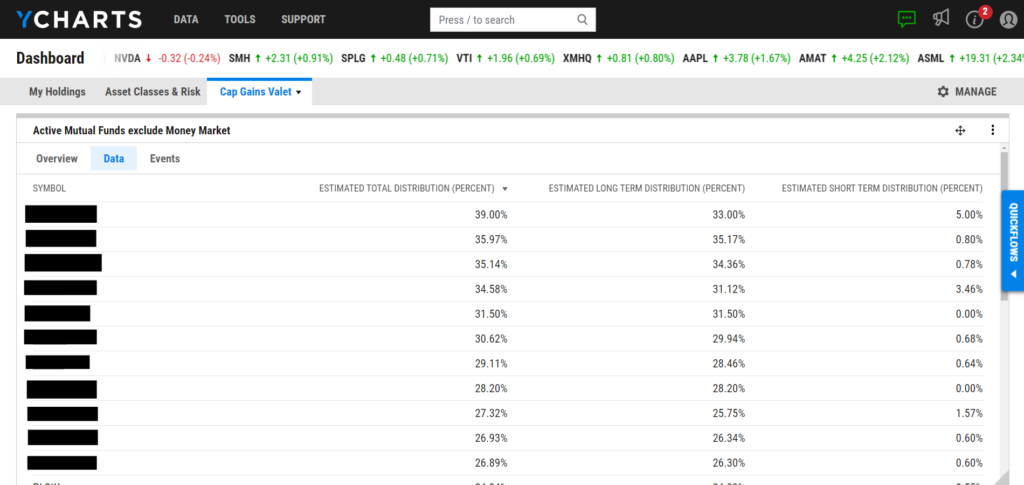
As portfolios have swelled, there are several funds preparing to kick out significant capital gains, and with YCharts’ new Cap Gains Valet dataset, you and your team can identify those funds and prepare to position against them as you seek to ultimately replace those strategies in advisor’s models.
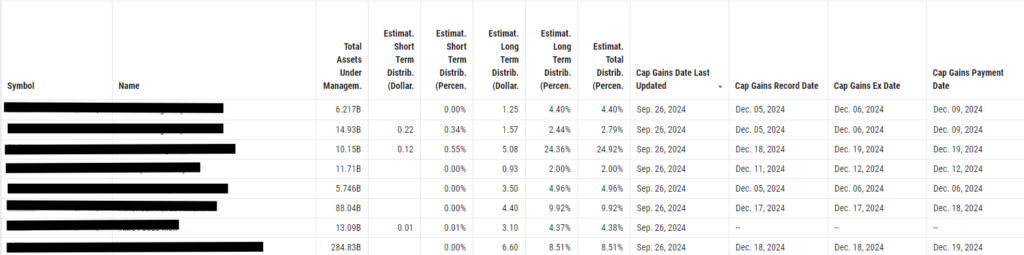
With the Cap Gains Valet dataset you can analyze distributions by their source: income, short-term, or long-term capital gains. Additionally, these distributions can be quantified either as a specific dollar amount or as a percentage of the fund’s Net Asset Value (NAV).
This dataset can be an immediate value add for you and your team. You can offer advisors a free capital gains consultation of their portfolio, or for those on the product team, you can identify the funds ripe for replacement, build the talk track, and power the distribution team to AUM growth.
Strategies for Replacing High-Cost Funds in an Advisor’s Model
Most distribution teams find the most success using YCharts as a point-of-sale tool, and the Cap Gains Valet dataset further enhances that use.
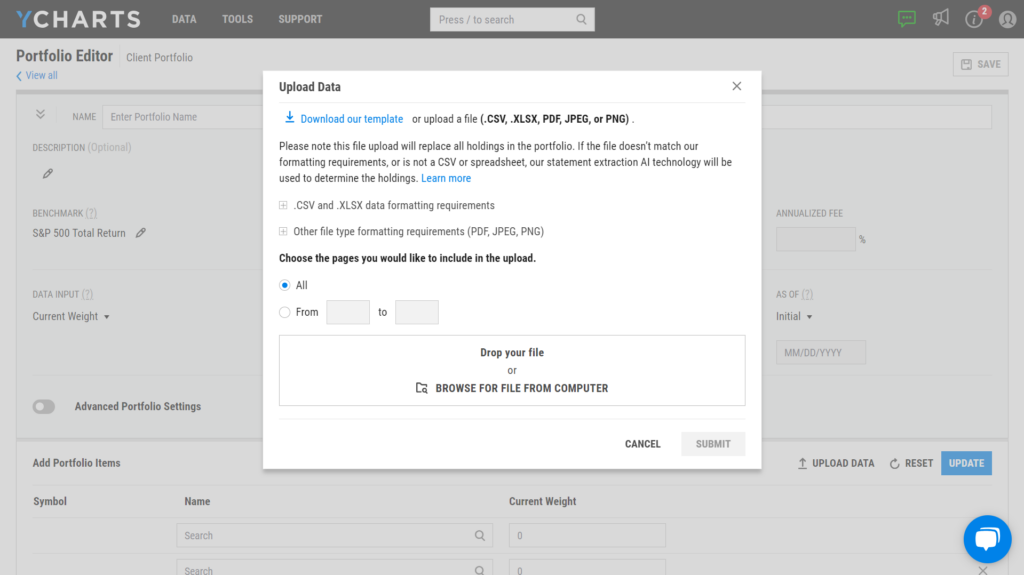
If you offer the capital gains consultation to engage with an advisor early, or if you’re deeper in the sales cycle and an advisor has entrusted you to analyze their models, YCharts’ Quick Extract tool eliminates one of the most time-consuming tasks in asset management: importing model data prior to analyzing them for opportunities.
Learn More About Quick Extract
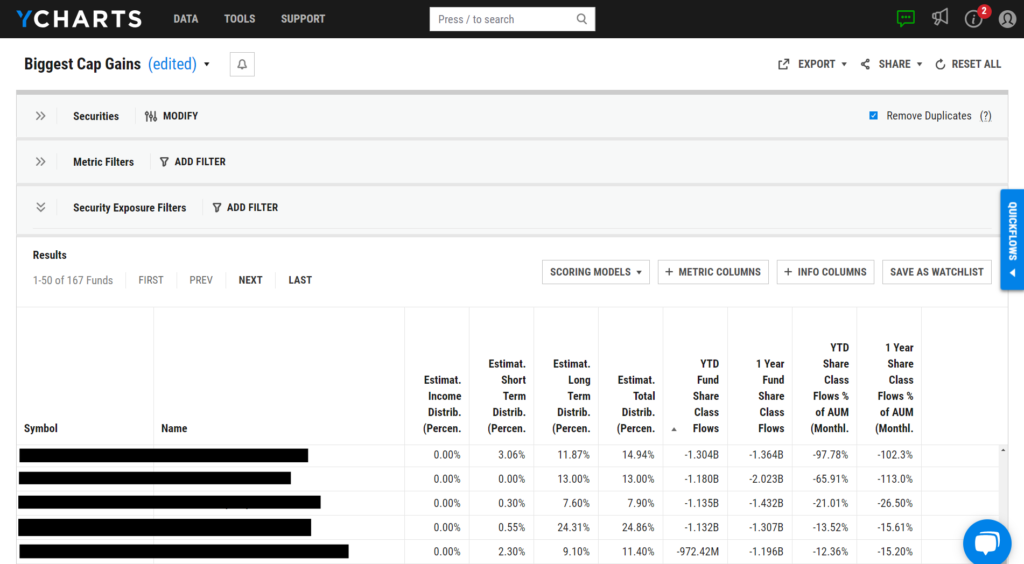
Whether you Quick Extract an advisor’s model portfolio or manually upload the holdings, you can employ the “Holdings Cap Gains” quickflow from the portfolio page to pinpoint which funds are likely to distribute substantial capital gains and begin positioning against those strategies.
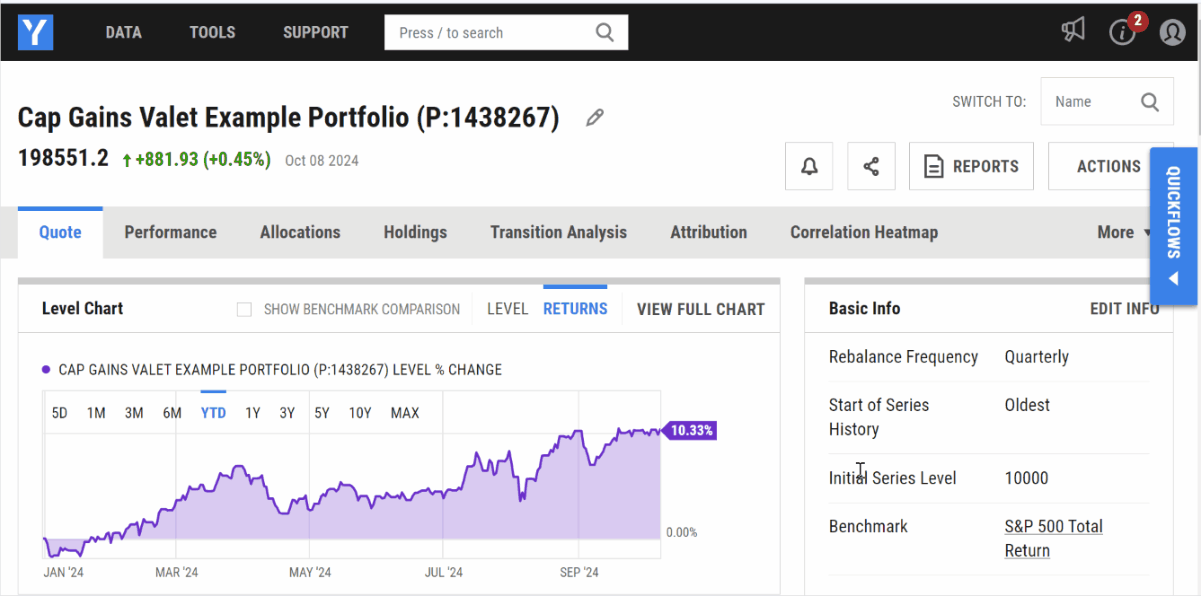
The next step involves duplicating the advisor’s model and substituting your strategy for the competitor’s fund you’re targeting. With this setup, you can then deploy Fundamental Charts and other point-of-sale tools within YCharts to illustrate your strategy’s relative strengths.
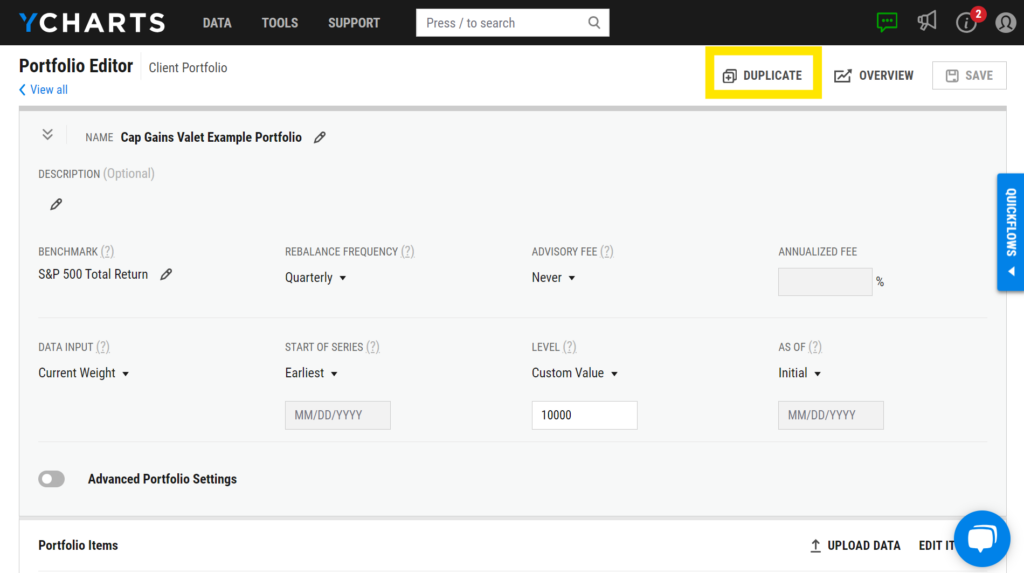
Add Your Fund to an Advisor’s Model Portfolio
This workflow benefits all asset managers, but particularly those issuing ETFs or offering ETFs in their product lineup. Capital gains season remains a prime opportunity to remind or educate advisors on the tax efficiency of ETFs compared to mutual funds.
Mutual funds and ETFs exist in the same regulatory framework under the Investment Company Act of 1940 (“the 40 Act”) and must document all transactions made by portfolio managers throughout the year. However, mutual funds are required to distribute net profitable sales to shareholders by year-end, which can lead to a significant tax burden.
Conversely, most ETFs engage market makers to handle buys and sells when rebalancing or reconstituting, meaning no transactions occur within the ETF itself; this is known as a custom in-kind creation or redemption.
This means that ETFs may realize capital gains, but the effect of shareholder trading on these gains is less pronounced than in mutual funds. Mutual funds often need to sell portfolio securities to accommodate redemptions or asset reallocations, potentially triggering taxable events for all shareholders.
ETF managers, however, manage inflows and outflows through the in-kind creation and redemption process, which potentially minimizes tax implications. Because of how ETFs manage redemptions, integrating the Cap Gains Valet dataset with our comprehensive fund flow metrics can be particularly useful.
This combination allows asset managers to identify funds experiencing both significant outflows and large taxable distributions, effectively spotting those hit with the “double whammy” of high outflows and large tax bills.
Illustrate Your Fund’s Tax Efficiency and Competitive Edge
After using the Cap Gains Valet dataset to identify which funds you want to position your strategy against, the next step is leveraging YCharts’ robust suite of point-of-sale features, which are instrumental in winning AUM.
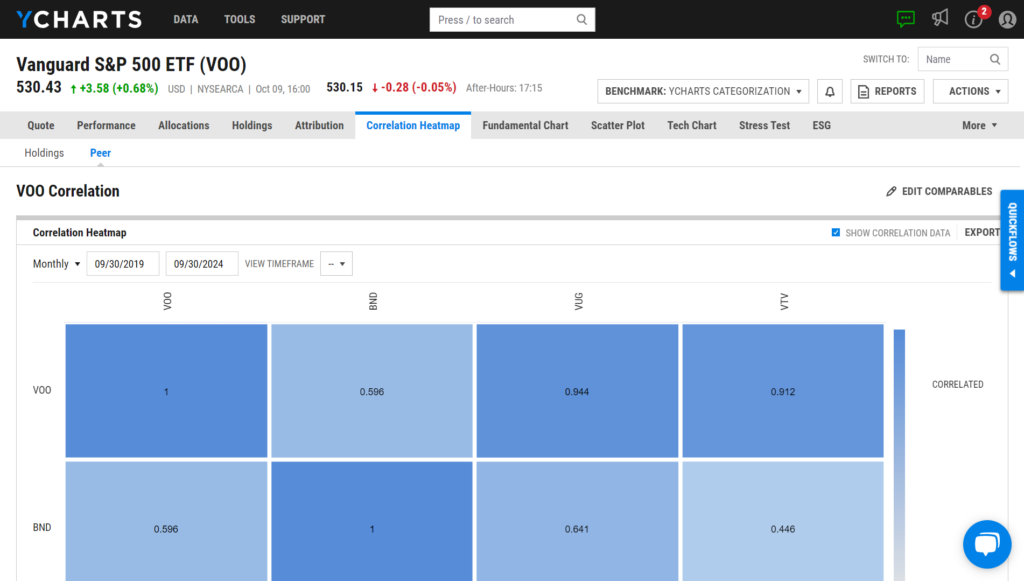
In evaluating the tech stack for a distribution team, it’s important not to underestimate the quote page— a common feature across many platforms. However, YCharts’ quote page stands out as exceptionally beneficial for illustrating your strategy’s superiority on the fly in a meeting with an advisor. A prime example of this is the Correlation Heatmap, which can show an advisor how your strategy enhances diversification or complements existing positions within their portfolio. Edited comparable securities will stay saved in the tool to jumpstart future comparisons and discussions.
Moreover, from a fund’s quote page, you can use one of our many comparison quickflows, like the “Performance Chart” or “Risk/Reward Scatter Plot,” to illustrate the positive impact adding your strategy to a portfolio can have.
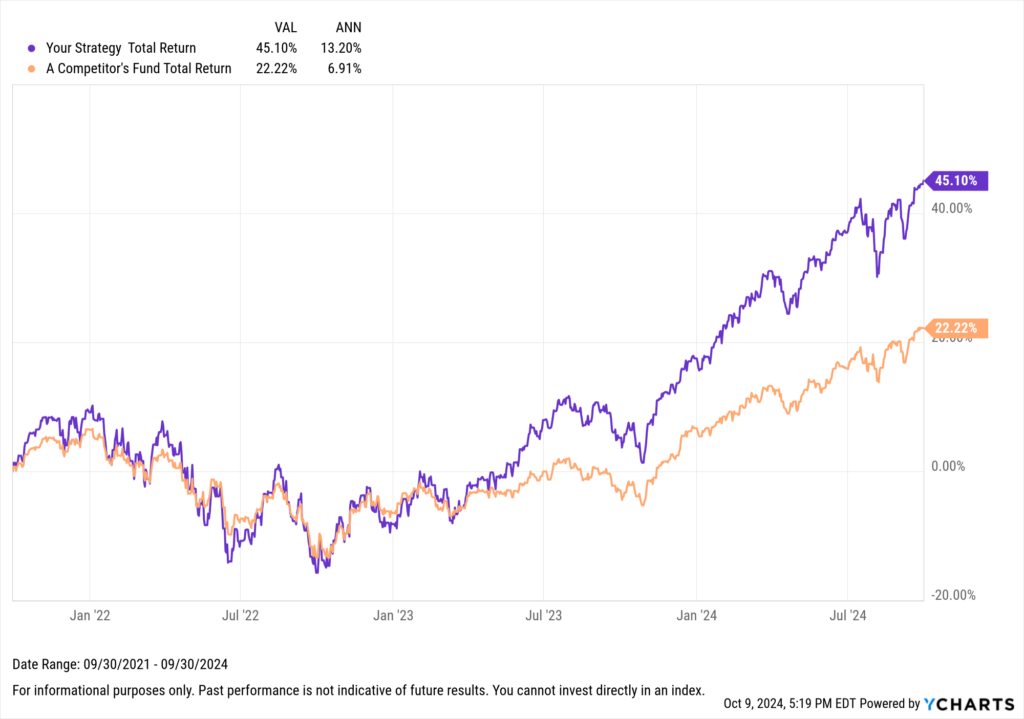
Compare Your Strategy to a Competitor
Aligning Sales Teams on Your Strategy’s Tax Efficiency
After building a visual or completing a capital gains analysis, use our shareable dashboards to align the distribution team on sales stories, organize competitor funds with high tax liabilities, and have fund comparisons against those strategies saved to minimize losing momentum in conversations with advisors.
Divisional and regional directors find dashboards incredibly valuable because they facilitate alignment among their teams. These dashboards can be shared following team or home-office meetings and can include comprehensive notes on high-tax cost funds, targeted firms, or links to internal lists detailing which product offerings are available at a specific firm. This ensures everyone is aligned on the strategy’s story and how to implement it in the field.
Directors and managers will appreciate the simplicity with which they can oversee their target addressable markets and analyze competitors. The capability to immediately review estimated capital gains distributions from competitors upon logging in enables leaders to quickly identify which competitors might soon face uncomfortable conversations with advisors and determine if you have a lower-cost or better-performing alternative.
By leveraging the Cap Gains Valet dataset in YCharts, you can proactively address potential capital gains tax liabilities and strategically position your offerings to attract or retain AUM. As the end of the year approaches, the ability to preemptively engage in capital gains conversations and educate advisors on the comparative tax advantages of your strategies can significantly impact advisor engagement and, ultimately, drive AUM growth.
Whenever you’re ready, there are 3 ways YCharts can help you:
1. Looking to get deeper insights into how capital gains will impact your competitors this year?
Send us an email at hello@ycharts.com or call (866) 965-7552. You’ll be directly in touch with one of our Chicago-based team members.
2. Want to test out YCharts for free?
Start a no-risk 7-Day Free Trial.
3. Get the Cap Gains Valet dataset added to your YCharts account:
Reach Out to Add Cap Gains Metrics to Your AccountDisclaimer
©2024 YCharts, Inc. All Rights Reserved. YCharts, Inc. (“YCharts”) is not registered with the U.S. Securities and Exchange Commission (or with the securities regulatory authority or body of any state or any other jurisdiction) as an investment adviser, broker-dealer or in any other capacity, and does not purport to provide investment advice or make investment recommendations. This report has been generated through application of the analytical tools and data provided through ycharts.com and is intended solely to assist you or your investment or other adviser(s) in conducting investment research. You should not construe this report as an offer to buy or sell, as a solicitation of an offer to buy or sell, or as a recommendation to buy, sell, hold or trade, any security or other financial instrument. For further information regarding your use of this report, please go to: ycharts.com/about/disclosure
Next Article
Monthly Market Wrap: September 2024Read More →