Understanding Economic Indicators with YCharts: A Beginner’s Guide

Introduction
Economic indicators play a critical role in shaping investment decisions and financial strategies. They help financial professionals make sense of market trends, forecast economic changes, and offer clients well-informed guidance. Whether you’re a seasoned advisor or just starting, understanding how to navigate economic data is essential.
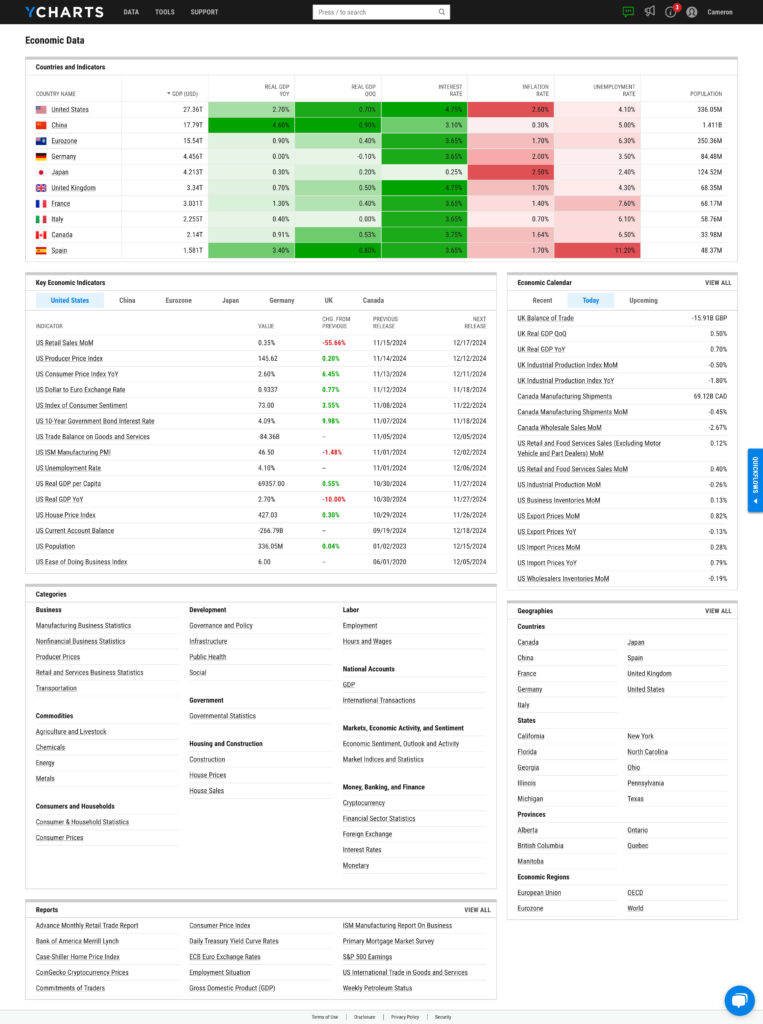
In this guide, we’ll walk you through how YCharts provides access to a vast array of economic indicators and helps you turn raw data into actionable insights. With YCharts, you can dive into 500,000+ global economic data points and create visuals that elevate your brand and enhance your client communications.
Key Features of Economic Data on YCharts
YCharts offers a comprehensive set of tools and data for financial professionals looking to make sense of complex economic trends. Here are some key features to help you get started:
1. Access to Reliable Economic Data

YCharts aggregates economic data from top institutions such as the ADP, Federal Reserve, ISM Chicago, and other reputable sources. This ensures that you have the most reliable data at your fingertips, whether you’re tracking inflation rates, unemployment figures, or GDP growth.
What to Look For:
- Federal Reserve data (interest rates, monetary policy)
- Employment reports from Bureau of Labor Statistics (jobless claims, labor force participation)
- Consumer price indices, GDP reports, and more from trusted sources
Why It Matters: Reliable data is the foundation for informed investment strategies. Having access to high-quality, trustworthy data ensures you’re making decisions based on accurate insights.
2. Visualizing Economic Trends

Download Visual | Modify in YCharts
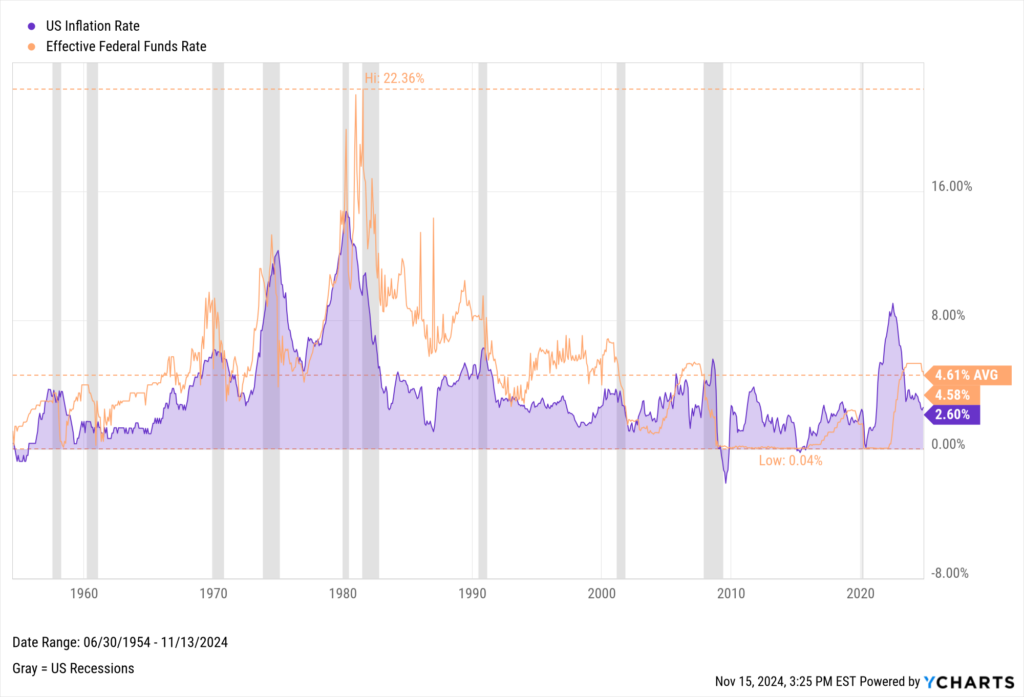
Numbers tell a story, but a well-crafted chart can turn those numbers into a compelling narrative. YCharts allows you to visualize economic data in customizable charts and graphs, helping you (and your clients) better understand the trends.
What to Look For:
- Fundamental Charts for visualizing trends across economic indicators.
- Custom branding options that allow you to include your firm’s logo on every chart, making client presentations more professional.
- Comparison Table tools for comparing economic indicators side-by-side.
Why It Matters: Clear visuals make complex data accessible. They help your clients quickly understand economic trends, which builds trust and enhances client engagement.
3. Customizable Economic Calendars

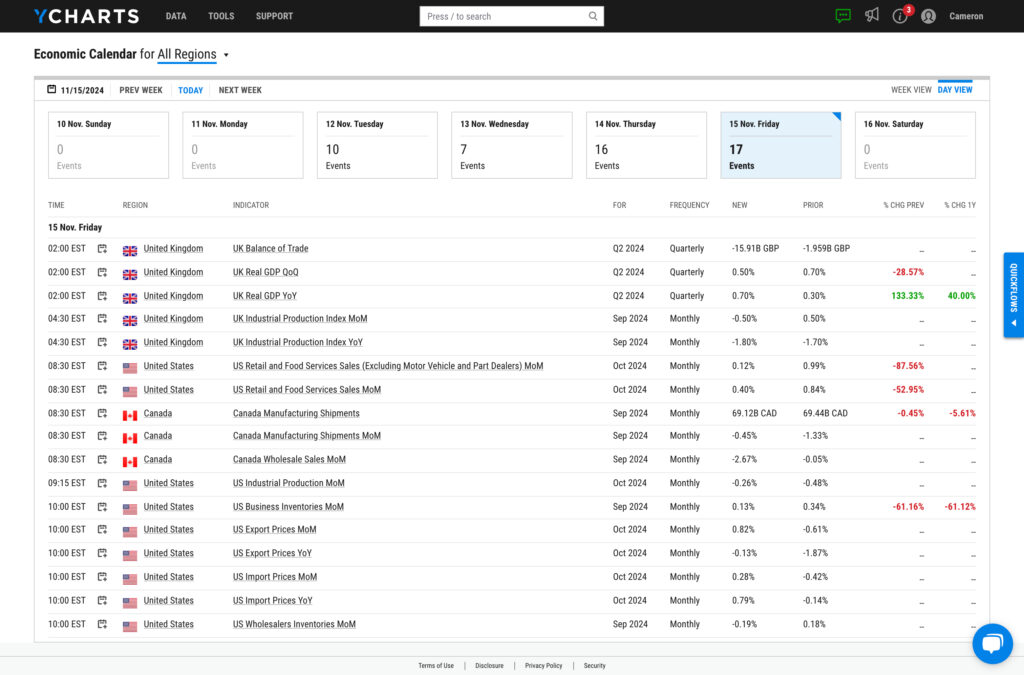
YCharts offers a sortable economic calendar to keep you informed of upcoming data releases. You can filter by topic, source, or country, ensuring you stay on top of critical events like Federal Reserve meetings, inflation reports, or global market shifts.
What to Look For:
- Filter options to track events based on country, topic, or source.
- Alerts for upcoming events like GDP announcements or central bank decisions.
Why It Matters: Staying informed of key economic events ensures that you can react quickly to new data, helping you make timely decisions for your clients.
Exploring Key Economic Indicators with YCharts
When it comes to understanding the economy, a few key indicators carry significant weight. YCharts offers access to thousands of data points, but some of the most impactful include:

Download Visual | Modify in YCharts
1. Gross Domestic Product (GDP)
GDP measures the total value of goods and services produced by a country. It’s a critical indicator of economic health and growth.
- YCharts Feature: Use YCharts to track both U.S. and global GDP data over time. Visualize historical trends or compare GDP growth across multiple countries.
2. Inflation (CPI)
The Consumer Price Index (CPI) is a leading measure of inflation. It tracks changes in the price level of a basket of consumer goods and services.
- YCharts Feature: Analyze historical CPI data and track inflation trends using YCharts’ Fundamental Charts. This can help in understanding purchasing power and the cost of living.
3. Unemployment Rate
The unemployment rate gives insight into labor market conditions, showing the percentage of the labor force currently without a job.
- YCharts Feature: Access unemployment data from the Bureau of Labor Statistics through YCharts to gauge the economic stability of a region.
4. Interest Rates
Interest rates, especially benchmark lending rates set by central banks like the Federal Reserve, affect borrowing costs, investment decisions, and overall economic activity.
- YCharts Feature: Track changes in interest rates over time and visualize their impact on broader economic trends, such as inflation and market performance.
How YCharts Helps You Analyze and Present Economic Data
YCharts isn’t just about accessing data—it’s about transforming that data into powerful insights and communications that help you grow your business.

1. Create Compelling Reports
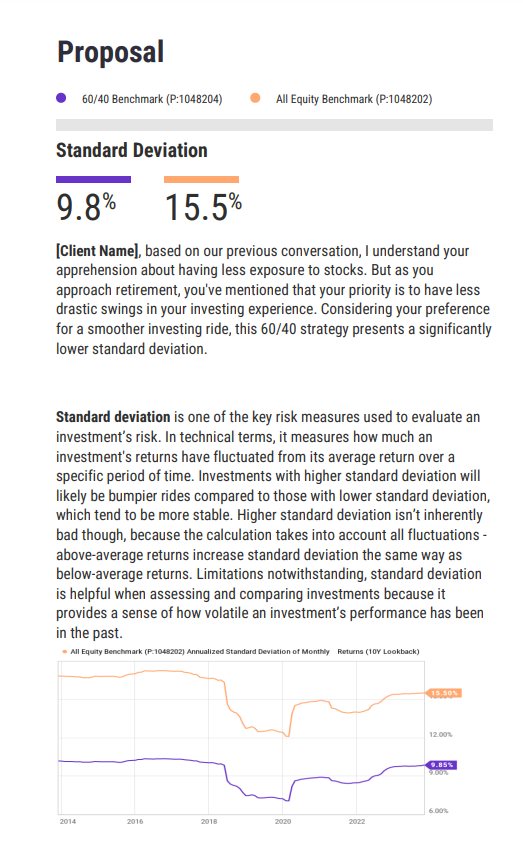
With YCharts, you can generate branded, professional reports for clients that include charts, economic trends, and actionable insights. YCharts’ report-generation tools make it easy to combine multiple data points and illustrative visuals into a single, printable document. YCharts reports are useful for stress-testing portfolios against different economic scenarios, showing progress towards investment goals, or comparing market and portfolio performance against economic indicators.
2. Engage Clients with Visuals
Sifting through economic data can be overwhelming, but YCharts helps financial professionals engage clients by transforming raw data into easily digestible charts and graphs. These visuals improve client understanding and make complex economic trends clear, such as what happens to stocks and bonds when inflation and the Fed Funds Rate rise.
3. YCharts Economic Data in Action
Let’s say a client is concerned about the impact of rising inflation on their investments. With YCharts, you can quickly pull inflation data, visualize recent and historical trends, and compare it to other economic factors like interest rates and GDP. You can then present this analysis alongside a client portfolio or model strategy in a visually appealing, branded report that clearly illustrates advice you might offer on how to adjust their portfolio.
Why Understanding Economic Indicators is Essential for Financial Advisors
Economic indicators provide crucial insights into market trends and the broader economy, making them a valuable tool for advisors. Here’s why it’s critical to stay informed:
- Informed Decision-Making: Understanding how economic factors impact the market helps you make better investment decisions for your clients.
- Client Confidence: Educating clients about economic conditions allows them to become more informed about the investment decisions you’re making and builds trust in your advisory services.
- Risk Management: By keeping an eye on key economic indicators, you can anticipate risks and adjust portfolios to better manage volatility.
Conclusion
YCharts offers financial professionals the tools they need to stay on top of global economic trends, with over 500,000 economic indicators available at their fingertips. From analyzing key economic data to creating striking visuals that tell compelling stories about that data, YCharts simplifies the process, empowering you to provide better client insights and make informed decisions.
Whether you’re just beginning your journey in financial advising or looking to refine your existing strategy, YCharts equips you with the tools to succeed in understanding and leveraging economic data.
Whenever you’re ready, there are 3 ways YCharts can help you:
1. Looking to better communicate the importance of economic events to clients?
Send us an email at hello@ycharts.com or call (866) 965-7552. You’ll be directly in touch with one of our Chicago-based team members.
2. Want to test out YCharts for free?
Start a no-risk 7-Day Free Trial.
3. Download a copy of the Quarterly Economic Update slide deck:
Download the Economic Summary Deck:Disclaimer
©2024 YCharts, Inc. All Rights Reserved. YCharts, Inc. (“YCharts”) is not registered with the U.S. Securities and Exchange Commission (or with the securities regulatory authority or body of any state or any other jurisdiction) as an investment adviser, broker-dealer or in any other capacity, and does not purport to provide investment advice or make investment recommendations. This report has been generated through application of the analytical tools and data provided through ycharts.com and is intended solely to assist you or your investment or other adviser(s) in conducting investment research. You should not construe this report as an offer to buy or sell, as a solicitation of an offer to buy or sell, or as a recommendation to buy, sell, hold or trade, any security or other financial instrument. For further information regarding your use of this report, please go to: ycharts.com/about/disclosure
Next Article
US Retail Sales Monthly UpdateRead More →
