These 5 Equity Income ETFs are Winning Assets in 2024

Equity-income ETFs, often dubbed “dividend ETFs” for their focus on income-driven capital appreciation, have attracted $13.9 billion in 2024, including $4.8 billion in new assets in October alone (as of October 31, 2024).
This trend highlights a year-long shift towards more dynamic investment strategies, with equity income ETFs accounting for nearly 5% of the $123.9 billion allocated to active equity ETFs in 2024, as of October 31, 2024.
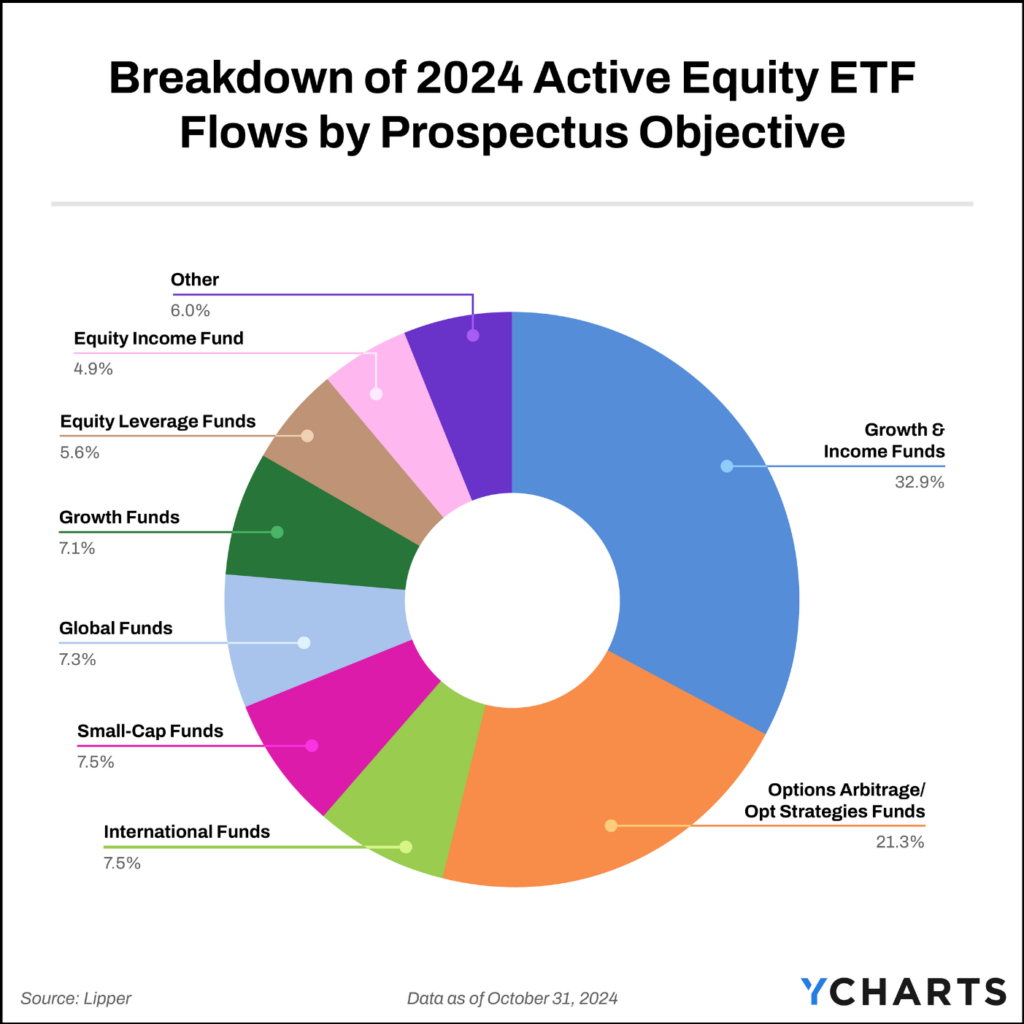
Although they haven’t matched the dominance of option-based strategies–which have secured over 20% of new active equity ETF assets–the steady growth of equity income ETFs is noteworthy. And the trend of advisors exploring non-passive strategies isn’t showing signs of slowing.
According to the Money Management Institute’s 2024 Advisory Pulse Survey, 89% of wealth managers intend to boost their allocations to active ETFs in the next two years, underscoring the interest in more dynamic investment approaches.

Equity income strategies, in particular, present several appealing attributes for advisors. Notably, when portfolio managers successfully avoid “dividend or value traps,” there is a stronger likelihood that the selected stocks are of higher quality. This assumption is based on the requirement that these companies generate sufficient free cash flow to distribute, sustain, and preferably increase their dividend.
Equity-income strategies may also provide an opportunity to diversify portfolios away from the tech-heavy makeup of major indices. The five ETFs below have an average tech sector exposure of 14.5% and 5% for communication services, significantly lower than the S&P 500’s 33.1% and 8.9%, respectively (represented by SPY).

Download Visual | View & Modify Comp Table in YCharts
While they may not be as well-named as the so-called ‘Boomer candy’ defined outcome ETFs, equity income strategies are also attractive options for financial advisors guiding clients approaching retirement. These advisors might need to continually stress the importance of maintaining equity exposure.
Many clients may believe they need to move their investments to bonds or other fixed-income assets to lessen the volatility associated with equities. However shifting prematurely can increase the risk that they will deplete their savings prematurely.
Additionally, the current favorability of equity income strategies is likely attributed to macroeconomic shifts, such as the Federal Reserve’s recent rate cuts.
These equity income-focused strategies typically offer minimal interest rate risk compared to bond-based income strategies, which is likely why they’ve added $9.2 billion in assets over the last three months, coinciding with the Fed’s dovish regime.
To better understand which equity-income ETFs are drawing significant investor interest, we analyzed the three fastest-growing ETFs based on dollar growth. Additionally, we explored a couple of strategies that stand out when you measure the ETF’s flows relative to its AUM.
Jump to a section
Three Fastest-Growing Equity Income ETFs in 2024
The three ETFs featured in this section are the fastest-growing strategies with an equity income prospectus objective by dollar amount, having collectively attracted nearly $11.7 billion in net new assets in 2024 (as of October 31, 2024).
CGDV
The Capital Group Dividend Value ETF (CGDV) was part of Capital Group’s initial suite of ETFs that rolled out over two years ago. CGDV is quickly approaching its three-year anniversary, and it already boasts over $11.8 billion in AUM, with over $4.5 billion in net inflows so far in 2024 and $511 million in new assets coming in October.
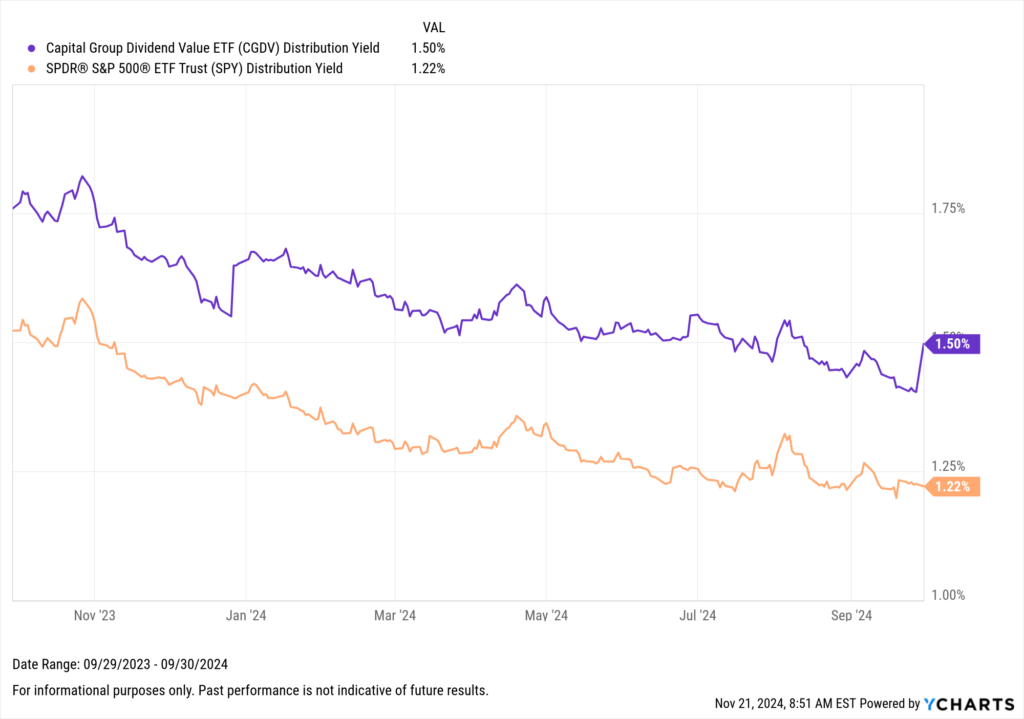
An active approach to stock picking defines the strategy. According to the fund’s prospectus, it has a north star of producing yield potential that surpasses that of the S&P 500. From the end of Q3 2023 to the close of Q3 2024, the strategy has accomplished that goal, producing a 1.5% distribution yield compared to a 1.22% distribution yield for SPY, a standard benchmark ETF for the S&P 500.
Download Visual | Modify in YCharts
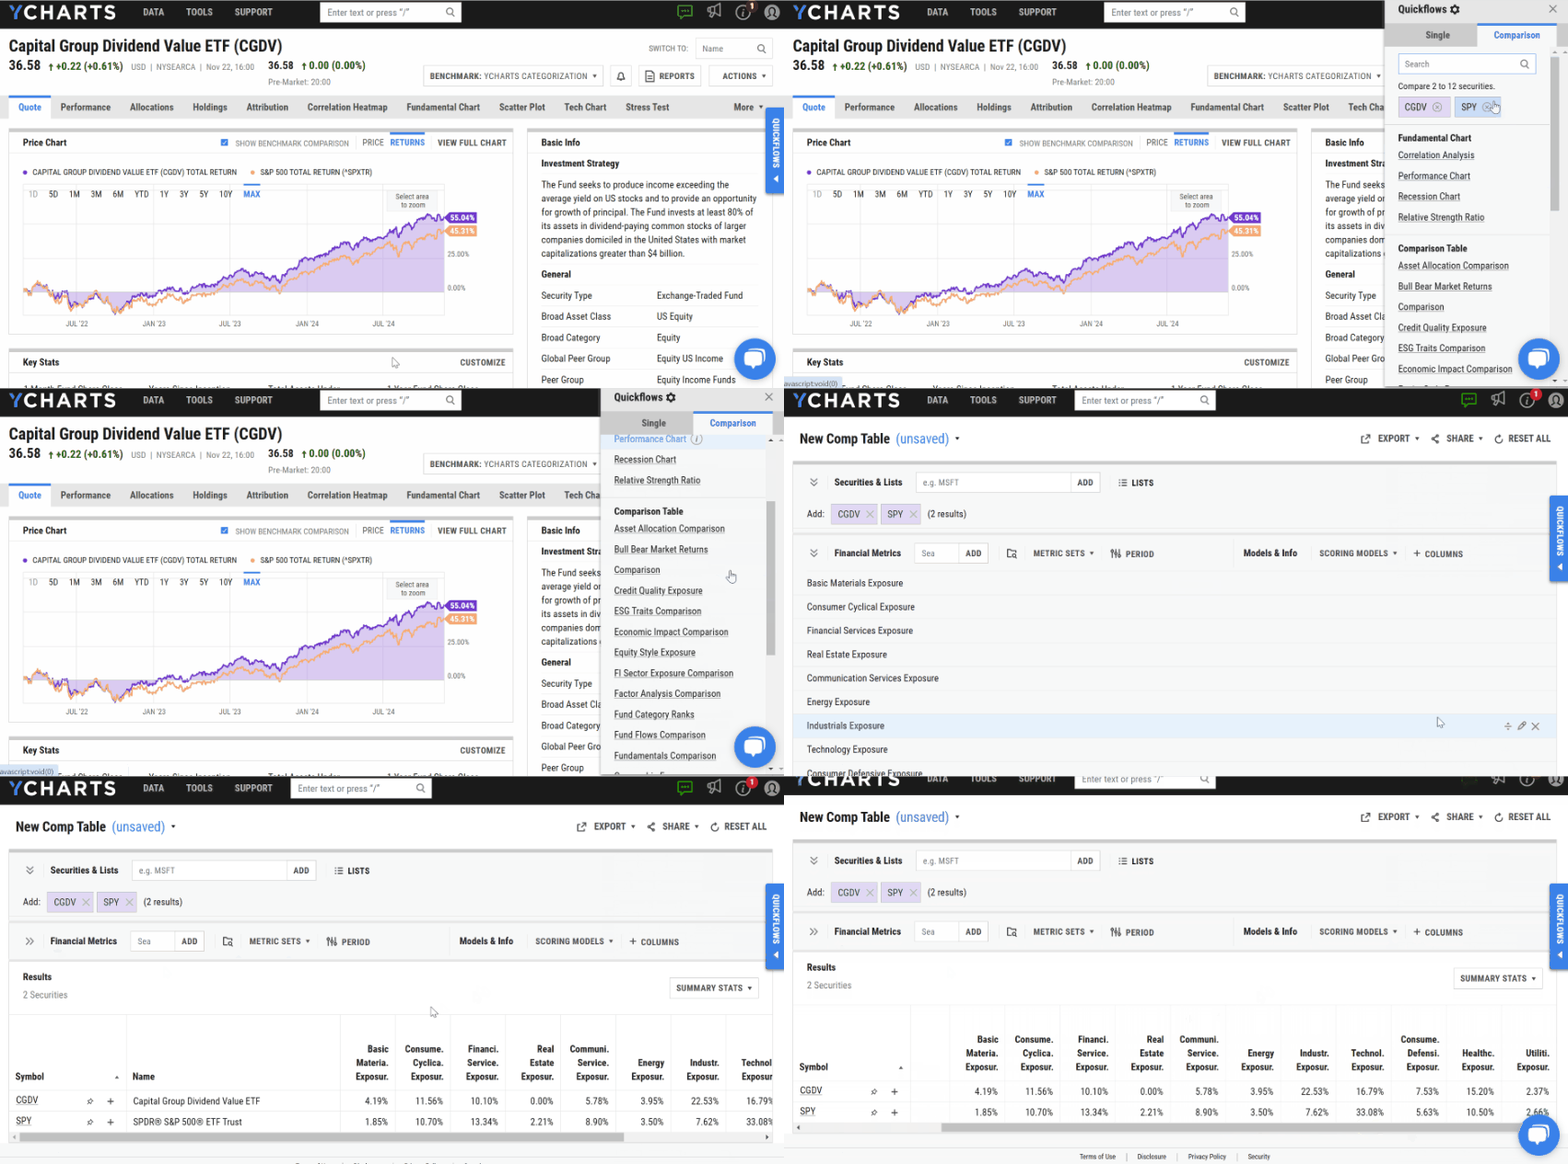
To achieve this goal, CGDV is far less exposed to the technology and communication services sectors and instead has a 22.5% exposure to industrial names. In contrast, the S&P 500 only has a 7.6% exposure to the sector.
View the Comp Table in YCharts
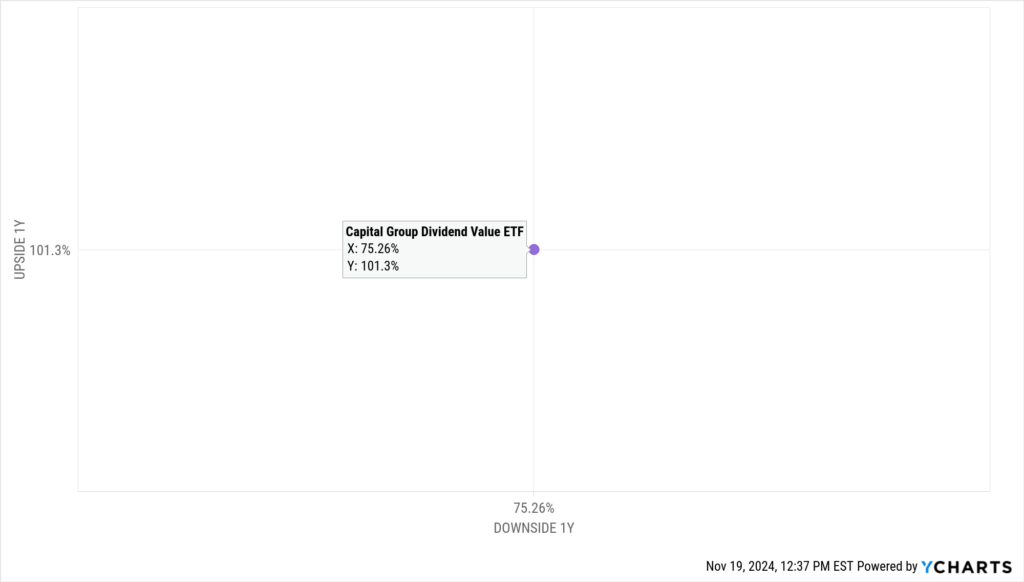
The active approach and differentiated holdings in the strategy has led to the fund capturing 101.3% of the S&P’s upside and just 75.3% of the market’s downside over the last year.
Add & Compare Strategies on the Scatter Plot
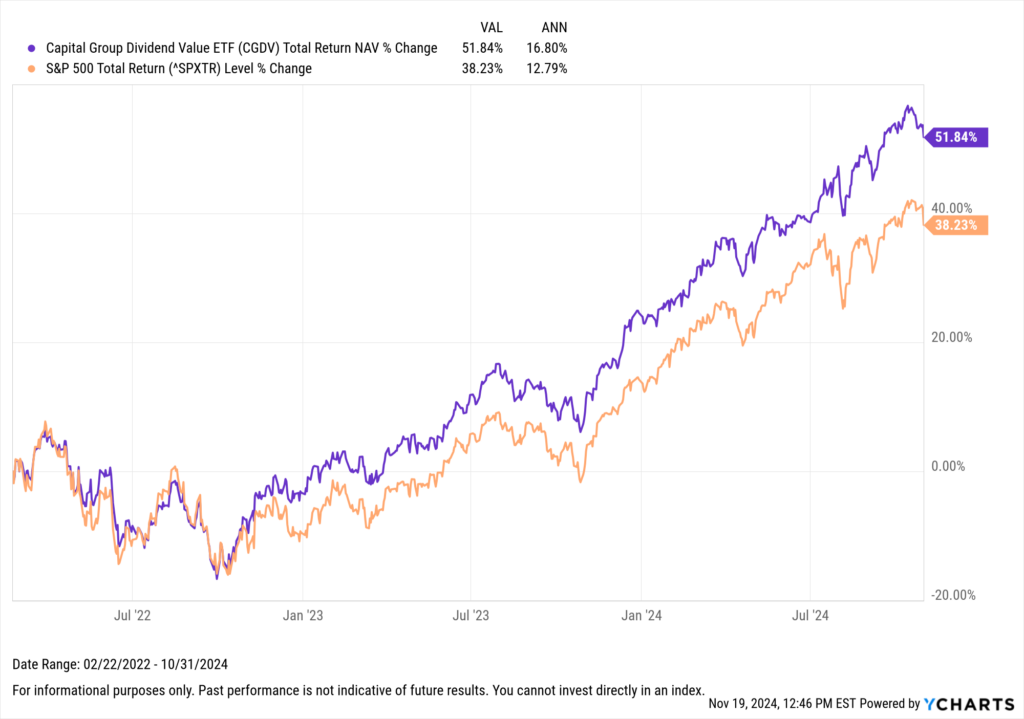
Since its inception, the strategy has outperformed the S&P 500 on a total return NAV basis, producing 16.8% annualized returns to the S&P 500’s 12.8% as of October 31, 2024.
Download Visual | Modify in YCharts
SCHD
Likely the most well-known strategy in the group, the Schwab US Dividend Equity ETF™ (SCHD) has attracted $3.9 billion so far in 2024, including $1.8 billion in October.
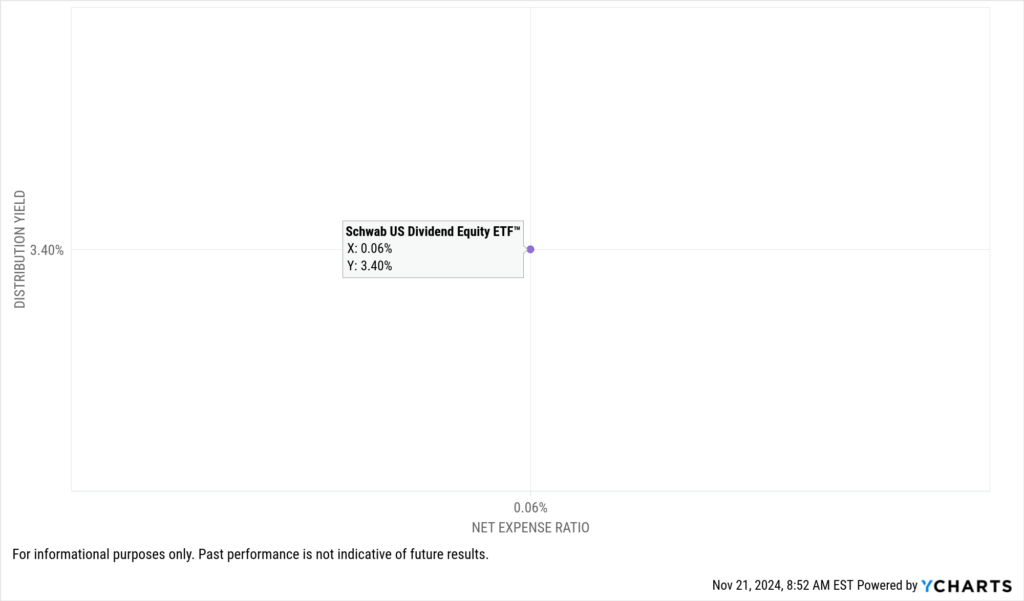
With over $65 billion in assets, investors have flocked to the strategy due to its low cost and elevated income potential. As an index-tracking strategy (i.e., passive), it boasts a 0.06% net expense ratio while simultaneously carrying a 3.4% distribution yield.
Add & Compare Strategies on the Scatter Plot
SCHD tracks the Dow Jones U.S. Dividend 100 Index, which, according to the index methodology, narrows down the Dow Jones U.S. Broad Stock Market Index (excluding REITs) based on stocks with a ten-year track record of paying dividends and other liquidity requirements.
From that universe, constituents are ranked based on fundamentals such as free cash flow to total debt, return on equity (ROE), indicated annual dividend yield, and five-year dividend growth. The top 100 securities with the highest composite scores are ultimately the final constituents in the index.
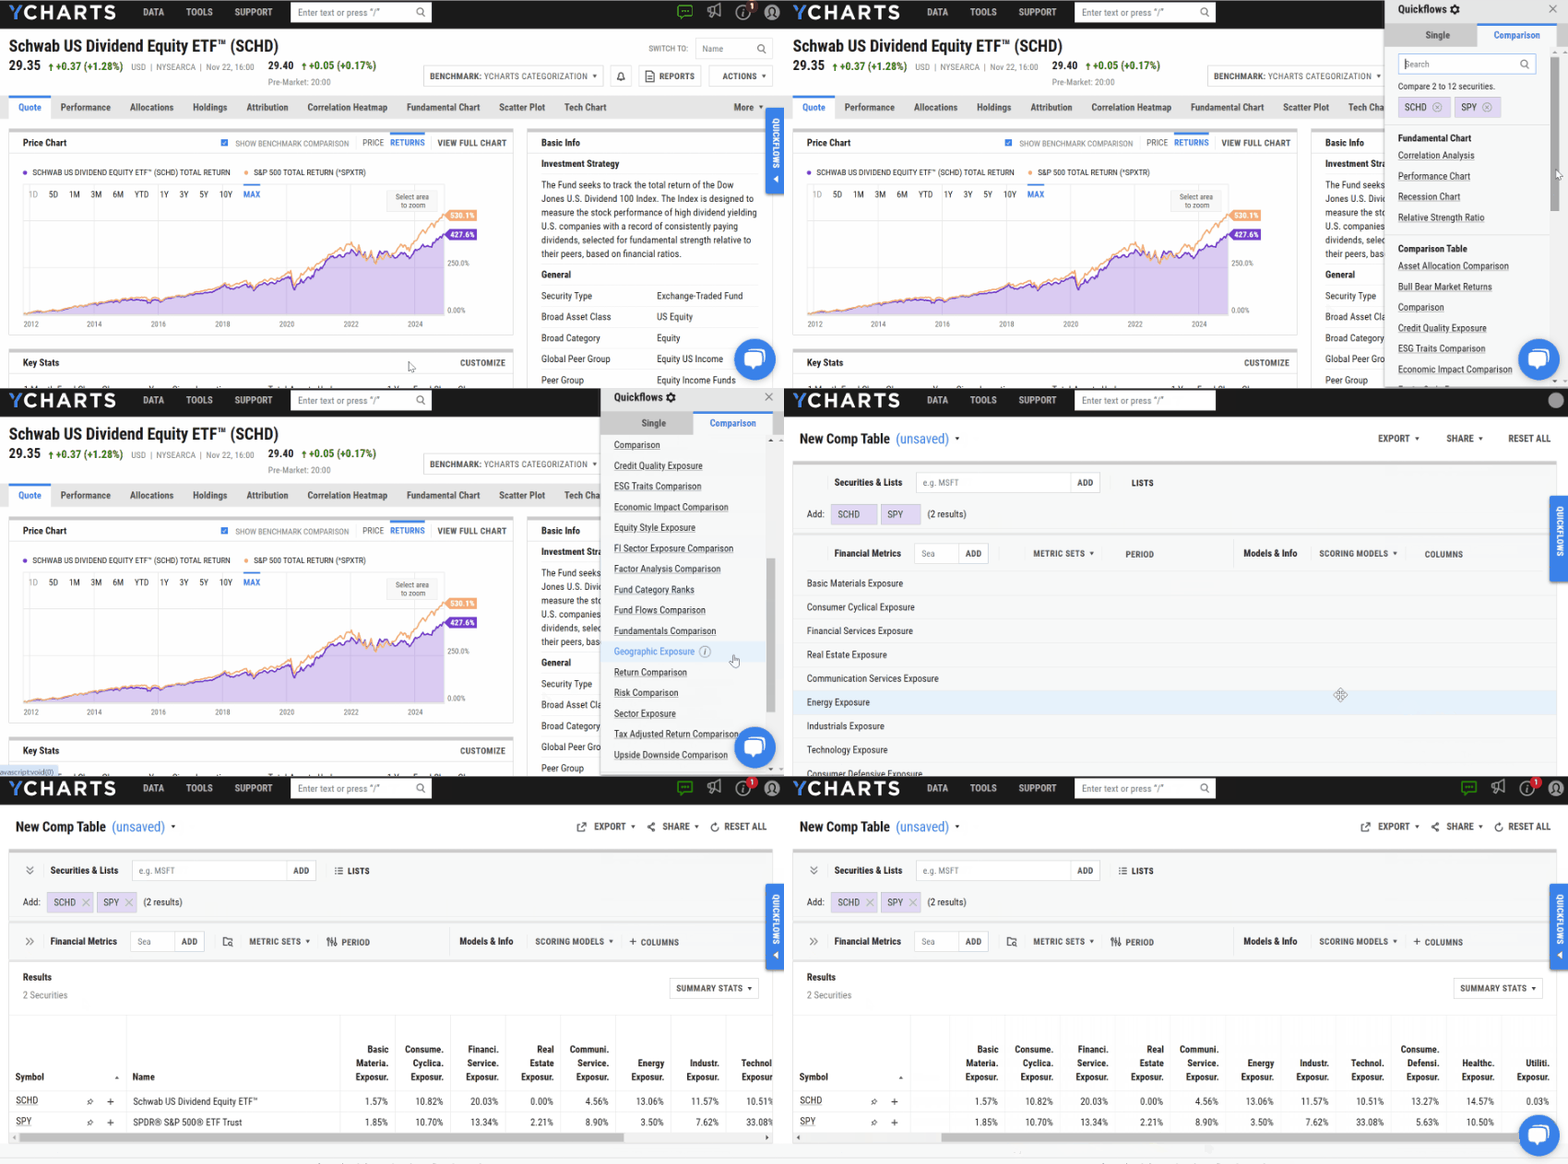
This methodology has led SCHD to have a significantly different composition than the S&P 500, with a nearly 20% exposure to financial services compared to the S&P’s 13.3% and only a 10.7% exposure to the tech sector compared to the S&P’s 33.1%.
View the Comp Table in YCharts
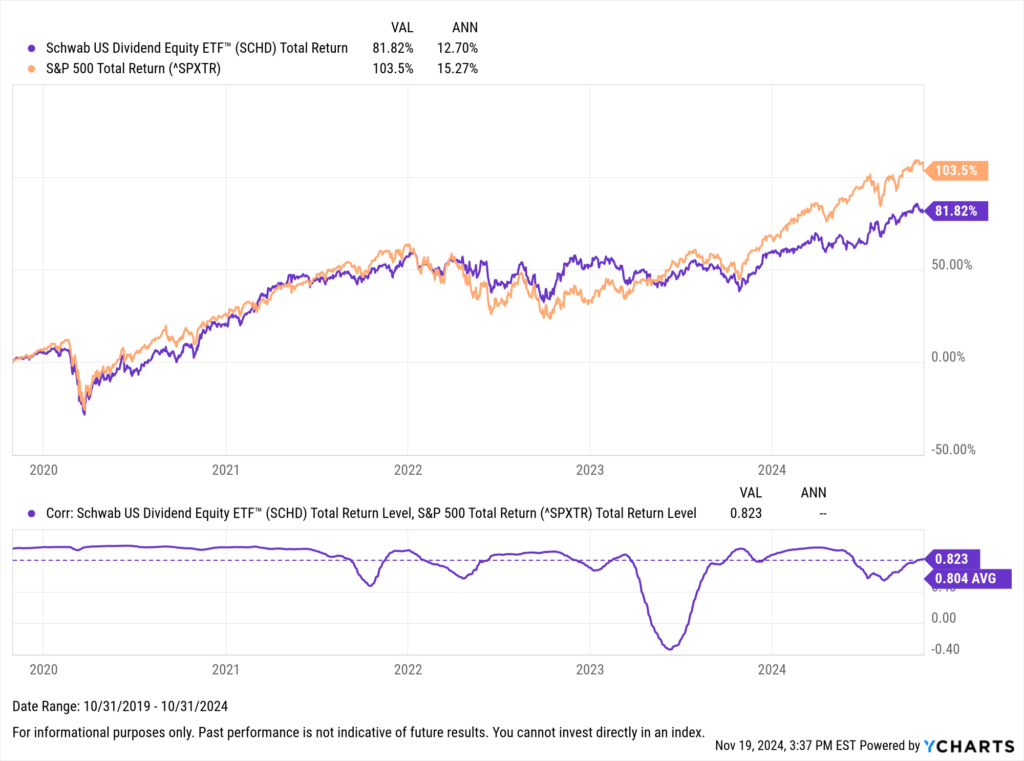
The reduced technology allocation in SCHD has contributed to its underperformance relative to the S&P 500 over the past five years. However, this underweight position in technology proved advantageous during the 2022 market downturn, allowing SCHD to outperform the broader index.
Furthermore, with a 0.8 average correlation to the S&P 500 from October 31, 2019, to October 31, 2024, and the potential sector diversification benefits, SCHD likely becomes a compelling choice either as a satellite position or as a core holding for more income-focused investors.
Download Visual | Modify in YCharts
SDVY
The First Trust SMID Cap Rising Dividend Achievers ETF (SDVY) is the only fund featured in the top three of screened strategies in terms of total inflows and inflows relative to its AUM.
SDVY has attracted $3.4 billion so far in 2024, which accounts for 53.3% of its AUM as of October 31, 2024. Its popularity among investors can be attributed to its income potential, diversification benefits, and strong total return track record.
SDVY specifically targets small- and mid-cap dividend growers, as defined by the index it tracks. Consequently, the strategy offers a higher distribution yield than benchmarks like the Russell 2000 and Russell Midcap, represented by IWM and IWR, respectively.
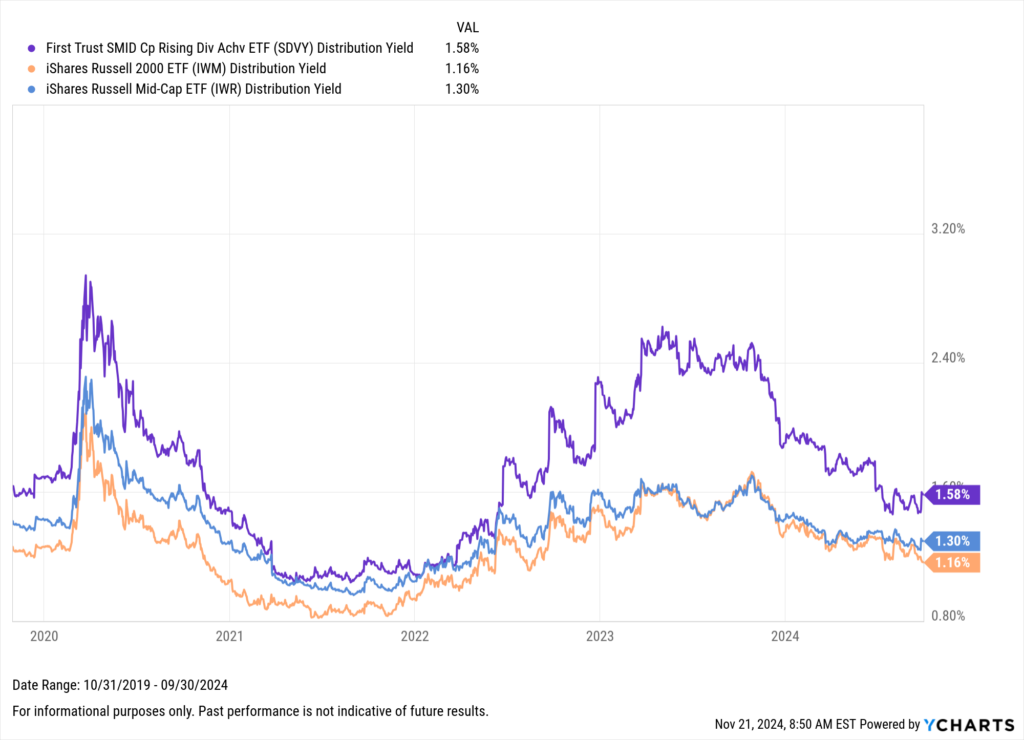
Download Visual | Modify in YCharts
Some advisors prefer passive strategies that track the S&P 600 over the Russell 2000 when it comes to small-cap indices. The former contains an earnings screen, which means companies must demonstrate a positive earnings track record before inclusion. This screen aims to create a higher-quality index.
Whether advisors use S&P or Russell-based index funds for their core SMID allocations, SDVY distinguishes itself through its unique sector allocation.
Presently, SDVY is more heavily weighted towards the financial services and energy sectors than the Russell 2000, Russell Mid Cap, S&P 600 (represented by SPSM), and S&P 400 (represented by SPMD). Most notably, SDVY has a 0% allocation to healthcare; that’s in stark contrast to these indices, each of which currently has at least a 9% allocation to the sector.
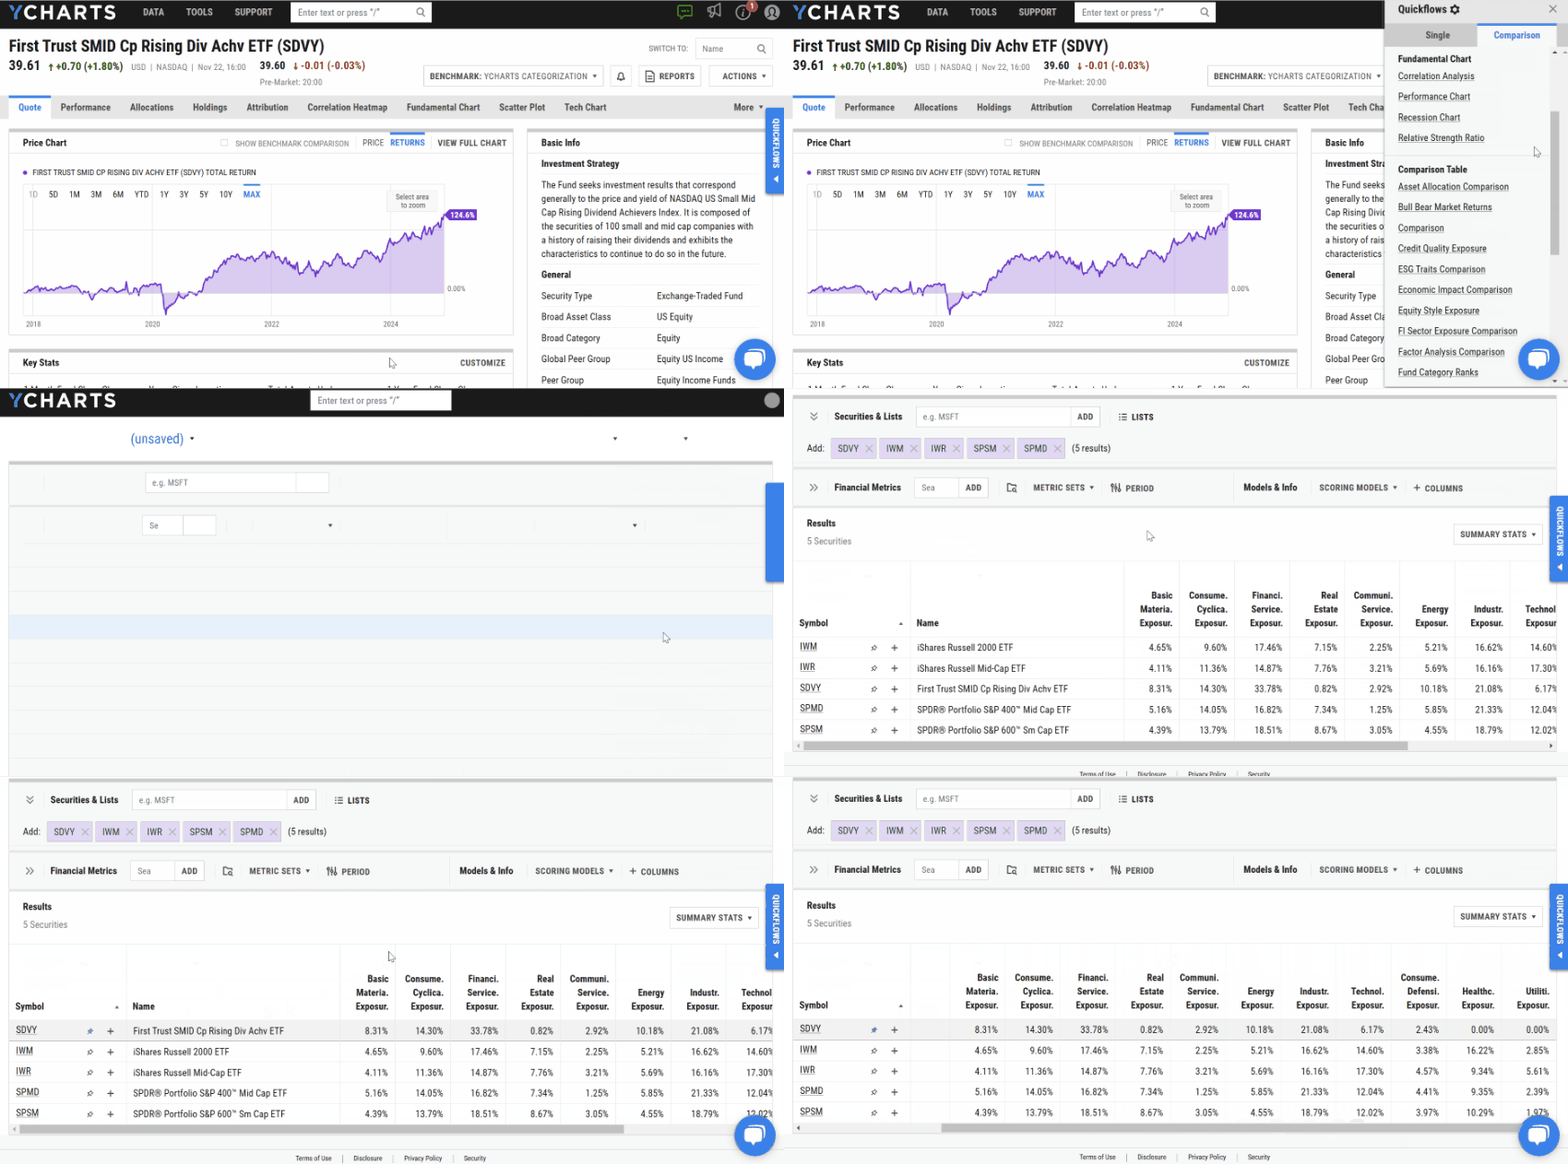
View the Comp Table in YCharts
This unique positioning and focus on dividend growers have driven SDVY’s performance, enabling it to outperform all four indices over the past five years.
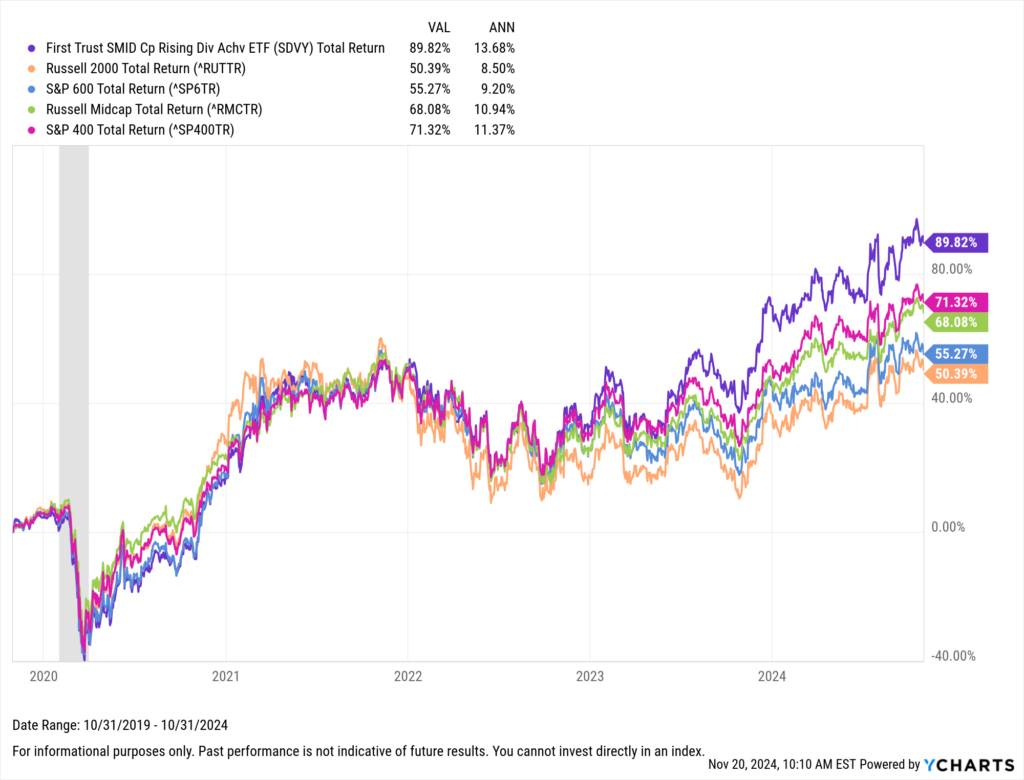
Download Visual | Modify in YCharts
Equity Income ETFs with Substantial Flows Relative to AUM
The equity income ETFs featured in this section have garnered substantial inflows relative to each strategy’s AUM as of the end of October. Funds needed at least a one-year track record and $100 million in AUM to qualify.
These strategies have amassed nearly $3.8 billion in net new assets in 2024, with SDVY (detailed above) contributing the majority. On average, the new assets in these strategies represented 61.25% of their total AUM as of October 31, 2024.
SDVD
The FT Vest SMID Rising Dividend Achievers Target Income ETF (SDVD) has reeled in over $117 million in 2024, representing 76.6% of its AUM as of October 31, 2024.
SDVD is a cousin to SDVY in many ways, as both primarily invest in small- and mid-cap dividend growers. However, SDVD aims to further enhance clients’ income potential by employing a buy-write or covered call strategy on the Russell 2000 Index or ETFs that track it.
By implementing this covered call strategy, SDVD aims to achieve a targeted annual income yield that significantly exceeds the current annual dividend yield of the Russell 2000 Index.
According to the fund’s prospectus, the target is to surpass the Russell 2000’s yield by approximately 8%, which was 1.54% in 2023. Currently, SDVD boasts a robust dividend yield of 7.95%, which is markedly higher than both SDVY and the Russell 2000 represented by IWM.
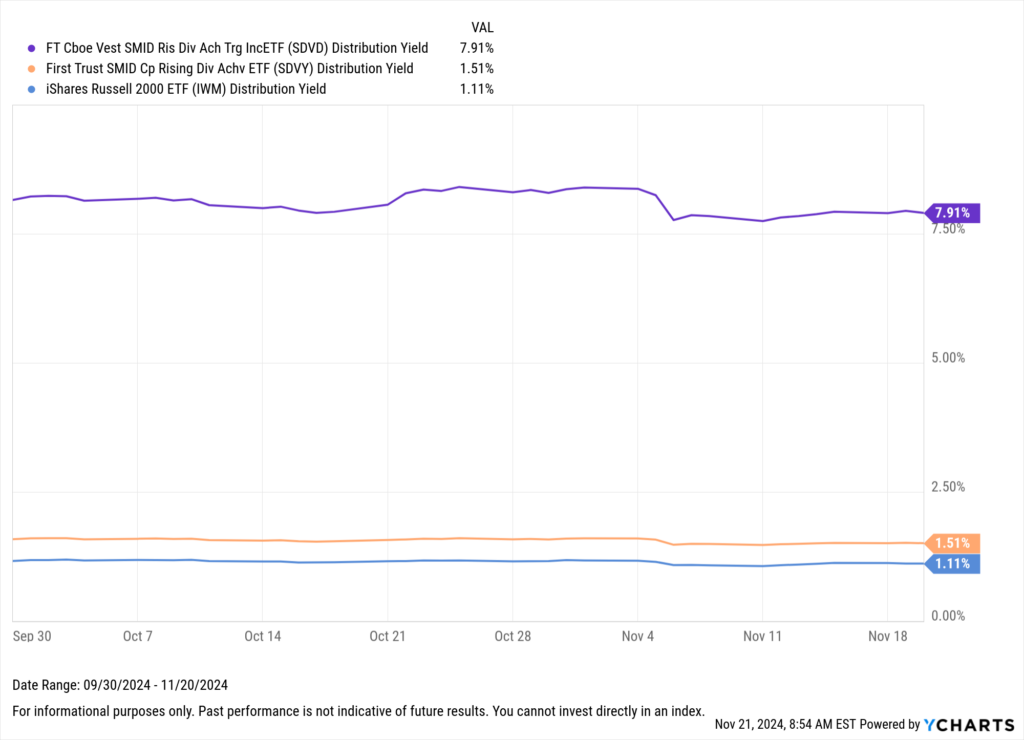
Download Visual | Modify in YCharts
SDVD aims to achieve its target yield by collecting premiums from the sold call options. These premiums are fees paid by buyers for the right to purchase the index or ETF at a predetermined price before the option expires. The short-term nature of these options, which typically last less than 30 days, allows SDVD to generate consistent income opportunities.
When the market does not exceed the options’ strike price, they expire worthless. SDVD retains the entire premium, which boosts the fund’s income potential without additional obligations. However, if the market rises and the options are exercised, the premiums collected help mitigate any potential negative impact.
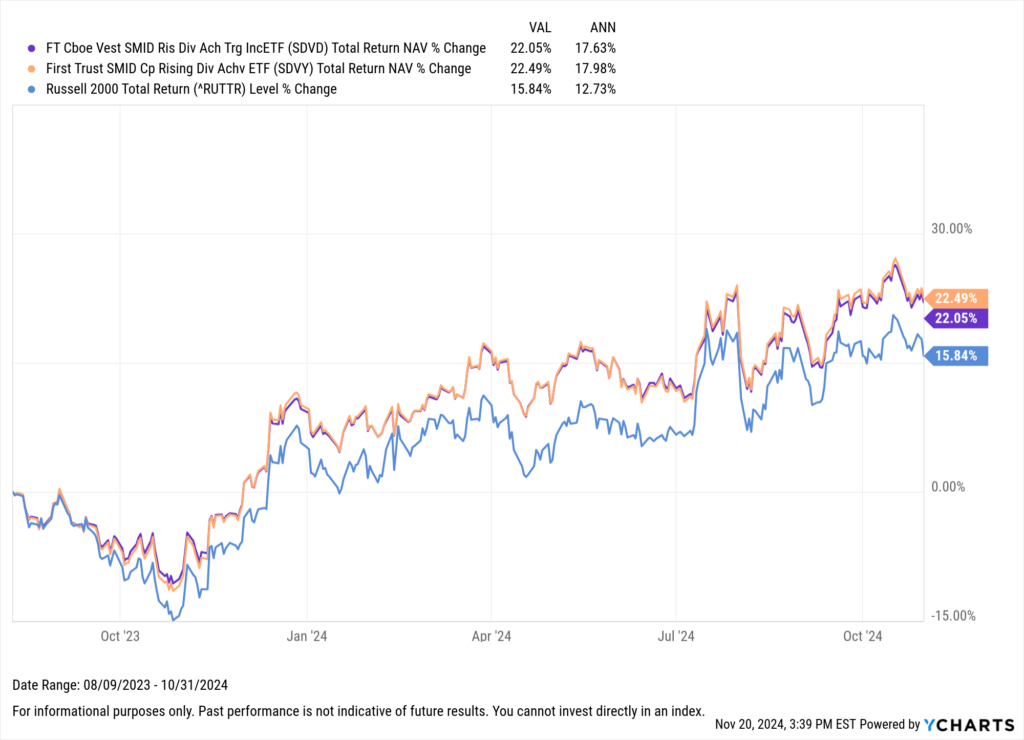
Since the fund’s inception on August 9th, 2023, the total returns of SDVD have kept pace with those of SDVY, and both have substantially outperformed the Russell 2000 on a total return basis, albeit using different methodologies to do so.
Download Visual | Modify in YCharts
QDPL
The Pacer Metaurus US Large Cap Dividend Multiplier 400 ETF (QDPL) has added $315 million so far in 2024, representing 53.3% of its AUM as of October 31, 2024. $115.2 million of the fund’s new assets this year came over the last three months, coinciding with the strategy’s third anniversary on July 12th.
According to its prospectus, QDPL’s approach to generating income potential is accomplished by “dividend multiplying.” In simplest terms, the strategy deconstructs the S&P 500’s total return into two competent parts: price appreciation and dividend reinvestment.
From there, the goal is to forgo some S&P 500 exposure in exchange for roughly four times the dividend of the S&P 500 by using dividend futures contracts.
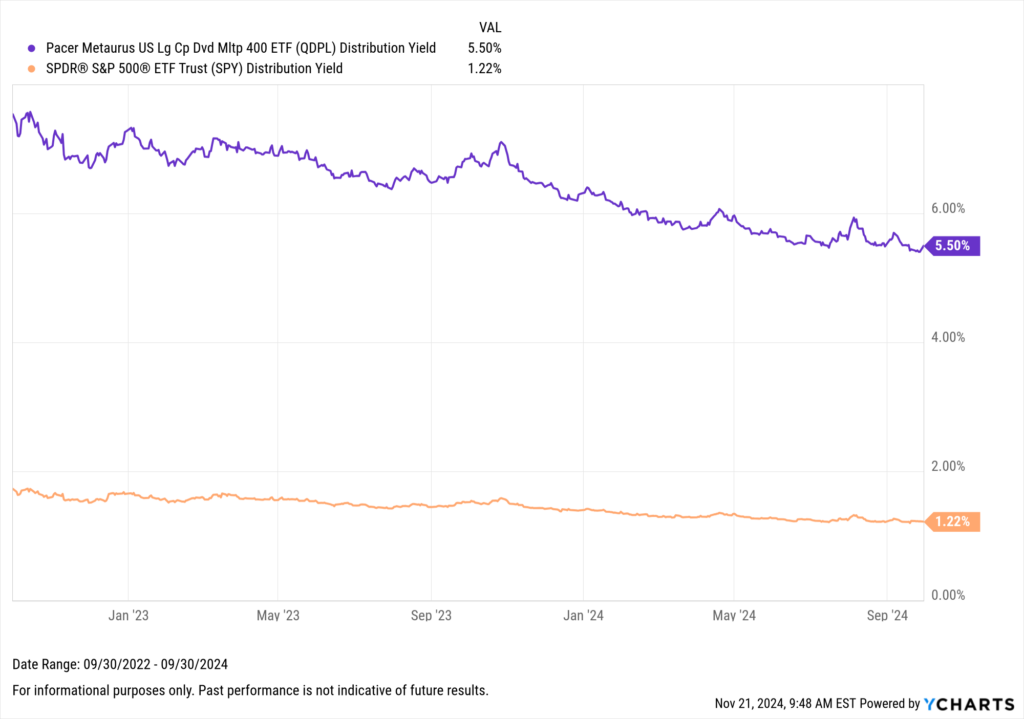
The strategy aims to provide an investor with approximately 90% S&P exposure in exchange for the enhanced yield potential. On the yield side, at the end of Q3 2024, QDPL had a TTM distribution yield of 5.5%, approximately 4.5 times SPY’s 1.22% distribution yield.
Download Visual | Modify in YCharts
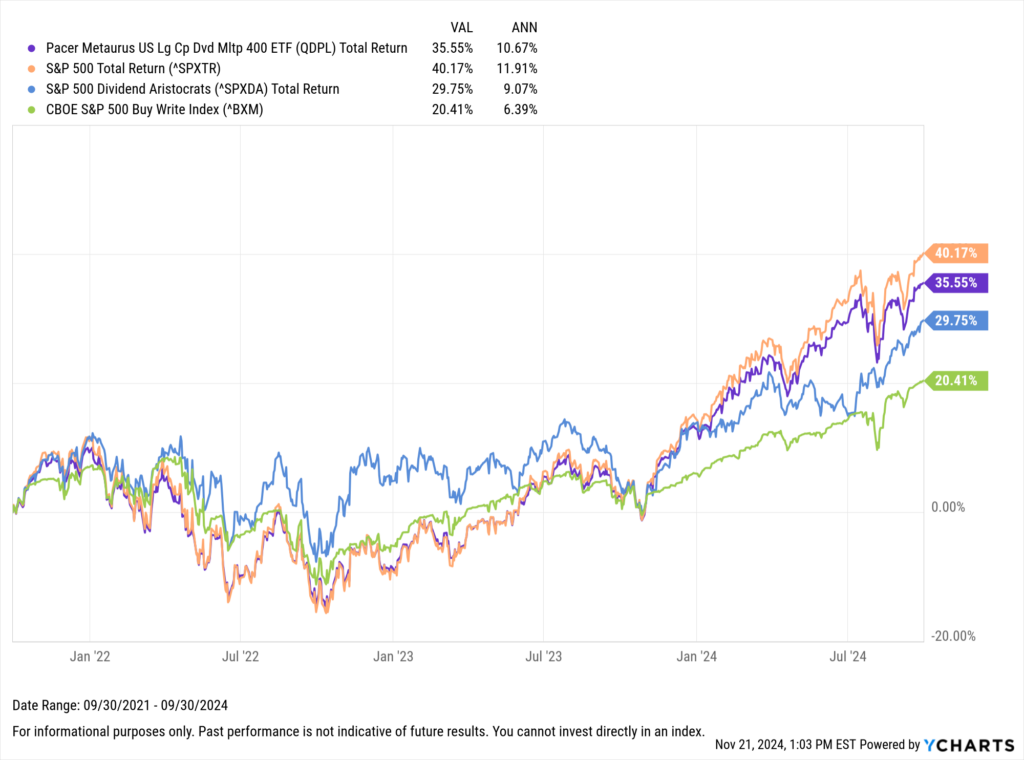
Due to the strategy’s defined tradeoffs, QDPL has underperformed the S&P 500 over the three years from September 30, 2021 to September 30, 2024.
However, compared to other prominent income-focused indices such as the S&P 500 Dividend Aristocrats Index and the CBOE S&P 500 Buy Write Index, QDPL has demonstrated superior total return performance.
This outperformance may be attributed to a less restrictive upside cap relative to a covered call strategy and a closer allocation alignment with the broader S&P 500 than a dividend growth strategy.
Download Visual | Modify in YCharts
In the face of a changing rate environment and a growing appetite for less “vanilla” ETFs, each of these equity income ETFs has carved a niche. And equity income ETFs in general, will likely continue to play a role in the ever-growing ETF marketplace.
For more detailed insights into fund flows, subscribe to YCharts’ Fund Flow Report.
Whenever you’re ready, there are three ways YCharts can help you:
Have questions about how YCharts can help you grow AUM and prepare for meetings?
Email us at hello@ycharts.com or call (866) 965-7552. You’ll get a response from one of our Chicago-based team members.
Unlock access to dynamic AUM-winning visuals by becoming a client.
Dive into YCharts with a no-obligation 7-Day Free Trial now.
Sign up for a copy of our Fund Flows Report and Visual Deck:
Disclaimer
©2024 YCharts, Inc. All Rights Reserved. YCharts, Inc. (“YCharts”) is not registered with the U.S. Securities and Exchange Commission (or with the securities regulatory authority or body of any state or any other jurisdiction) as an investment adviser, broker-dealer or in any other capacity, and does not purport to provide investment advice or make investment recommendations. This report has been generated through application of the analytical tools and data provided through ycharts.com and is intended solely to assist you or your investment or other adviser(s) in conducting investment research. You should not construe this report as an offer to buy or sell, as a solicitation of an offer to buy or sell, or as a recommendation to buy, sell, hold or trade, any security or other financial instrument. For further information regarding your use of this report, please go to: ycharts.com/about/disclosure
Next Article
US Existing Home Sales Monthly UpdateRead More →
