Best Performing Fixed Income ETFs of 2024: Total Returns, Income Potential & Volatility
Fixed-income ETFs gained significant traction among investors, with the Federal Reserve shifting to a dovish regime in 2024 and the Bloomberg US Aggregate Index delivering a modest 1.25% total return. This heightened interest in income-generating strategies contributed to the broader ETF market’s record-breaking $1 trillion in inflows.
Of the 477 fixed-income ETFs with at least a 1-year track record, 79.7% outperformed the Bloomberg US Aggregate Index, a stark contrast to the equity market, where only 13.8% of ETFs surpassed their primary benchmark. This highlights the breadth of opportunity and relative benchmark-beating potential within the fixed-income asset class.
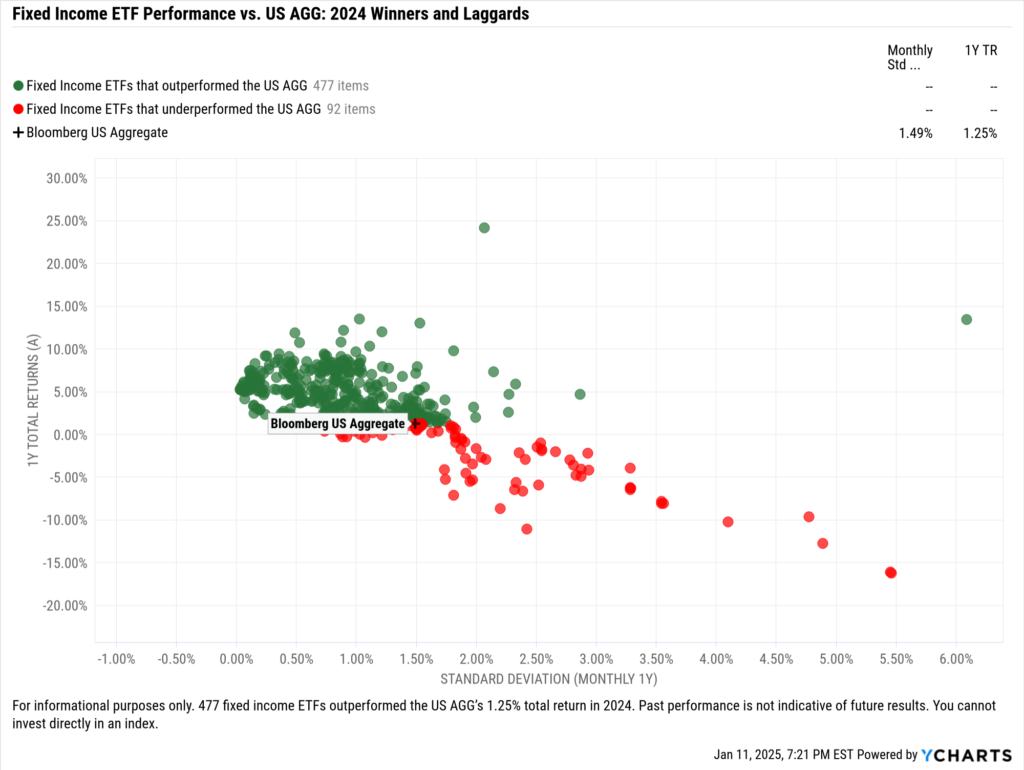
Below, we analyzed the top-performing fixed-income ETFs based on total and NAV returns within their respective peer groups. We also offer financial advisors valuable insights into how these funds balance income potential and risk, emphasizing the trade-offs between distribution yield and volatility to support more informed portfolio decisions.
If this analysis and these visuals caught your attention but you’re more focused on equity strategies, we also reviewed the best-performing equity ETFs of 2024. Check it out here.
*Flexible Income ETFs were excluded from the analysis due to having more varied asset allocations compared to other fixed-income peer groups.*
Best Performing Fixed Income ETFs
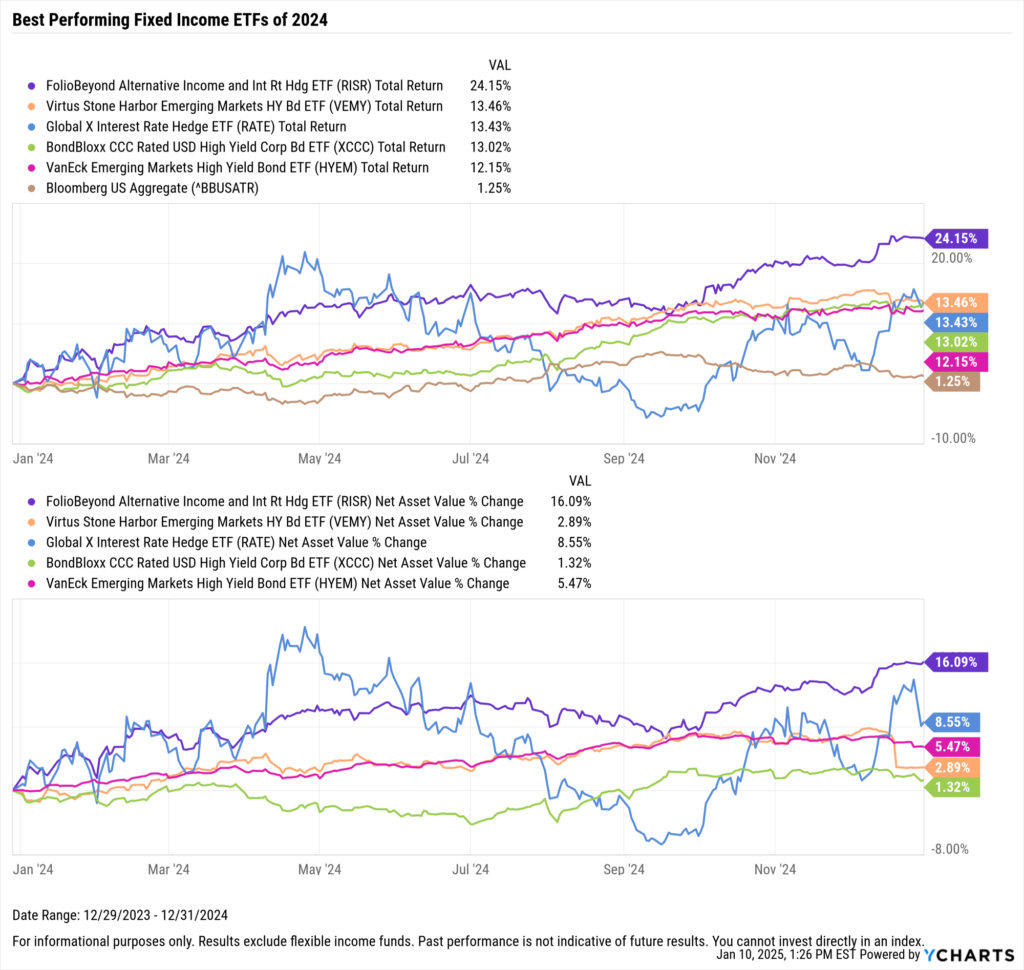
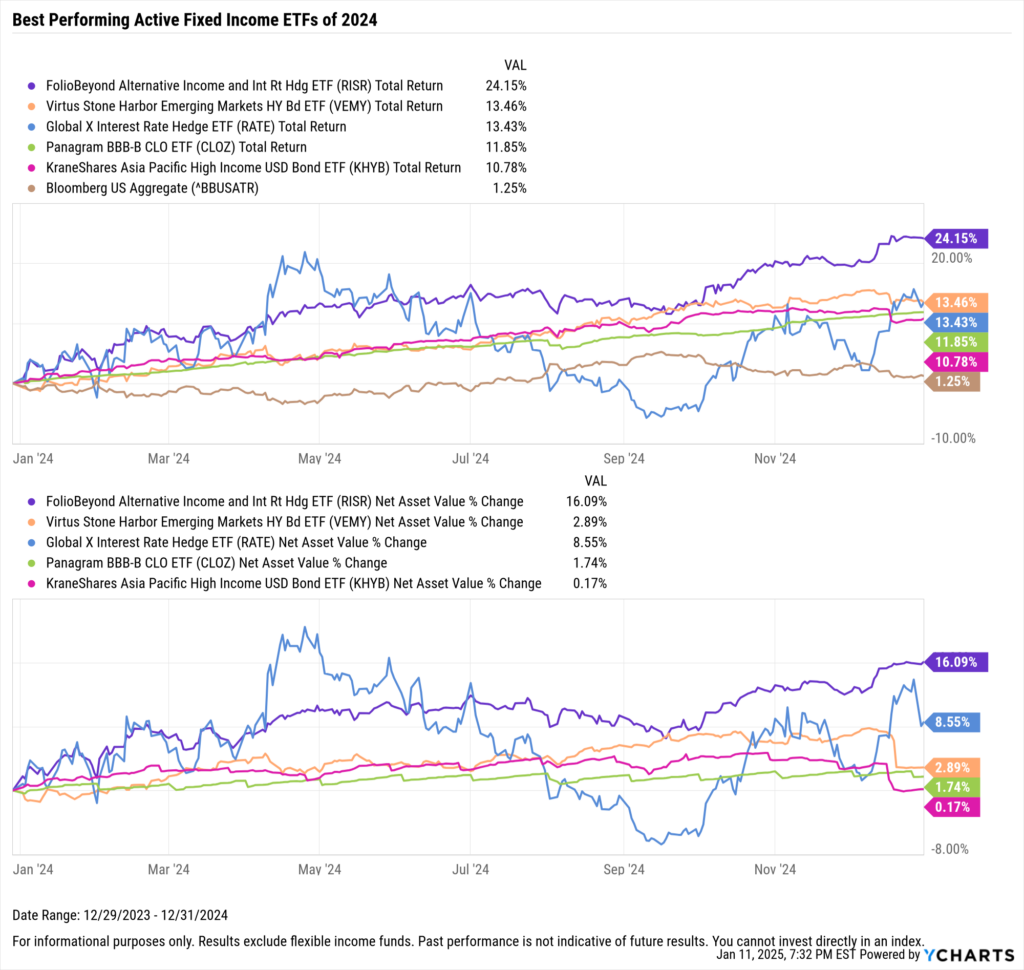
The FolioBeyond Alternative Income and Interest Rate Hedged ETF (RISR) was the top-performing fixed-income ETF of 2024, delivering a total return of 24.2%. RISR was followed by the Virtus Stone Harbor Emerging Markets High Yield Bond ETF (VEMY), which achieved a total return of 13.5%, and the Global X Interest Rate Hedge ETF (RATE), which posted a total return of 13.4%.
The chart below provides a comprehensive view of both NAV and total returns, highlighting the dual drivers of fixed-income performance: price appreciation and income potential. View and modify the full top-ten screen here.
Download Visual | View & Modify in YCharts
The Janus Henderson B-BBB CLO ETF (JBBB) was among the least volatile top-performing strategies, with a monthly standard deviation of 0.53% and a distribution yield of 7.7%. Regarding income potential, the BondBloxx CCC Rated USD High Yield Corp Bond ETF (XCCC) delivered a 10.7% distribution yield, while VEMY closely followed with a 10.2% yield.

Download Visual | View & Modify in YCharts
Best Performing Active Fixed Income ETFs
Active fixed-income ETFs significantly contributed to the increased adoption of active ETFs in portfolios throughout 2024. This can largely be attributed to the ability of skilled and experienced fund managers to identify and capitalize on inefficiencies in the fixed-income market. Also, advisors may increasingly turn to fixed-income managers to tactically and often tax-efficiently reposition client portfolios, leveraging the ETF wrapper.
The volatile rate environment in 2024 further emphasized the importance of thoughtful rebalancing and reconstitution of the fixed-income sleeves within client portfolios. For instance, the 10-year Treasury Rate fluctuated considerably, peaking at 4.7% in April and hitting a low of 3.63% in September—a variance of 107 basis points. This followed an even more significant variance of 168 basis points in 2023 when the 10-year ranged from a high of 4.98% to a low of 3.3%.
In 2024, among active U.S.-domiciled fixed-income ETFs with at least a one-year track record (excluding flexible income strategies due to their diverse asset allocations), 237 funds—or 83.8%—outperformed the Bloomberg U.S. Aggregate Index’s 1.25% total return. This starkly contrasts equity strategies, where only 16.9% of funds outperformed the asset class benchmark, highlighting the relative strength of active management in fixed income during the year.
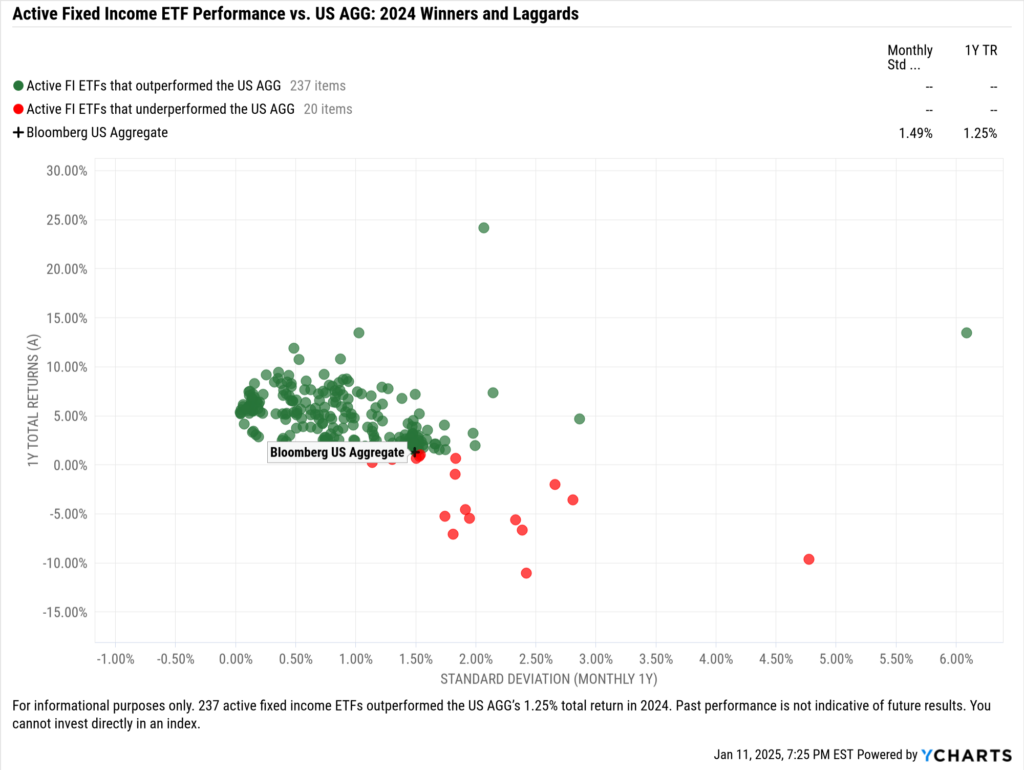
The top-performing active fixed income ETFs of 2024 were RISR, VEMY, and RATE, delivering returns of 24.2%, 13.5%, and 13.4, respectively. Review and modify the full top ten screen here.
Download Visual | View & Modify in YCharts
The Pacer Pacific Asset Floating Rate High Income ETF (FLRT) was the least volatile among the top-performing active fixed income strategies, with a monthly standard deviation of 0.25% while maintaining a distribution yield of 7.9%.
VEMY led the group with the highest distribution yield at 10.2%. The KraneShares Asia Pacific High Income USD Bond ETF (KHYB) offered the second-highest distribution yield at 10.1%. The Panagram BBB-B CLO ETF (CLOZ) rounded out the top three with a 9.1% yield.

Download Visual | View & Modify in YCharts
Best Performing Core Bond ETFs
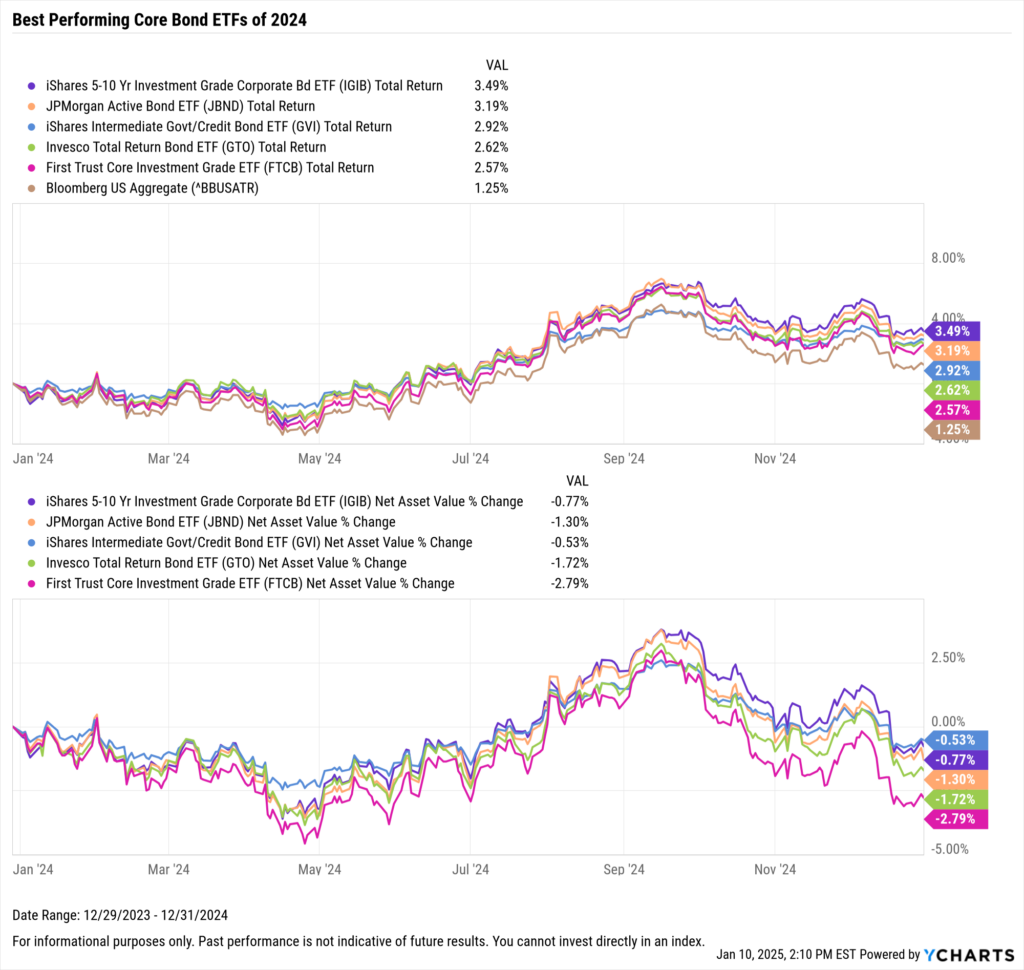
The best-performing core bond ETFs of 2024 were the iShares 5-10 Year Investment Grade Corporate Bond ETF (IGIB), the JPMorgan Active Bond ETF (JBND), and the iShares Intermediate Government/Credit Bond ETF (GVI), delivering returns of 3.5%, 3.2%, and 2.9%, respectively. View and modify the full top-ten screen here.
Download Visual | View & Modify in YCharts
The ClearShares Piton Intermediate Fixed Income ETF (PIFI) stood out as the least volatile among the top-performing core bond strategies, with a monthly standard deviation of just 0.98% while maintaining a distribution yield of 2.9%.
The First Trust Core Investment Grade ETF (FTCB) led the group with the highest distribution yield at 5.2%. JBND delivered a 4.6% yield, followed closely by the Vanguard Total Corporate Bond ETF (VTC) at 4.5%.

Download Visual | View & Modify in YCharts
Best Performing Core Plus Bond ETFs
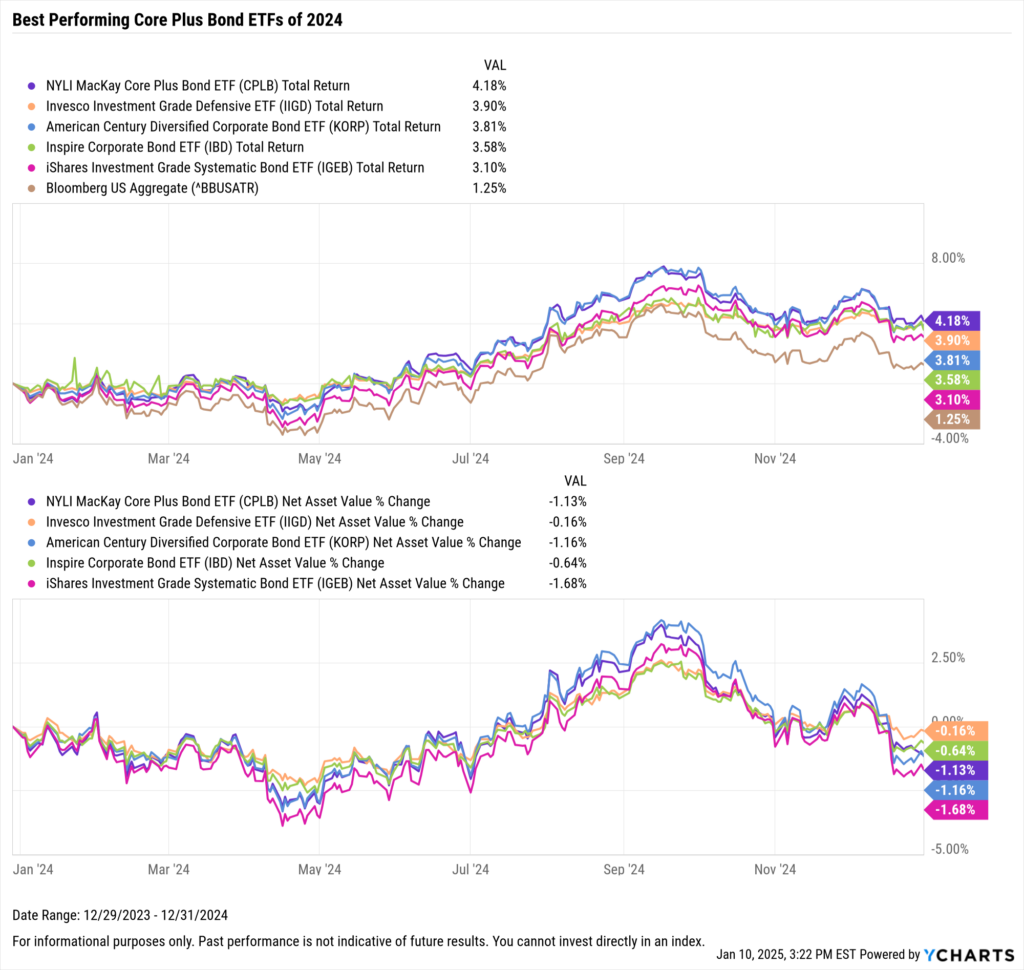
The best-performing core plus bond ETFs of 2024 were the NYLI MacKay Core Plus Bond ETF (CPLB), the Invesco Investment Grade Defensive ETF (IIGD), and the American Century Diversified Corporate Bond ETF (KORP), delivering returns of 4.2%, 3.9%, and 3.8%, respectively. View and modify the full top-ten screen here.
Download Visual | View & Modify in YCharts
IIGD emerged as the least volatile among the top-performing core bond plus strategies, boasting a monthly standard deviation of 0.9% while delivering a distribution yield of 4.1%.
CPLB led the group with the highest distribution yield at 5.4%, followed closely by the JPMorgan Core Plus Bond ETF (JCPB) at 5.2%. The iShares Investment Grade Systematic Bond ETF (IGEB) rounded out the top three, offering a distribution yield of 5.1%.

Download Visual | View & Modify in YCharts
Best Performing General Bond ETFs
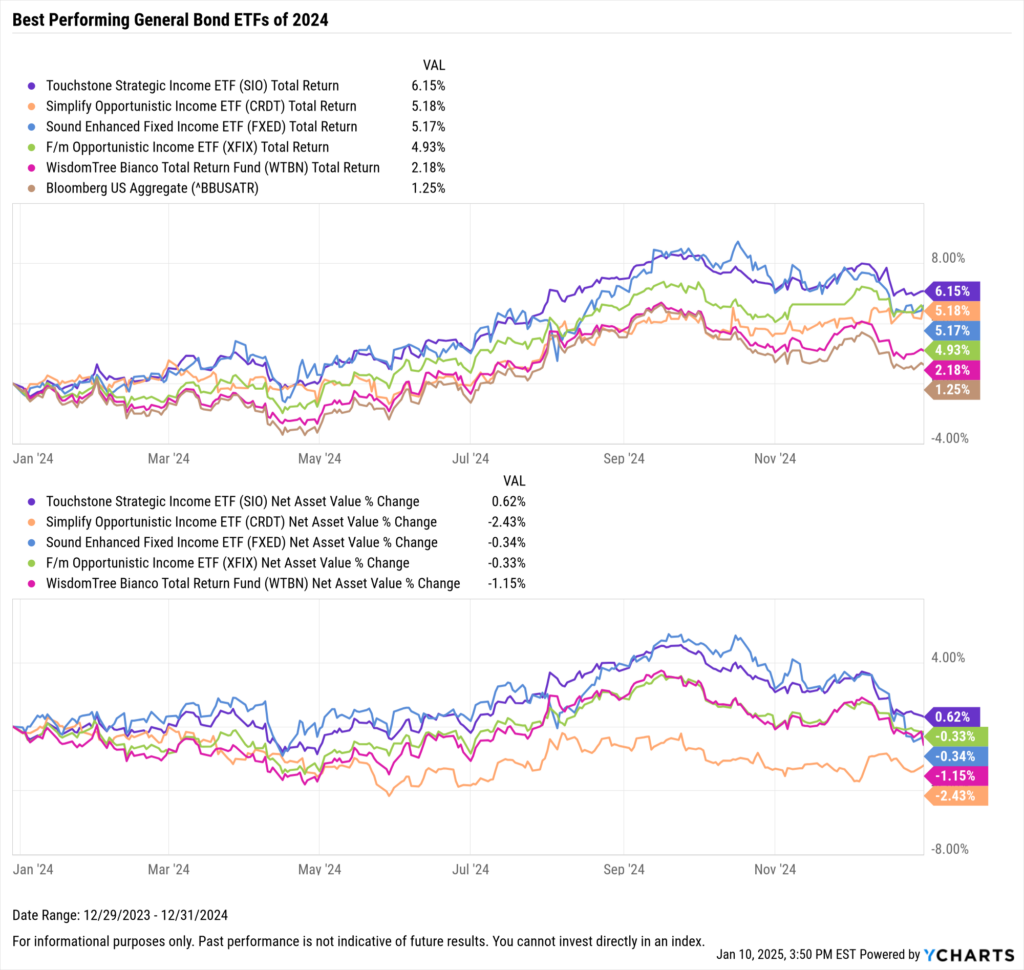
The best-performing general bond ETFs of 2024 were the Touchstone Strategic Income ETF (SIO), the Simplify Opportunistic Income ETF (CRDT), and the Sound Enhanced Fixed Income ETF (FXED), delivering returns of 6.2%, 5.2%, and 5.2%, respectively. View and modify the full top-ten screen here.
Download Visual | View & Modify in YCharts
CRDT stood out as the least volatile of the top-performing general bond strategies, with a monthly standard deviation of just 0.96%. It also delivered the highest distribution yield of the best-performing general bond ETFs, at 7.3%.
FXED offered the second-highest distribution yield at 6.7%, while the F/m Opportunistic Income ETF (XFIX) rounded out the top three with a 5.5% yield.

Download Visual | View & Modify in YCharts
Best Performing General U.S. Treasury ETFs
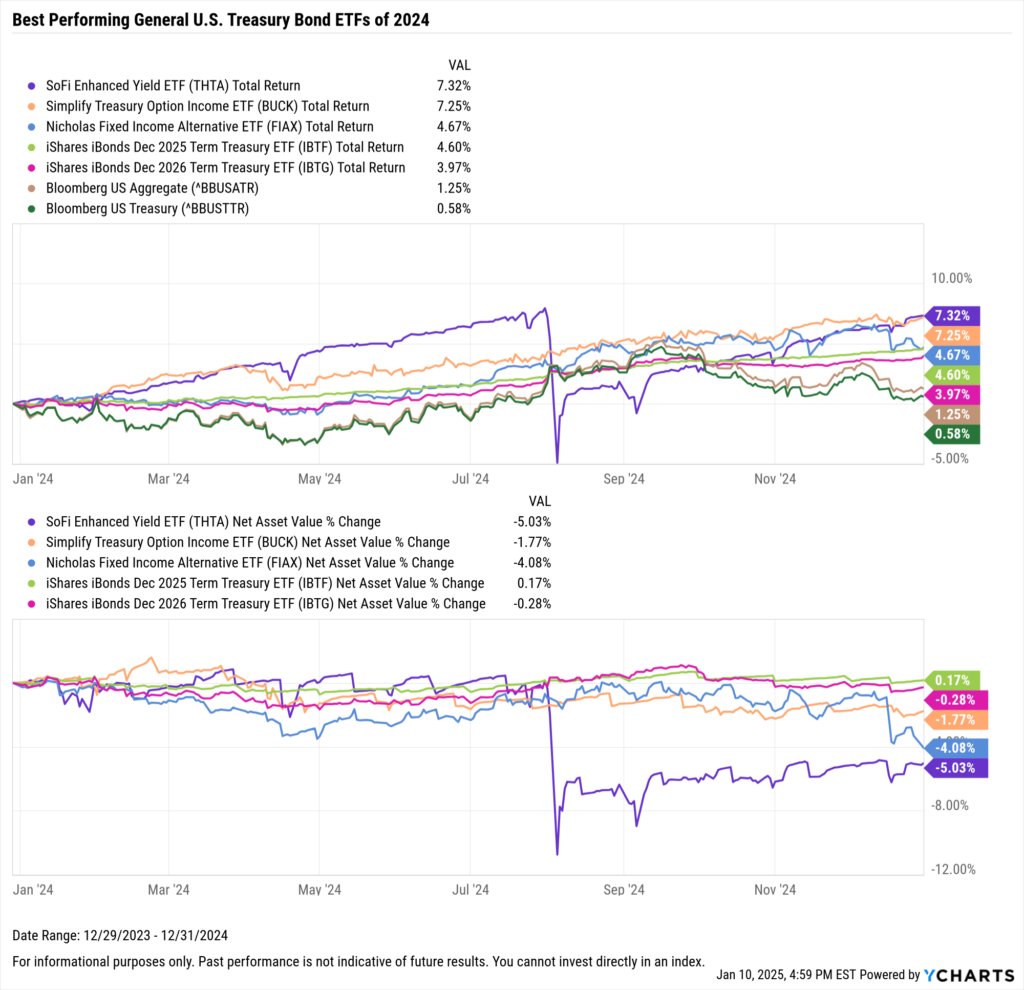
The best-performing general U.S treasury bond ETFs of 2024 were the SoFi Enhanced Yield ETF (THTA), the Simplify Treasury Option Income ETF (BUCK), and the Nicholas Fixed Income Alternative ETF (FIAX), delivering returns of 7.3%, 7.3%, and 4.7%, respectively. View and modify the full top-ten screen here.
Download Visual | View & Modify in YCharts
The iShares iBonds Dec 2025 Term Treasury ETF (IBTF) was the least volatile among the top-performing general U.S. Treasury bond strategies, with a monthly standard deviation of just 0.23% while offering a distribution yield of 4.3%.
Regarding income potential in this peer group, THTA led the way among top-performing general U.S. Treasury bond ETFs with a 12.4% distribution yield, followed by BUCK at 8.9% and FIAX at 8.1%.

Download Visual | View & Modify in YCharts
Best Performing High Yield ETFs
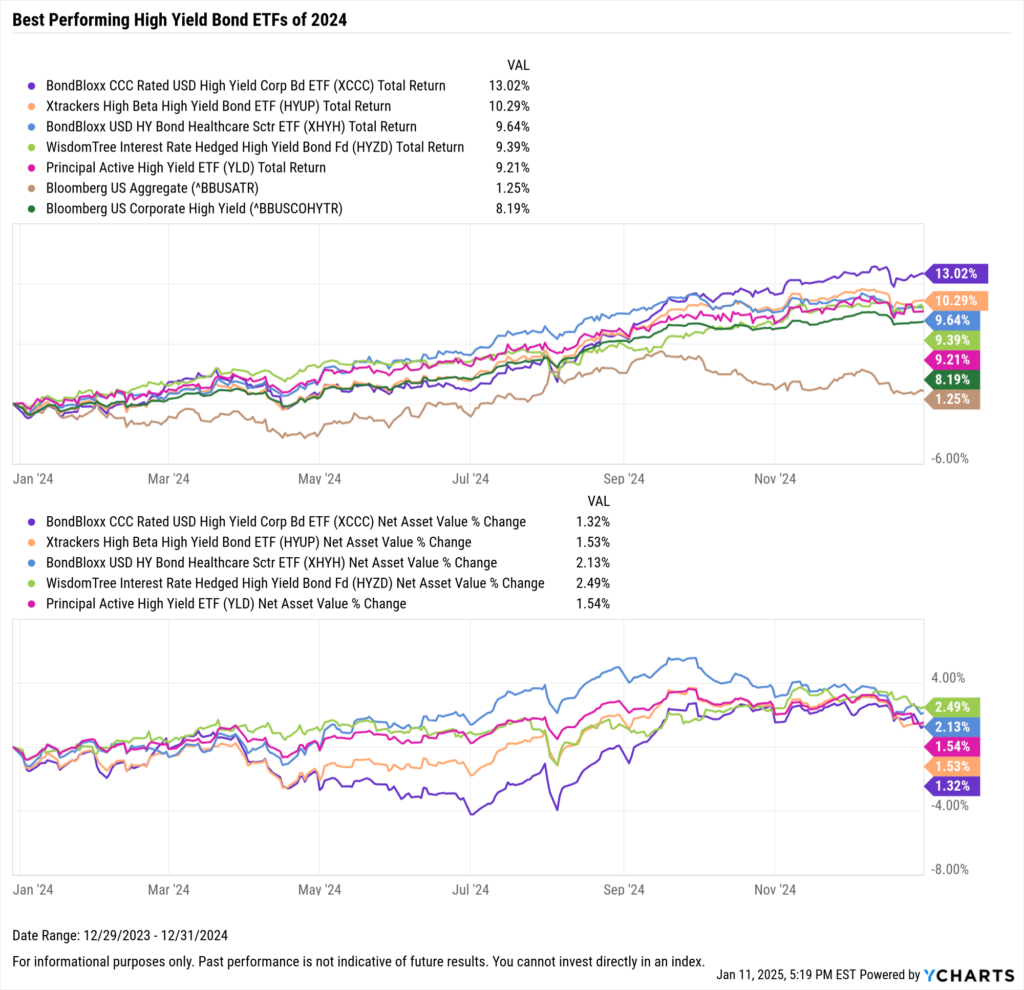
The best-performing high yield bond ETFs of 2024 were the BondBloxx CCC Rated USD High Yield Corporate Bond ETF (XCCC), the Xtrackers High Beta High Yield Bond ETF (HYUP), and the BondBloxx USD HY Bond Healthcare Sector ETF (XHYH), which delivered returns of 13%, 10.3%, and 9.6%, respectively. View and modify the full top-ten screen here.
Download Visual | View & Modify in YCharts
The Invesco BulletShares 2024 High Yield Corporate Bond ETF (BSJO) was the least volatile among the top-performing high yield bond strategies, with a monthly standard deviation of just 0.24%. According to Invesco’s website, the ETF has a “distribution rate” of 5.5%.
In terms of income potential in this peer group, XCCC led the way among top-performing high yield bond ETFs with a 10.7% distribution yield, followed by the SPDR Blackstone High Income ETF (HYBL) at 7.9% and HYUP at 7.7%.

Download Visual | View & Modify in YCharts
Best Performing Loan Participation ETFs
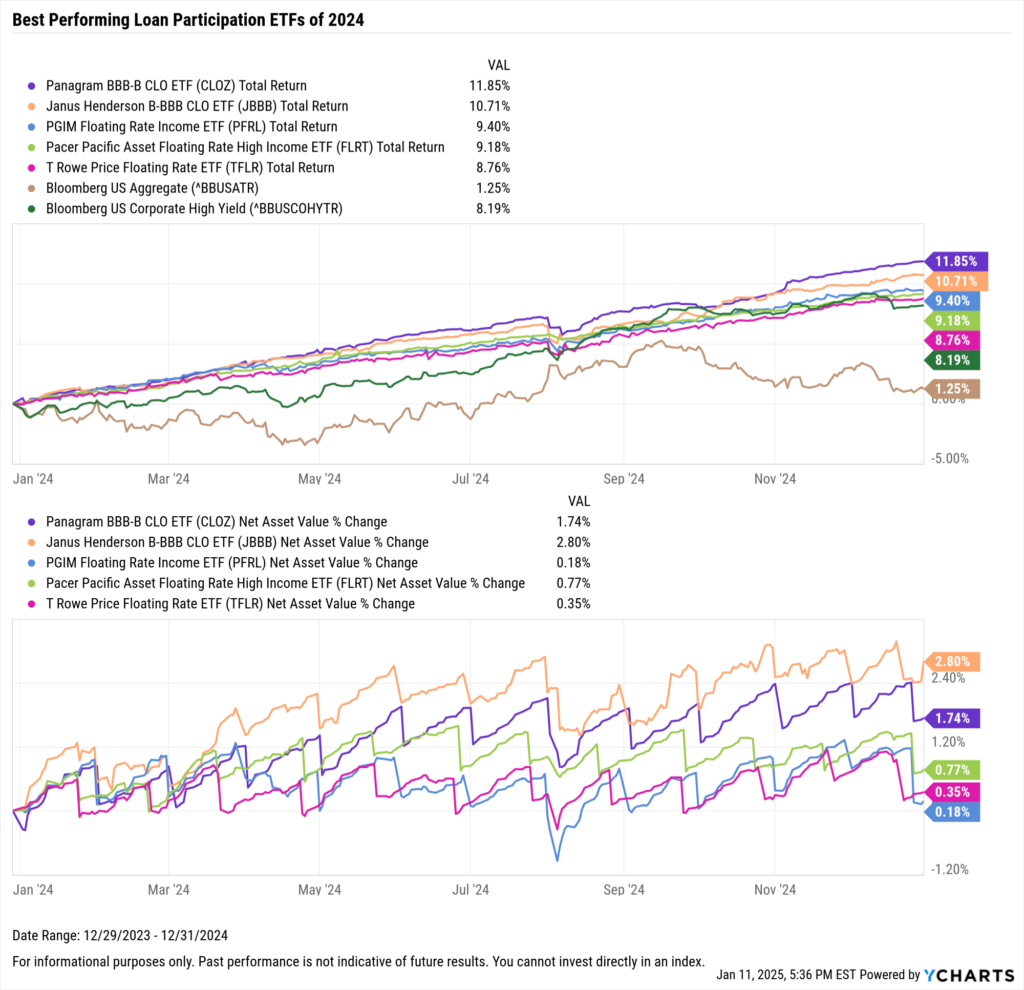
The best-performing loan participation ETFs of 2024 were the Panagram BBB-B CLO ETF (CLOZ), the Janus Henderson B-BBB CLO ETF (JBBB), and the PGIM Floating Rate Income ETF (PFRL), delivering returns of 11.9%, 10.7%, and 9.4%, respectively. View and modify the full top-ten screen here.
Download Visual | View & Modify in YCharts
The VanEck CLO ETF (CLOI) was the least volatile among the top-performing loan participation strategies, with a monthly standard deviation of just 0.16% while offering a distribution yield of 6.7%.
In terms of income potential in this peer group, CLOZ led the way among top-performing high yield bond ETFs with a 9.1% distribution yield, followed by PFRL at 8.9% and the SPDR Blackstone Senior Loan ETF (SRLN) at 8.6%.

Download Visual | View & Modify in YCharts
Best Performing Emerging Markets Hard Currency ETFs
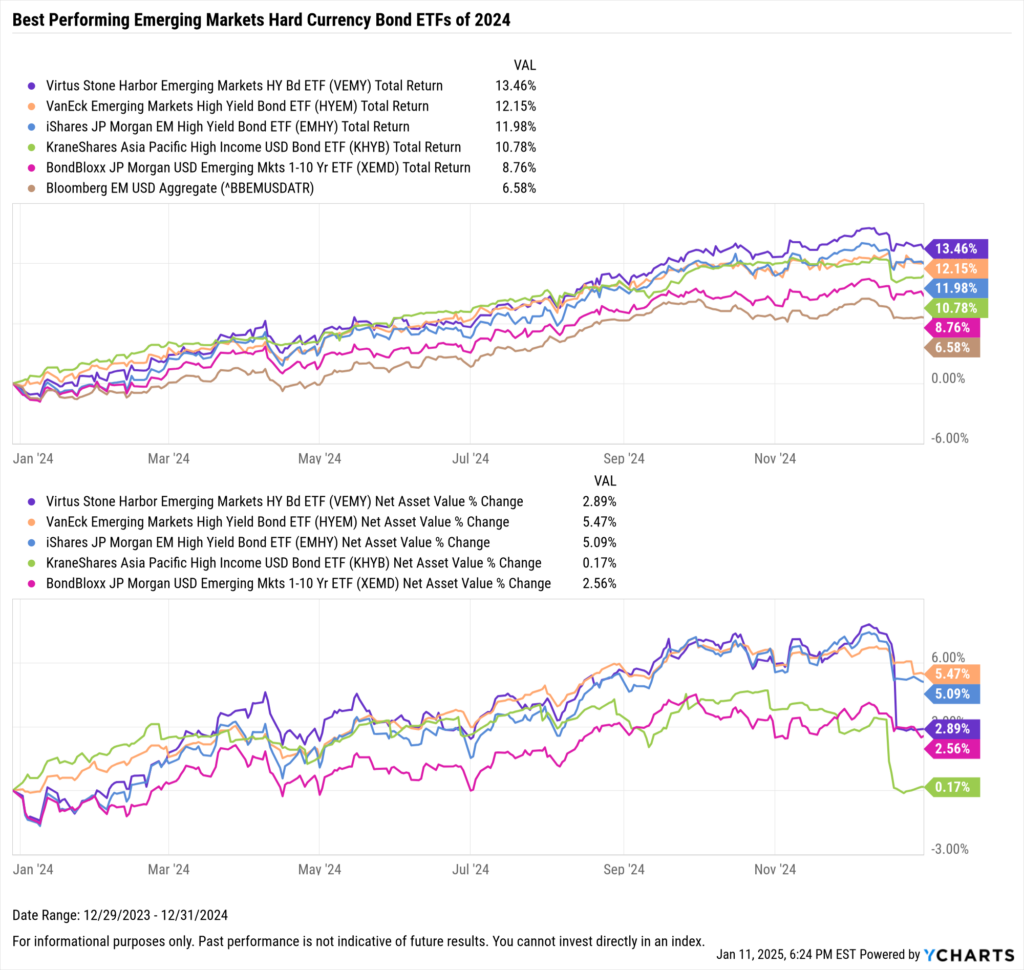
The best-performing emerging markets hard currency bond ETFs of 2024 were VEMY, the VanEck Emerging Markets High Yield Bond ETF (HYEM), and the iShares JP Morgan EM High Yield Bond ETF (EMHY), delivering returns of 13.5%, 12.2%, and 12%, respectively. View and modify the full top-ten screen here.
Download Visual | View & Modify in YCharts
The SPDR DoubleLine Emerging Markets Fixed Income ETF (EMTL) was the least volatile among the top-performing emerging markets hard currency bond strategies, with a monthly standard deviation of just 0.74% while offering a distribution yield of 5.3%.
Regarding income potential in this peer group, VEMY led the way among top-performing high yield bond ETFs with a 10.2% distribution yield, followed by KHYB at 10.1% and EMHY at 6.9%.

Download Visual | View & Modify in YCharts
If you are interested in seeing if there were significant inflows into these fixed income ETFs or other strategies, subscribe to our fund flow report here.
Whenever you’re ready, there are three ways YCharts can help you:
Have questions about how YCharts can help you grow AUM and prepare for meetings?
Email us at hello@ycharts.com or call (866) 965-7552. You’ll get a response from one of our Chicago-based team members.
Unlock access to our Fund Flows Report and Visual Deck by becoming a client.
Dive into YCharts with a no-obligation 7-Day Free Trial now.
Sign up for a copy of our Fund Flows Report and Visual Deck:
Disclaimer
©2024 YCharts, Inc. All Rights Reserved. YCharts, Inc. (“YCharts”) is not registered with the U.S. Securities and Exchange Commission (or with the securities regulatory authority or body of any state or any other jurisdiction) as an investment adviser, broker-dealer or in any other capacity, and does not purport to provide investment advice or make investment recommendations. This report has been generated through application of the analytical tools and data provided through ycharts.com and is intended solely to assist you or your investment or other adviser(s) in conducting investment research. You should not construe this report as an offer to buy or sell, as a solicitation of an offer to buy or sell, or as a recommendation to buy, sell, hold or trade, any security or other financial instrument. For further information regarding your use of this report, please go to: ycharts.com/about/disclosure
Next Article
Best Performing Equity ETFs of 2024: Total & Risk-Adjusted ReturnsRead More →
