Government Efficiency & Market Impact: Comparing Clinton-Era Reform to Trump’s 2025 Deregulatory Push
Introduction: How Government Efficiency Initiatives Influence Markets
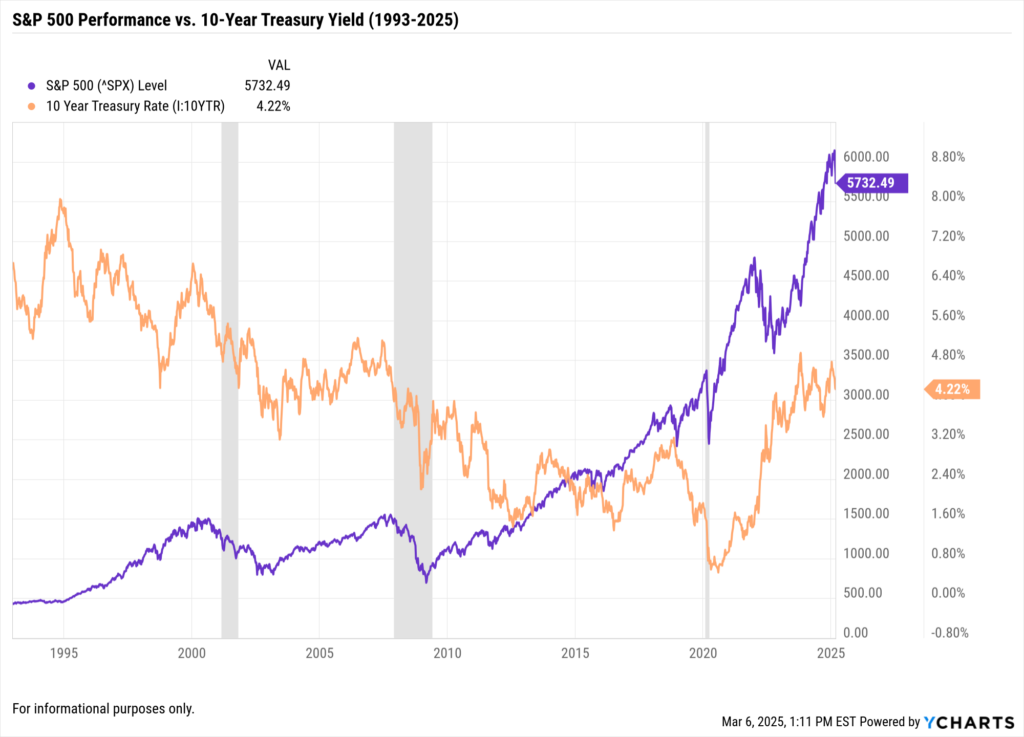
Government efficiency plays a crucial role in shaping market sentiment, investor confidence, and asset performance. Structural reforms designed to improve efficiency and reduce bureaucracy often support economic growth. However, sudden deregulation or significant federal workforce reductions can introduce volatility.
The Clinton-era “Reinventing Government” initiative (1993-1998) and Trump’s 2025 Department of Government Efficiency (DOGE) reforms provide two historical examples of government efficiency-focused policies. While both share the goal of streamlining operations, their execution and economic impact have been markedly different.
For financial advisors and asset managers, studying the market trends surrounding past government efficiency initiatives can provide critical insight into how today’s policies may affect equities, fixed income, and economic stability.
This analysis will examine:
- Key similarities and differences between Clinton’s and Trump’s reforms
- Market performance during Clinton’s efficiency efforts using YCharts data
- Current market conditions amid Trump’s 2025 initiatives
- Investment considerations for financial professionals
Clinton’s 1993 ‘Reinventing Government’ & Market Impact
Overview of Clinton’s Efficiency Reforms
The “Reinventing Government” initiative, launched in 1993, sought to make federal agencies more cost-effective and performance-driven. Unlike sudden deregulation, Clinton’s program focused on improving efficiency without dismantling core functions.
Key policy measures included:
- Federal Workforce Reduction – The federal government workforce was reduced by approximately 426,200 positions between January 1993 and September 2000, marking the smallest government workforce since the Eisenhower administration.
- Spending Cuts & Process Automation – Modernizing government operations resulted in estimated savings of $136 billion by implementing National Performance Review recommendations.
- Procurement Reform – Restructuring the bidding process saved $12 billion annually and improved agency budgets.
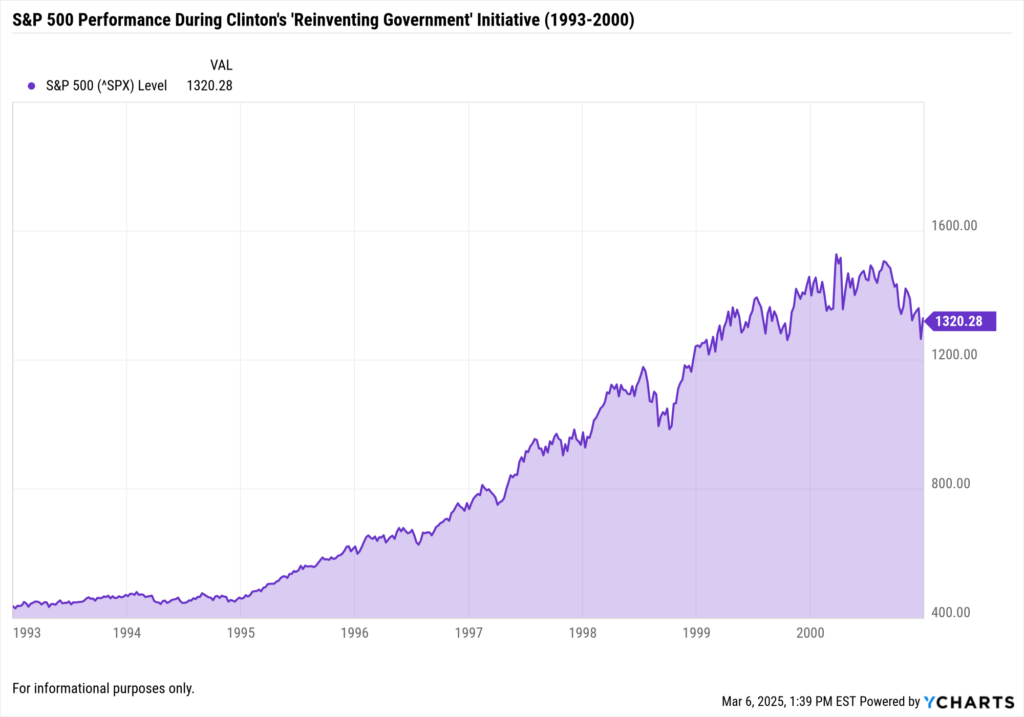
Market Performance During Clinton’s Efficiency Push
Markets responded positively to these fiscal responsibility measures, reinforced by broader economic growth:
- S&P 500 Growth – Between 1993 and 2000, the S&P 500 surged approximately 233%, reflecting strong investor confidence.
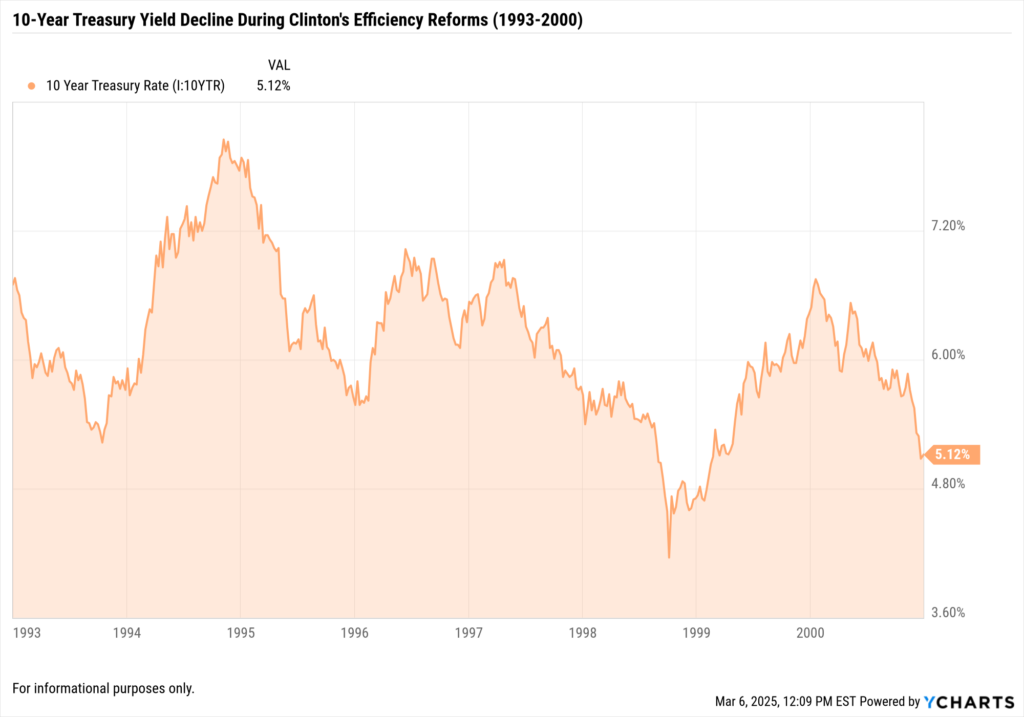
- 10-Year Treasury Yield – Fell from 6.6% in 1993 to 5.2% in 2000, indicating improved economic stability.
- Equity Sector Trends – Technology, financials, and consumer discretionary sectors posted strong returns.
Trump’s 2025 Government Efficiency Reforms & Market Reaction
Overview of DOGE (Department of Government Efficiency)
The Trump administration’s 2025 efficiency initiative prioritizes rapid federal workforce reduction and deregulation. Unlike Clinton’s bipartisan approach, these measures are being implemented swiftly, sparking uncertainty.
Key policy changes include:
- Federal Workforce Downsizing – Employees are now required to submit weekly performance summaries; those who do not comply are considered “resigned.”
- Cuts to Research & Social Programs – Programs such as the Retirement and Disability Research Consortium (RDRC) have been defunded, impacting long-term policy research.
- Department Budget Reductions – Agencies such as the Social Security Administration and the Department of Education have seen budget cuts, fueling concerns about service disruptions.
Market Response to 2025 Efficiency Reforms
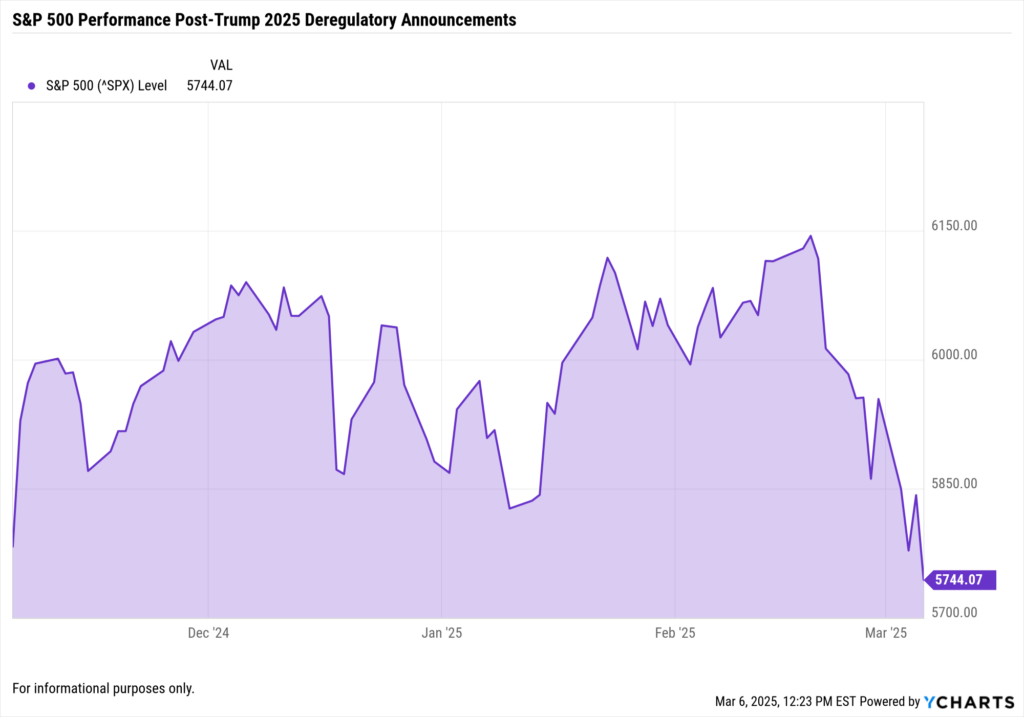
Markets have shown higher volatility in response to the uncertainty surrounding these reforms:
- S&P 500 Performance – Initially declined 3.5% following the policy announcements but has since stabilized.
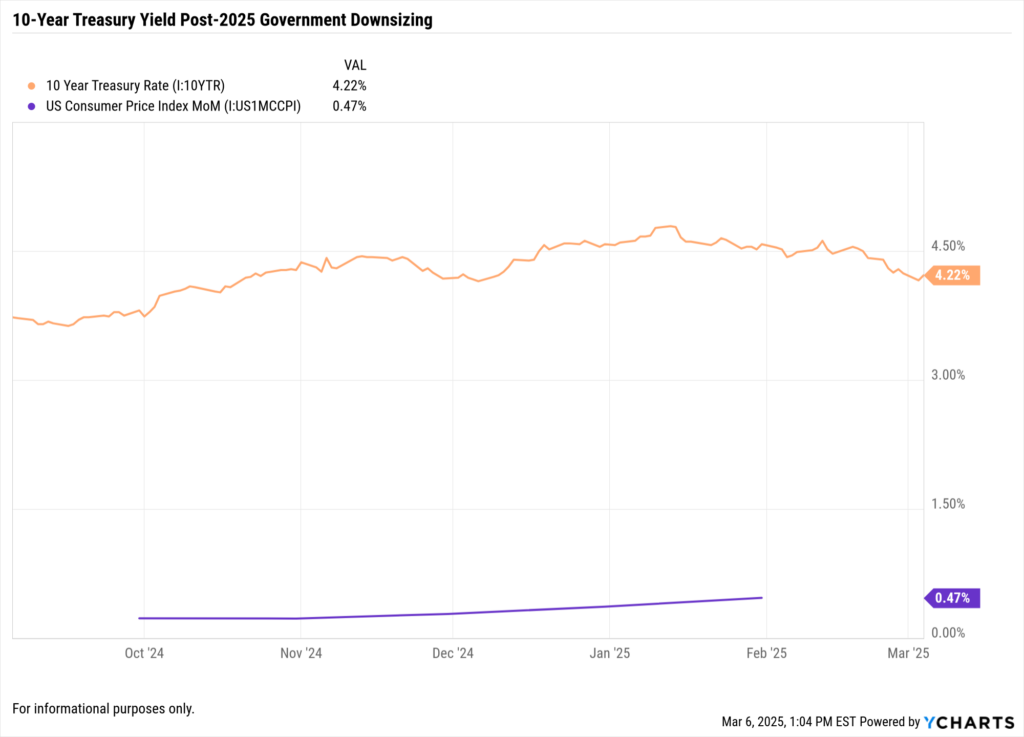
- 10-Year Treasury Yield – Increased to 4.85% as of February 2025, reflecting investor caution.
Sector-Specific Trends:
- Industrials & Energy – Benefiting from relaxed environmental and infrastructure regulations.
- Healthcare & Technology – Facing uncertainty due to research funding cuts and regulatory changes.
Investment Considerations for Financial Advisors
Sector Positioning: Where Are the Opportunities?
Some industries can benefit from deregulation, while others may experience headwinds:
Beneficiaries of Deregulation:
- Energy & Industrials – Rollbacks on environmental restrictions may boost oil & gas profitability.
- Financials – Reduced compliance costs could enhance profit margins for banks and insurance companies.
- Defense & Aerospace – Military spending remains strong as budget reallocations favor these industries.
Potential Headwinds:
- Healthcare & Biotech – Research funding cuts could delay drug approvals and limit innovation.
- Government-Dependent Sectors – Companies reliant on federal contracts, such as infrastructure firms, could see reduced funding.
Fixed Income Strategy: Adjusting for Treasury Yield Movements
As of March 6, 2025, the 10-year Treasury yield has declined to 4.22%, signaling a potential shift in fixed-income strategy. Investors should consider the following:
- Duration Management: Falling yields increase bond prices. Investors may consider extending bond duration to lock in current rates but should remain cautious of interest rate fluctuations.
- Inflation Protection: Treasury Inflation-Protected Securities (TIPS) can help hedge against persistent inflation concerns, adjusting for rising consumer prices.
- Credit Quality Focus: Corporate bond spreads have widened, reflecting increased risk premiums. Prioritizing high-quality corporate bonds can mitigate default risks.
- Sector Diversification: Defensive sectors like healthcare and consumer staples tend to perform well in uncertain fixed-income environments.
- Liquidity Management: Maintaining exposure to short-term Treasuries and highly liquid assets ensures flexibility as market conditions evolve.
As rates fluctuate, balancing duration, credit risk, and sector exposure will be key for financial advisors and asset managers.
Managing Volatility & Risk Exposure
Given policy uncertainty and market fluctuations, financial professionals should:
- Monitor Key Economic Indicators – Employment reports, inflation data, and consumer confidence readings will be critical.
- Diversify Sector Exposure – Reducing exposure to highly government-dependent industries can help mitigate risk.
Leverage Scenario Analysis – Testing portfolio resilience under different government policy scenarios can enhance risk management strategies.
How YCharts Helps Financial Professionals Track Market Trends
With ongoing government policy shifts affecting asset prices, YCharts provides the tools advisors need to make data-driven investment decisions:
- Track Economic & Market Data → Use YCharts Economic Indicators to monitor Treasury yields, market trends, and sector performance.
- Compare Historical & Current Trends → Analyze S&P 500 movements during Clinton’s reforms vs. Trump’s 2025 changes.
- Build Client-Ready Reports → Create Custom Reports that illustrate how government policy impacts investment strategies.
Conclusion: What’s Next for Markets?
While both the Clinton-era government efficiency reforms and Trump’s 2025 initiative share the goal of reducing inefficiencies, their economic effects differ:
- Clinton’s gradual, bipartisan reforms promoted fiscal responsibility and market stability, supporting a long bull market.
- Trump’s aggressive downsizing and deregulation have led to short-term volatility, with potential sector opportunities and risks.
For financial professionals, staying ahead of macroeconomic trends and understanding the historical impact of government efficiency initiatives can help navigate today’s market.
Whenever you’re ready, there are 3 ways YCharts can help you:
1. Looking for a best-in-class data & visualization tool?
Send us an email at hello@ycharts.com or call (866) 965-7552. You’ll be directly in touch with one of our Chicago-based team members.
2. Want to test out YCharts for free?
Start a no-risk 7-Day Free Trial.
3. Get your copy of The Top Metrics Advisors Used in Portfolio Reports: 2024
Disclaimer
©2025 YCharts, Inc. All Rights Reserved. YCharts, Inc. (“YCharts”) is not registered with the U.S. Securities and Exchange Commission (or with the securities regulatory authority or body of any state or any other jurisdiction) as an investment adviser, broker-dealer or in any other capacity, and does not purport to provide investment advice or make investment recommendations. This report has been generated through application of the analytical tools and data provided through ycharts.com and is intended solely to assist you or your investment or other adviser(s) in conducting investment research. You should not construe this report as an offer to buy or sell, as a solicitation of an offer to buy or sell, or as a recommendation to buy, sell, hold or trade, any security or other financial instrument. For further information regarding your use of this report, please go to: ycharts.com/about/disclosure
Next Article
Which Companies Will Lose from New U.S. Tariffs? Market Risks & Portfolio ConsiderationsRead More →