Q1 2025 Financial Sector Earnings: Live Updates & Market Reactions

Updated as of: April 30, 2025 @ 9AM CST
Introduction
As Q1 2025 earnings season unfolds, the Financials sector is in the spotlight. With investors closely watching interest rate dynamics, credit quality, and loan growth, bank and financial institution reports offer real-time signals on the economy’s health.
This page is continually updated with the latest earnings reports and insights from the sector’s top names—including JPMorgan, Goldman Sachs, and Bank of America—backed by real-time YCharts visuals.
Latest Earnings Reports
YCharts users can view a full breakdown of all current and upcoming earnings calls and reports live here.
Not a YCharts user? Try a 7-Day Free Trial.
April 29, 2025 Earnings
Visa Inc. (V) Surpasses Expectations with Robust Consumer Spending
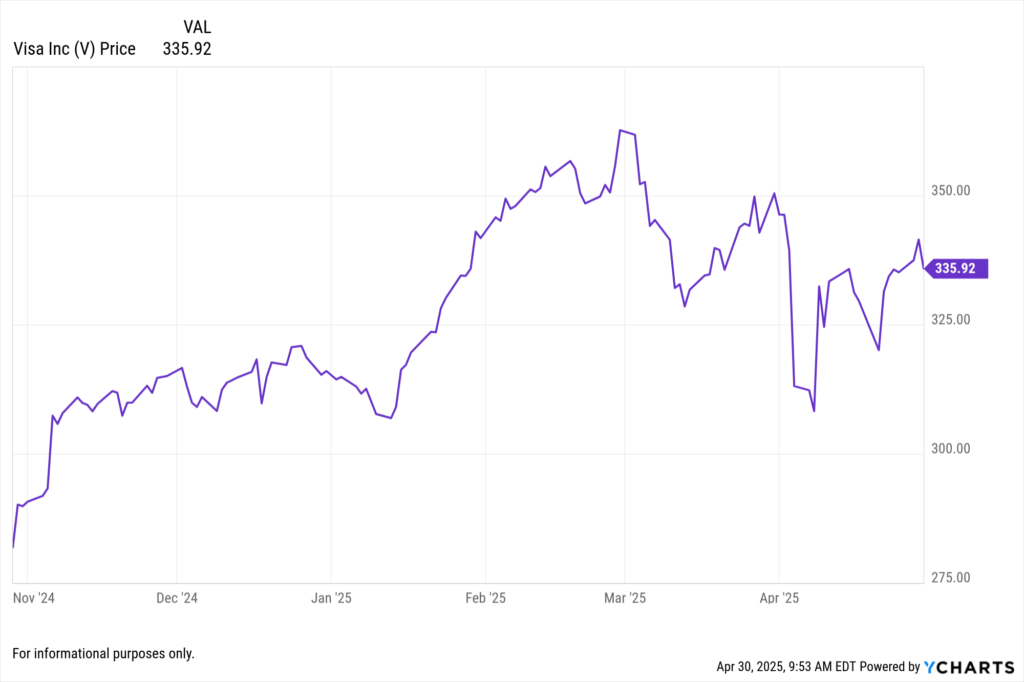
Visa reported fiscal Q2 2025 adjusted earnings of $2.76 per share, exceeding analyst expectations of $2.68. Revenue reached $9.59 billion, slightly below the anticipated $9.74 billion. The company experienced an 8% increase in payments volume, with U.S. growth at 6% and international growth at 9%. Cross-border volume rose 13%, indicating strong global consumer spending. Visa announced a new $30 billion multi-year share repurchase program, reflecting confidence in sustained growth.
View Visa Inc’s Earnings Report Here >
SoFi Technologies Inc. (SOFI) Achieves Record Growth and Raises Guidance
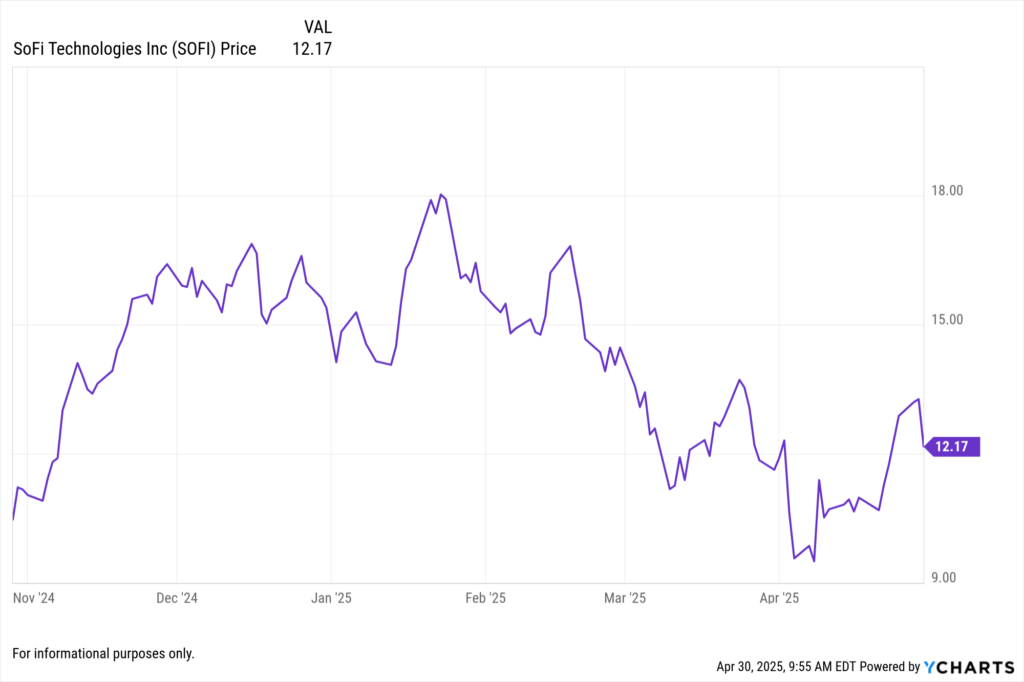
SoFi reported Q1 2025 adjusted net revenue of $772 million, a 33% year-over-year increase, surpassing analyst estimates of $739 million. The company added 800,000 new members, bringing total membership to 10.9 million, a 34% increase from the previous year. Adjusted EBITDA rose 46% to $210 million, and net income reached $71 million. SoFi raised its full-year 2025 guidance, now expecting adjusted net revenue between $3.235 billion and $3.310 billion, and adjusted EBITDA between $875 million and $895 million.
View Sofi Technologies Inc’s Earnings Report Here >
PayPal Holdings Inc. (PYPL) Delivers Strong Profitability Amidst Competitive Pressures
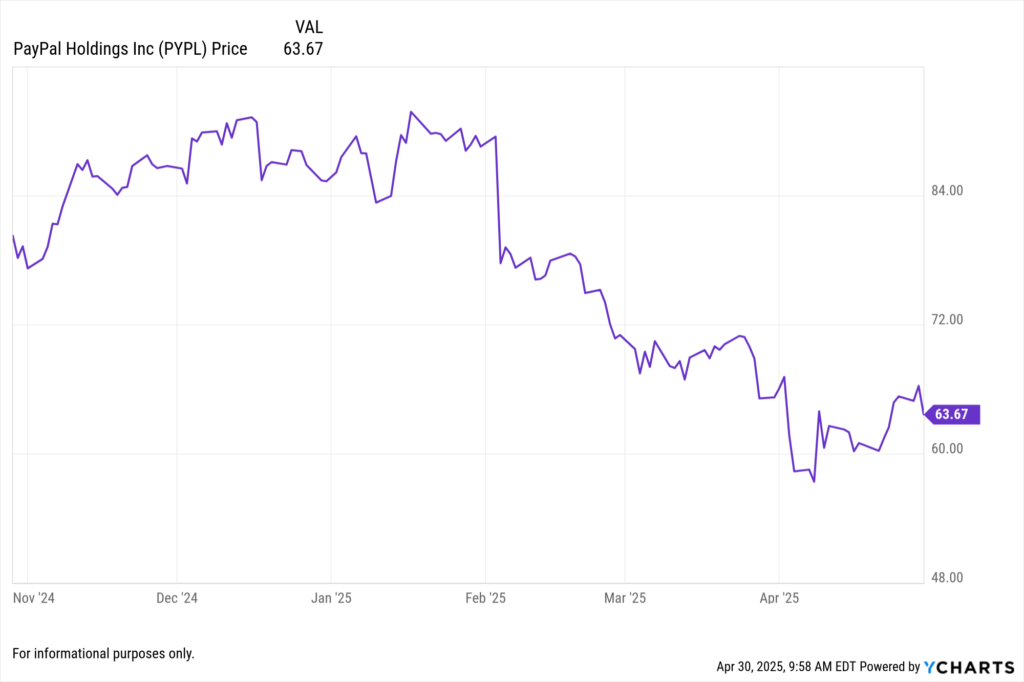
PayPal’s Q1 2025 adjusted earnings per share rose 23% to $1.33, surpassing analyst expectations of $1.16. Revenue increased 1% year-over-year to $7.79 billion, slightly below the projected $7.85 billion. Total Payment Volume grew 4% to $417.2 billion. The company maintained its full-year adjusted profit forecast between $4.95 and $5.10 per share, citing macroeconomic uncertainties. PayPal continues to focus on high-margin operations and cost reductions to navigate competitive challenges.
View PayPal Holdings Inc’s Earnings Report Here >
Banco Bilbao Vizcaya Argentaria SA (BBVA) Reports Record Profit and Enhanced Efficiency
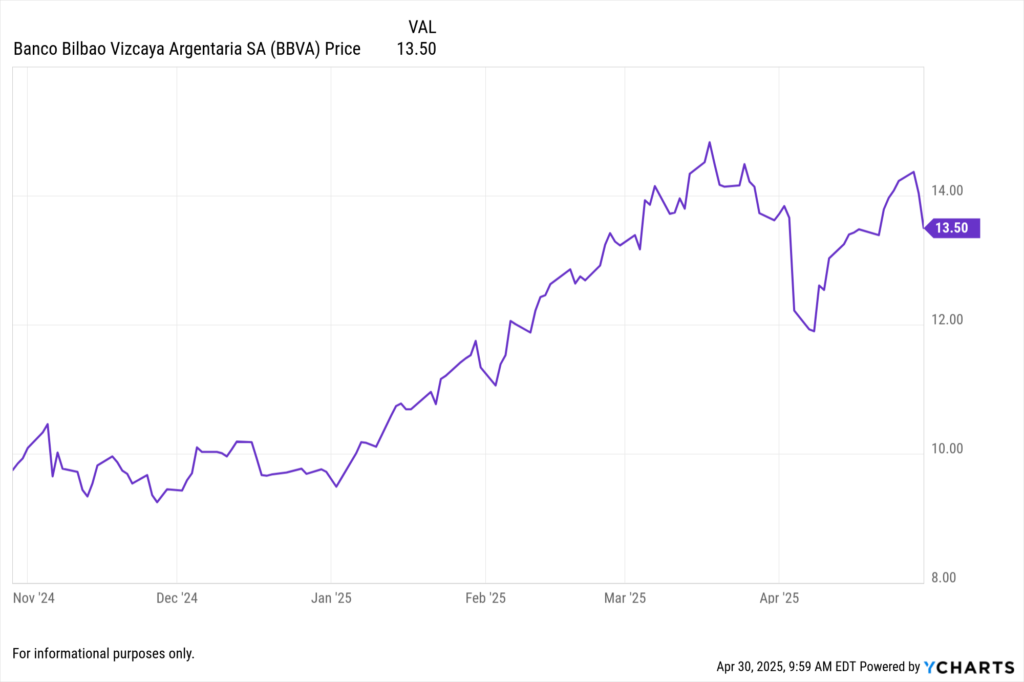
BBVA reported a net attributable profit of €2.698 billion for Q1 2025, a 46% increase from the same period the previous year. Operating income reached a record €5.8 billion, up 39% year-over-year. The bank’s efficiency ratio improved by 469 basis points to 38.2%. BBVA’s CET1 capital ratio stood at 13.09%, reflecting a strong capital position. The bank also channeled approximately €29 billion into sustainable business initiatives during the quarter, marking a 55% increase year-over-year.
View BBVA’s Earnings Report Here >
April 22, 2025 Earnings
Moody’s Corporation (MCO) Reports Strong Q1 Results but Lowers Full-Year Guidance
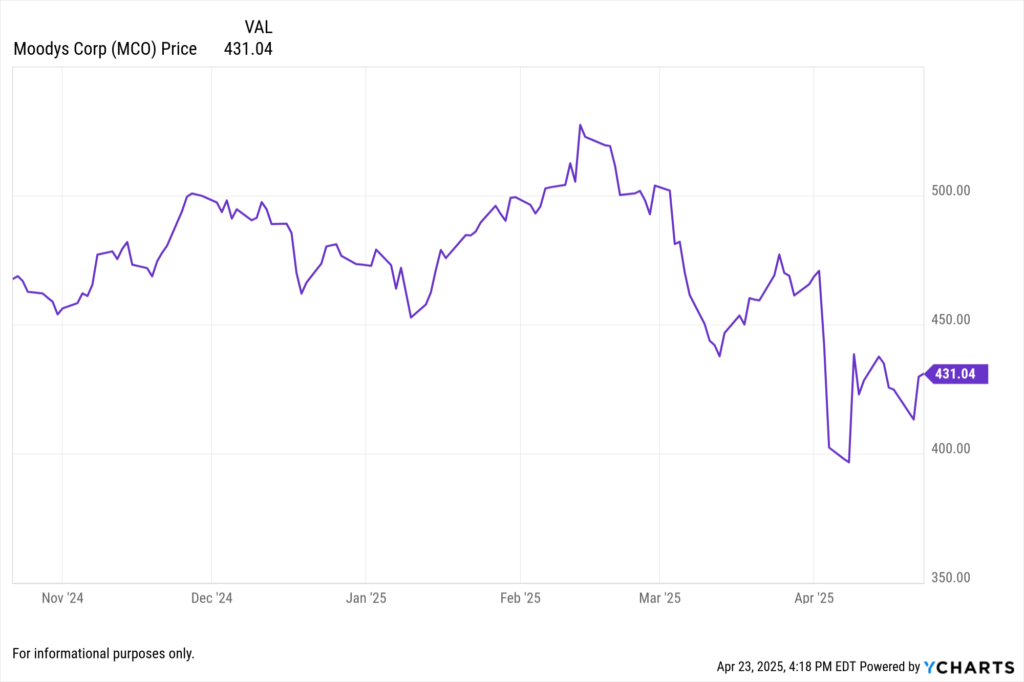
Moody’s Corporation announced Q1 2025 revenue of $1.92 billion, an 8% increase year-over-year. Net income rose to $625 million, or $3.46 per diluted share, up from $577 million, or $3.15 per share, in Q1 2024. The Moody’s Analytics segment reported revenue of $859 million, while Moody’s Investors Service generated $1.07 billion, both reflecting 8% growth. Despite the strong quarter, Moody’s revised its full-year adjusted EPS guidance to a range of $13.25 to $14.00, down from the previous estimate of $14.00 to $14.50, citing increased market volatility and uncertainties stemming from U.S. trade policy.
View Moody’s Corporation’s Earnings Report Here>
Invesco Ltd. (IVZ) Achieves Net Long-Term Inflows and Adjusted EPS Growth in Q1
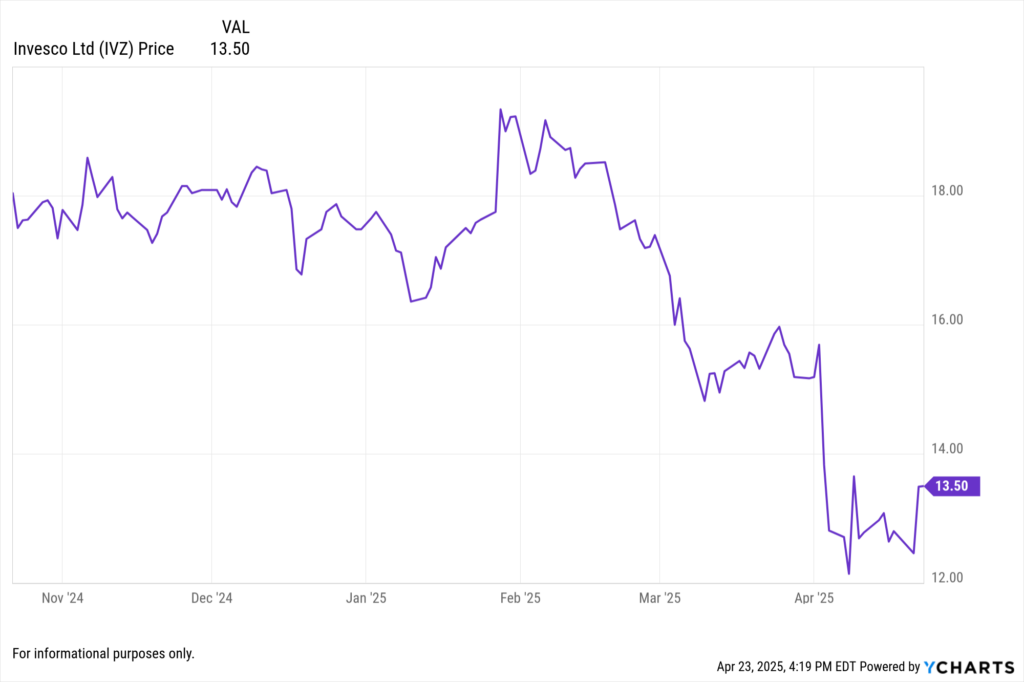
Invesco Ltd. reported Q1 2025 revenue of $1.53 billion, a 3.7% increase year-over-year. Adjusted diluted EPS was $0.44, surpassing analyst expectations. The company experienced net long-term inflows of $17.6 billion, driven by strong performance in ETFs, fixed income, and international markets. Assets under management reached $1.8 trillion at the end of the quarter. Invesco also announced an increase in its quarterly dividend to $0.21 per share and repurchased 1.5 million shares for $25 million during the quarter.
View Invesco Ltd’s Earnings Report Here >
Capital One Financial Corp. (COF) Posts Q1 Profit Growth Amid Higher Interest Income
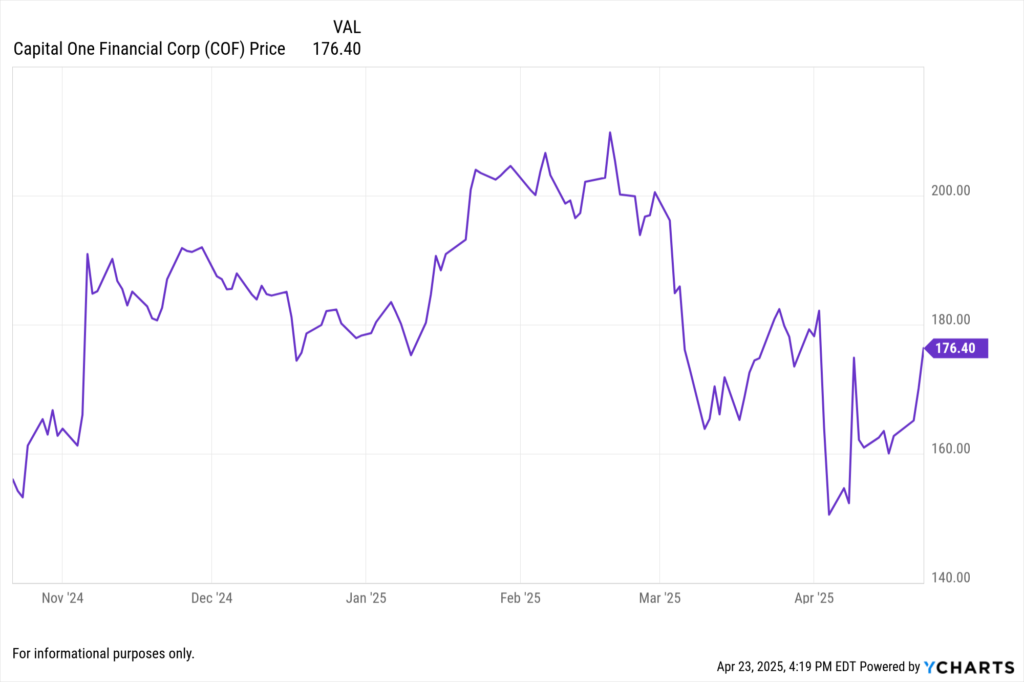
Capital One Financial Corp. reported Q1 2025 net income of $1.4 billion, or $3.45 per diluted share, up from $1.2 billion, or $3.13 per share, in Q1 2024. Net interest income increased by 7% to $8.01 billion, driven by growth in the credit card segment, which comprises nearly half of the company’s loan portfolio. Non-interest income rose by 4% to $1.99 billion. However, net charge-offs increased by 4.6% to $2.74 billion, indicating higher levels of unrecoverable debt. Additionally, U.S. regulators approved Capital One’s $35.3 billion acquisition of Discover Financial Services, positioning the combined entity as the largest U.S. credit card issuer and the eighth-largest bank by assets.
View Capital One Financial Corp’s Earnings Report Here >
April 21, 2025 Earnings
Indian Banks ICICI and HDFC Report Strong Earnings
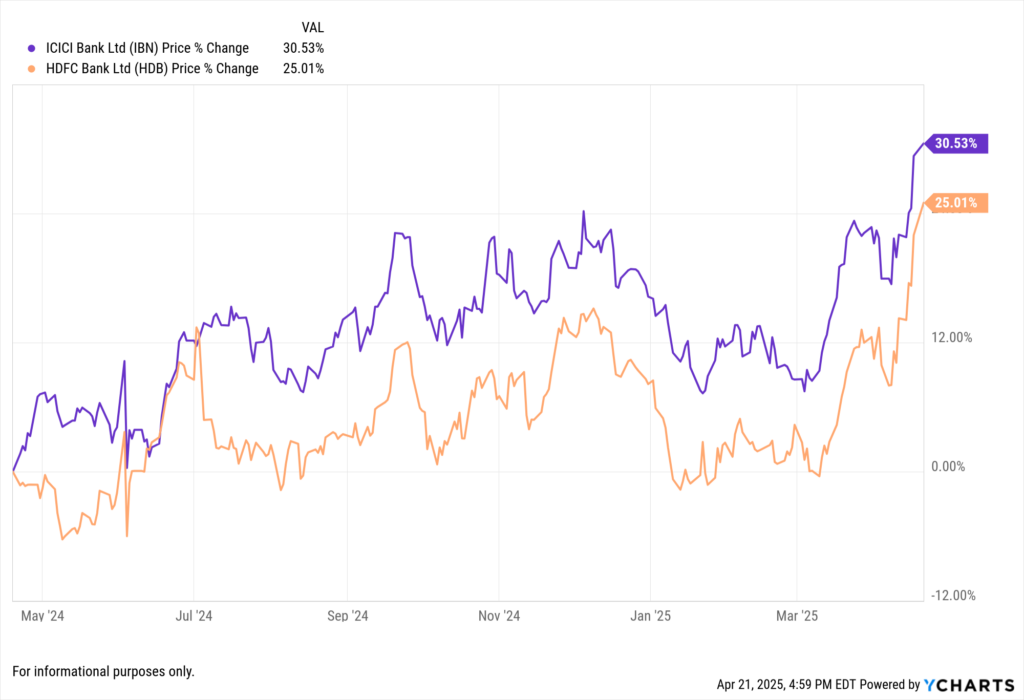
ICICI Bank posted a record quarterly profit of ₹126.30 billion ($1.48 billion), marking its seventh consecutive day of stock gains.
View ICICI Bank’s Earnings Report >
HDFC Bank reported robust loan growth and improved asset quality, with shares gaining 1.3%.
View HDFC Bank’s Earnings Report >
Analysts raised their price targets for both banks, citing strong lending margins and controlled credit costs.
TrustCo Bank Reports Q1 Net Income of $14.3 Million
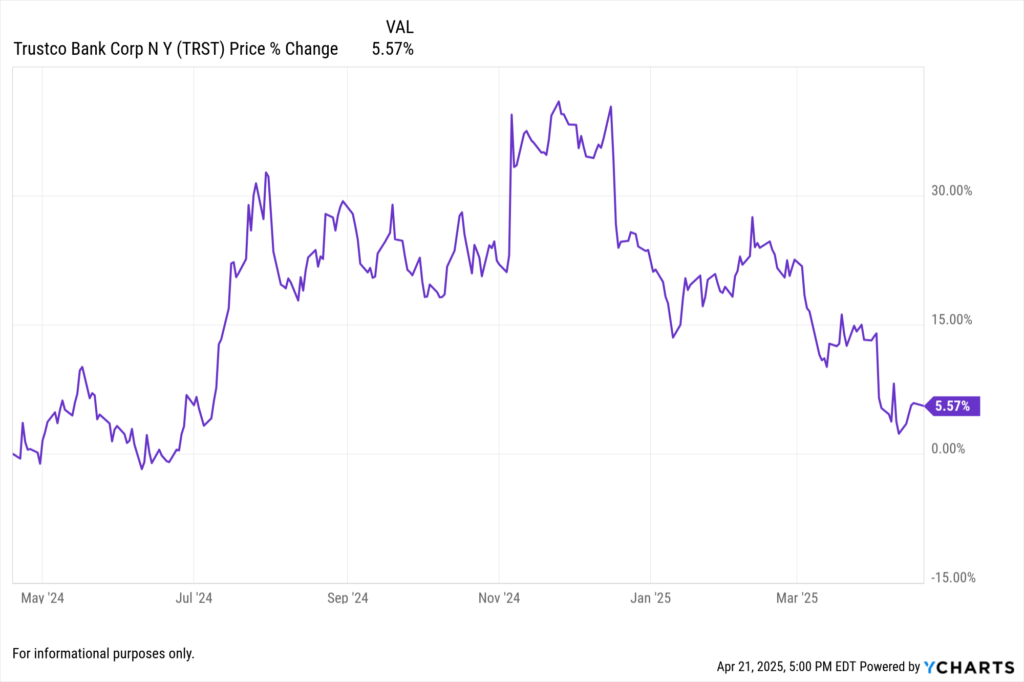
TrustCo’s net income increased 17.7% compared to the first quarter of 2024.
The bank reported net interest income of $40.4 million, up 10.4% year-over-year.
View TrustCo’s Earnings Report >
Average loans and deposits saw significant growth, reflecting a strong local economy and increased demand for credit.
April 15, 2025 Earnings
Morgan Stanley (MS) Reports Q1 Earnings
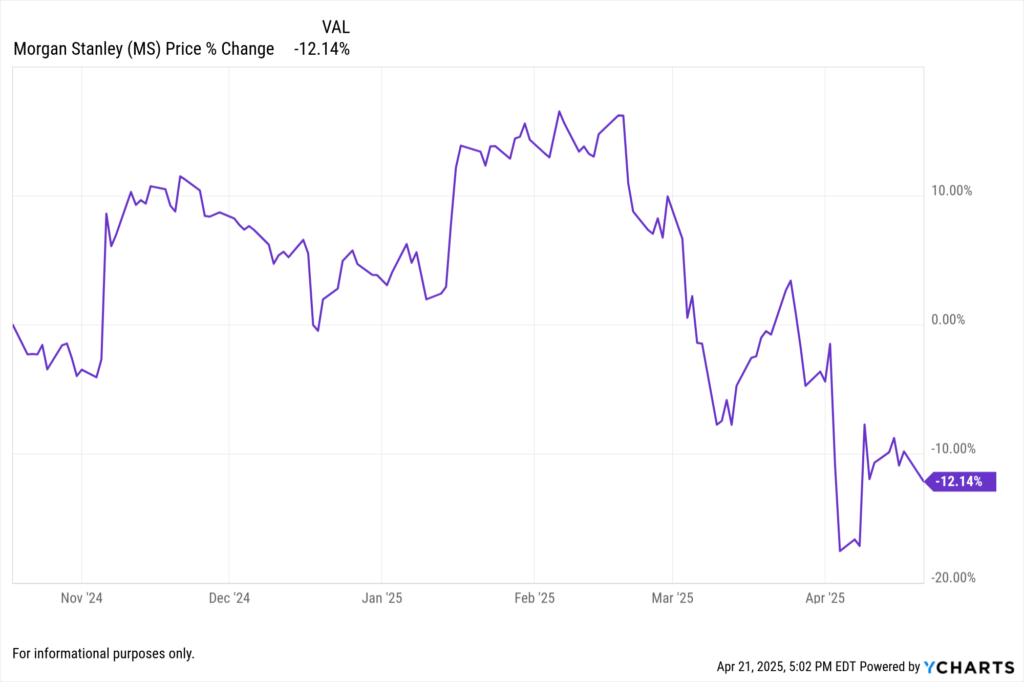
Morgan Stanley reported earnings of $2.60 per share, beating the Zacks Consensus Estimate of $2.23.
View Morgan Stanley’s Earnings Report >
The bank’s performance was bolstered by strong trading revenues.
April 14, 2025
JPMorgan Chase (JPM) Reports Strong Q1 Earnings
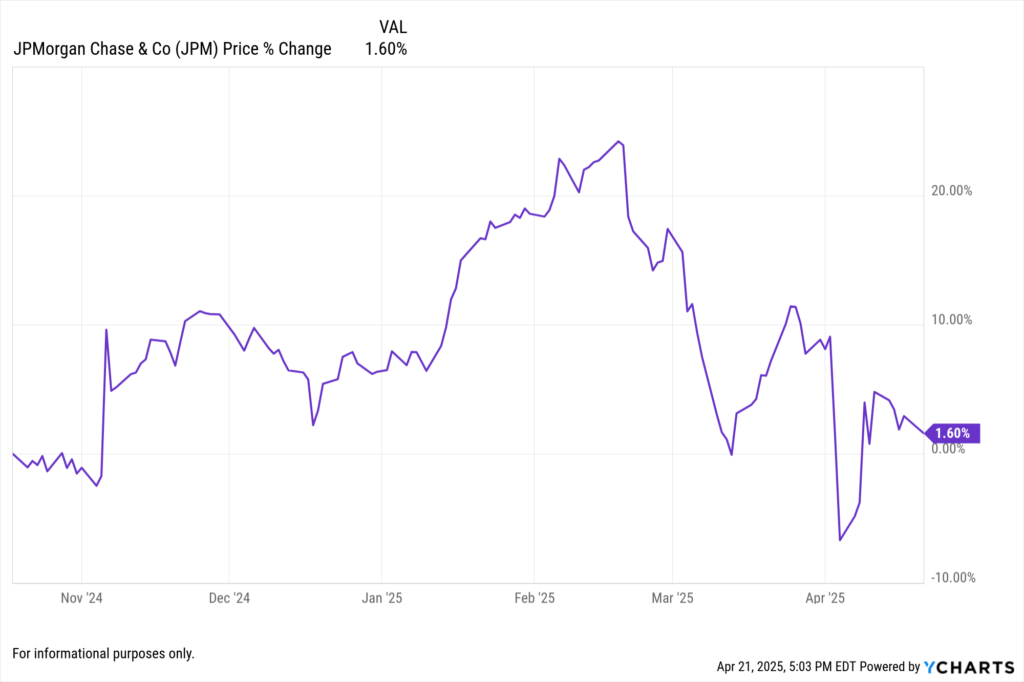
JPMorgan reported a net income of $14.6 billion, a 9% increase year-over-year, surpassing Wall Street expectations.
Earnings per share (EPS) rose to $5.07, beating the forecast of $4.63.
Revenue reached $46 billion, driven by a 21% increase in markets revenue and a 48% jump in equities revenue.
View JPMorgan Chase Earnings Report >
Despite strong results, CEO Jamie Dimon expressed concerns about global economic uncertainties, particularly escalating trade tensions.
Bank of America (BAC) and Citigroup (C) Beat Expectations
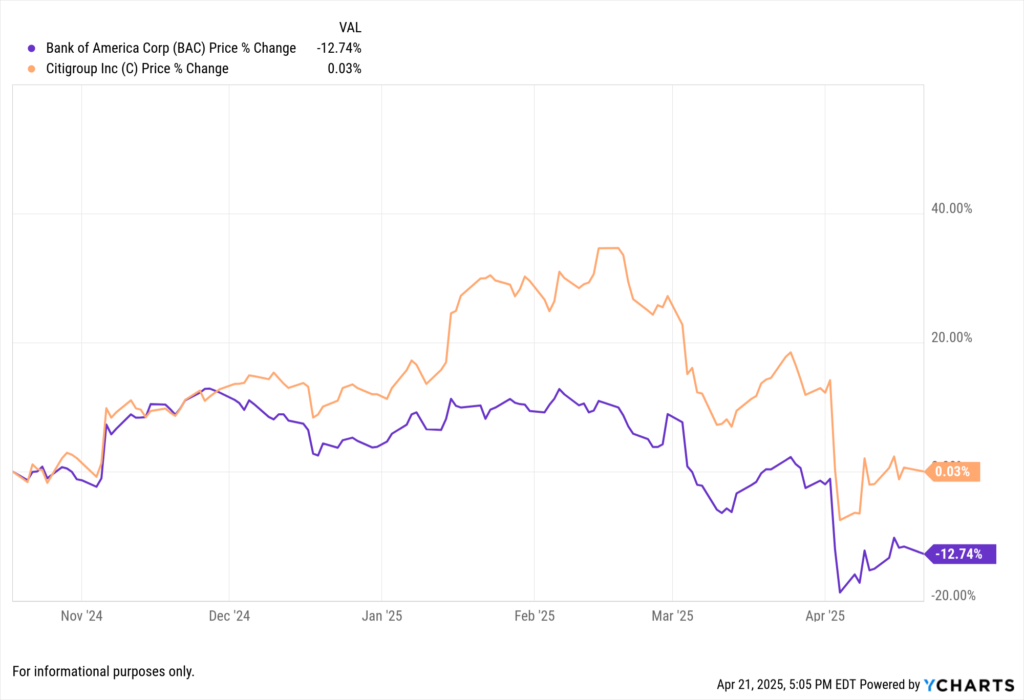
Bank of America reported EPS of $0.83, slightly above the consensus estimate of $0.81.
View Bank of America’s Earnings Report >
Citigroup reported EPS of $1.96, surpassing the forecast of $1.84.
View Citigroup’s Earnings Report >
Both banks benefited from increased stock trading activity, with BAC shares rising 4.5% and Citi shares gaining 3.8%.
YCharts Tools for Financial Sector Analysis
Fundamental Charts: Track performance metrics of financial institutions over time.
Holdings Overlap Tool: Identify concentration risks in financial sector ETFs.
Custom Reports: Generate client-ready visuals highlighting key financial trends.
Whenever you’re ready, here’s how YCharts can help you:
1. Looking to Move On From Your Investment Research and Analytics Platform?
2. Want to test out YCharts for free?
Start a no-risk 7-Day Free Trial.
Disclaimer
©2025 YCharts, Inc. All Rights Reserved. YCharts, Inc. (“YCharts”) is not registered with the U.S. Securities and Exchange Commission (or with the securities regulatory authority or body of any state or any other jurisdiction) as an investment adviser, broker-dealer or in any other capacity, and does not purport to provide investment advice or make investment recommendations. This report has been generated through application of the analytical tools and data provided through ycharts.com and is intended solely to assist you or your investment or other adviser(s) in conducting investment research. You should not construe this report as an offer to buy or sell, as a solicitation of an offer to buy or sell, or as a recommendation to buy, sell, hold or trade, any security or other financial instrument. For further information regarding your use of this report, please go to: ycharts.com/about/disclosure
Next Article
Q1 2025 Earnings Season Hub: Sector-by-Sector BreakdownRead More →