Q1 2025 Technology Sector Earnings: Live Updates & Market Reactions

Updated as of: May 1, 2025 @ 10:20AM CST
Introduction
The first wave of Q1 2025 earnings from the technology sector is offering valuable signals for investors and advisors alike. From chipmakers like TSMC and ASML, to streaming leaders such as Netflix, early results are showcasing resilience in margins, ongoing AI innovation, and shifting monetization strategies in media and software.
Several household names—Microsoft, Apple, Amazon, and Alphabet—are scheduled to report in the coming days. These earnings will be pivotal for assessing the broader direction of tech valuations, capital expenditures, and the future of cloud and AI infrastructure.
This live-updating tracker breaks down key earnings reports and call takeaways by day, highlights top-performing tech stocks, and provides actionable context for advisors monitoring the space.
Whether you’re adjusting sector allocations or fielding client questions, this post helps turn earnings headlines into strategic insights.
Latest Earnings Reports
YCharts users can view a full breakdown of all current and upcoming earnings calls and reports live here.
Not a YCharts user? Try a 7-Day Free Trial.
May 1, 2025 Earnings
Meta Platforms Inc. (META) Exceeds Q1 Expectations with Robust Advertising Revenue
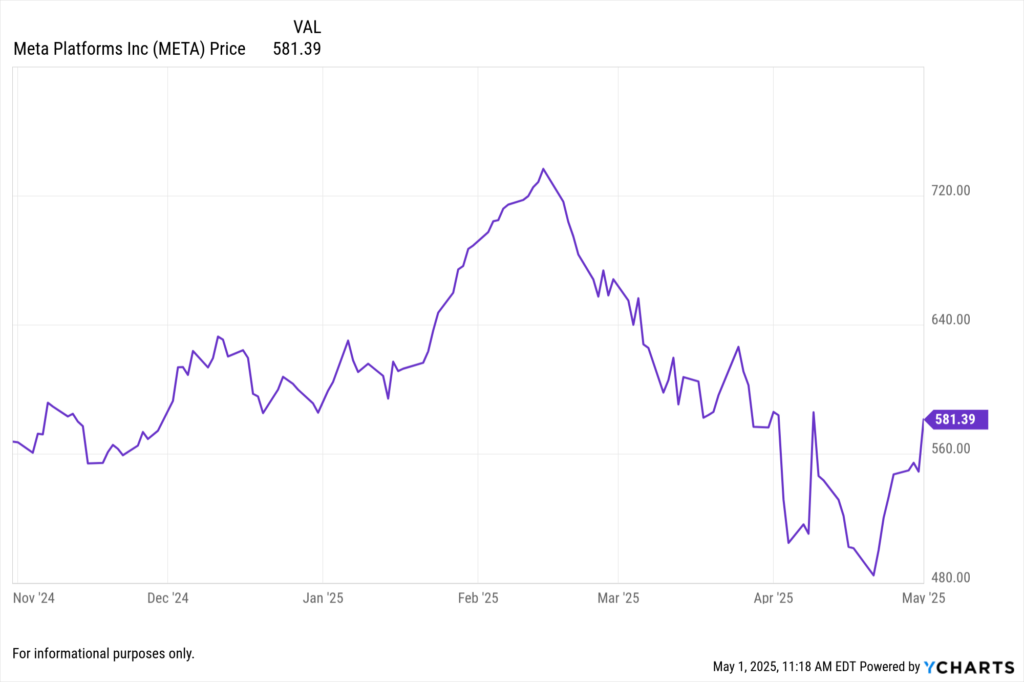
Meta Platforms reported Q1 2025 revenue of $42.3 billion, a 16% increase year-over-year, beating analyst forecasts. Net income was $11.6 billion, with diluted EPS of $4.39. The company’s advertising revenue grew 17% to $40.5 billion, driven by strong demand across its platforms. Meta’s Reality Labs division posted a loss of $4 billion, but the company remains committed to its long-term investments in the metaverse. Meta also announced a $50 billion share repurchase program.
View Meta’s Earnings Report Here >
April 30, 2025 Earnings
Microsoft Corp. (MSFT) Reports Strong Q3 FY2025 Results
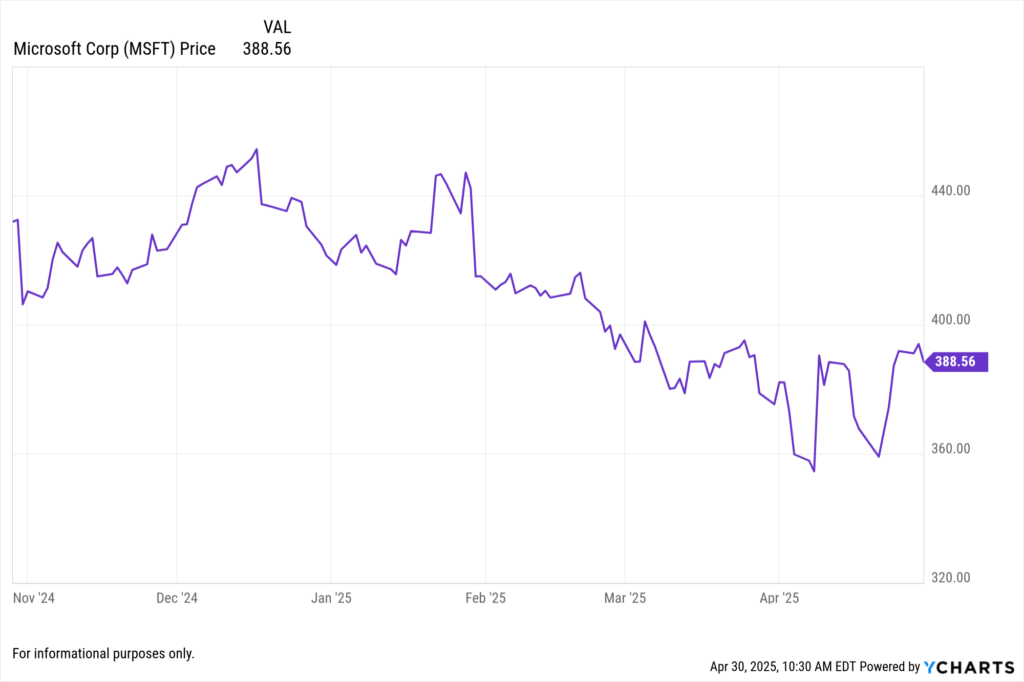
Microsoft reported Q3 FY2025 revenue of $68.44 billion, marking a 10.6% year-over-year increase. The Intelligent Cloud segment led the growth, driven by Azure’s 33% revenue increase. Productivity and Business Processes revenue rose by 12% to $28.3 billion, while More Personal Computing revenue saw a 2% uptick, aided by gaming revenue growth despite a 29% decline in Xbox hardware sales. The company returned $9.0 billion to shareholders through dividends and share repurchases during the quarter.
View Microsoft’s Earnings Report Here >
Qualcomm Inc. (QCOM) Achieves Record Q1 FY2025 Earnings
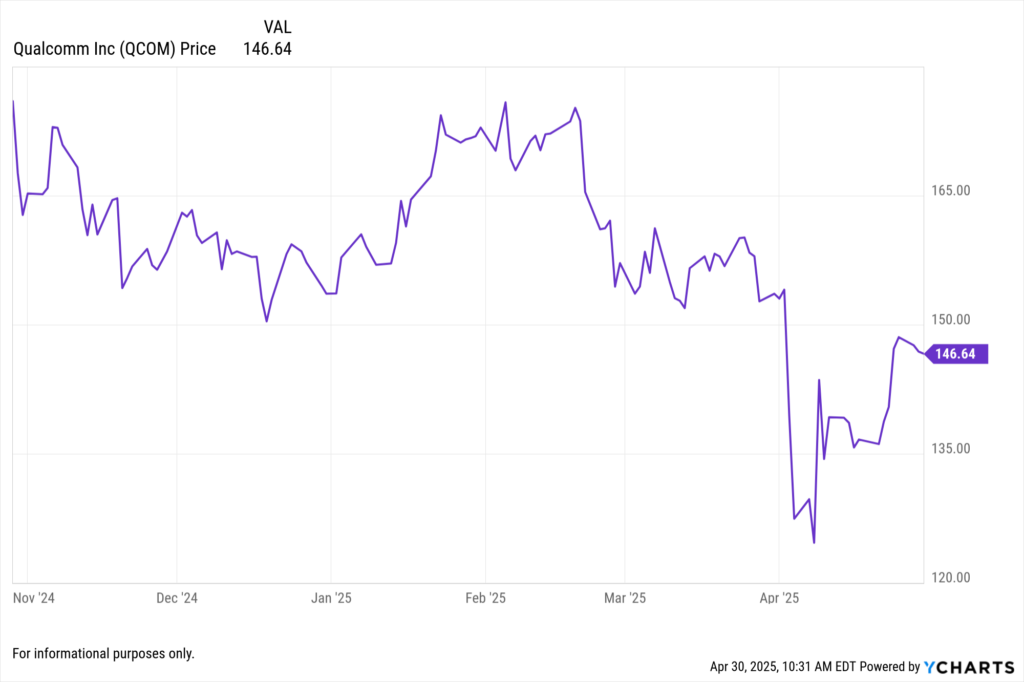
Qualcomm announced Q1 FY2025 revenue of $11.7 billion, with GAAP EPS of $2.83 and non-GAAP EPS of $3.41. The company returned $2.7 billion to shareholders, including $942 million in dividends and $1.8 billion through share repurchases.
View Qualcomm’s Earnings Report Here >
Super Micro Computer (SMCI) Lowers Q3 FY2025 Forecast Amid Delayed Orders
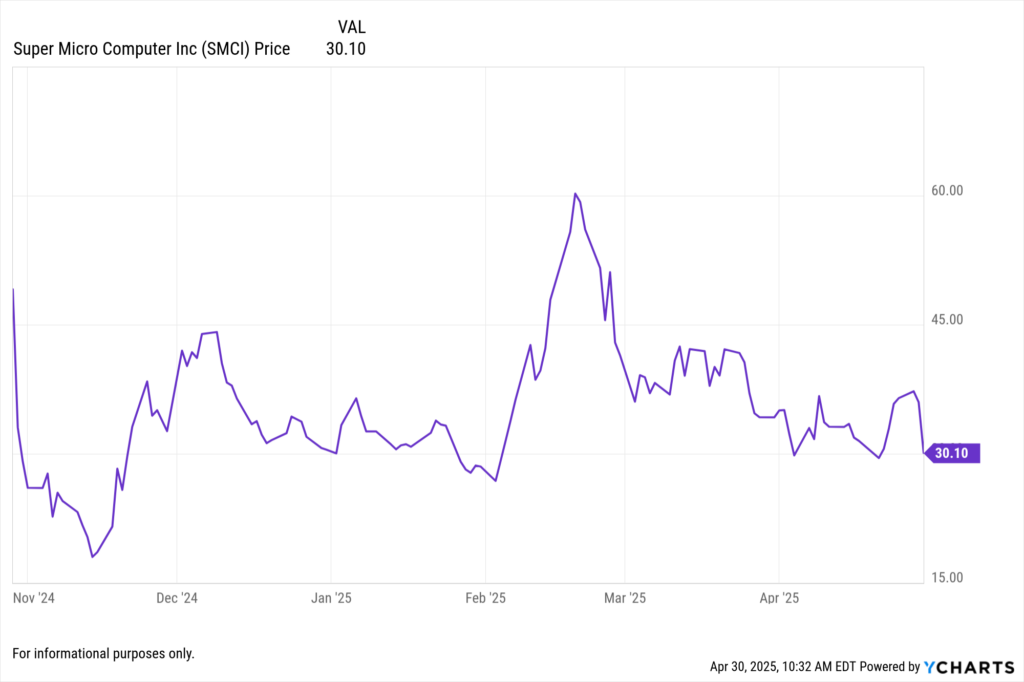
Super Micro Computer revised its Q3 FY2025 revenue forecast to $4.5–$4.6 billion, down from the previous $5.0–$6.0 billion estimate. The company attributed the reduction to delayed customer orders and higher inventory reserves on older-generation products, likely due to customers transitioning to Nvidia’s new Blackwell chips.
View Super Micro Computer’s Earnings Report Here >
April 29, 2025 Earnings
Seagate Technology Holdings PLC (STX) Exceeds Q3 FY2025 Expectations
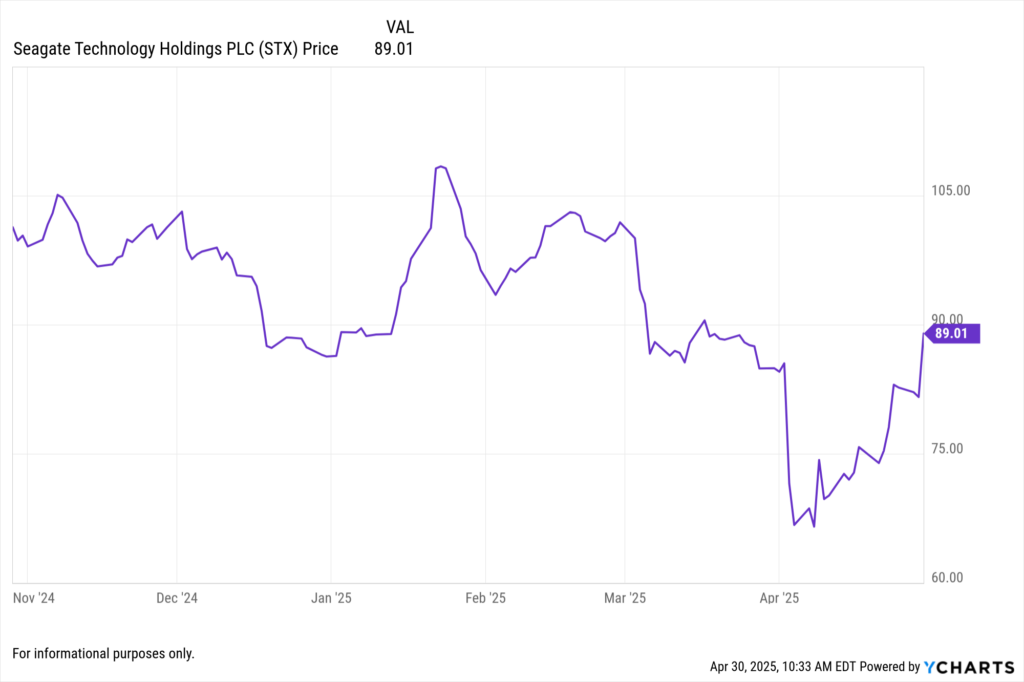
Seagate reported Q3 FY2025 revenue of $2.16 billion, a 30.5% year-over-year increase, surpassing analyst expectations. GAAP diluted EPS was $1.57, while non-GAAP diluted EPS reached $1.90. The company generated $259 million in cash flow from operations and returned $216 million to shareholders.
View Seagate Technology’s Earnings Report Here >
Logitech International SA (LOGI) Reports Q4 FY2025 Results
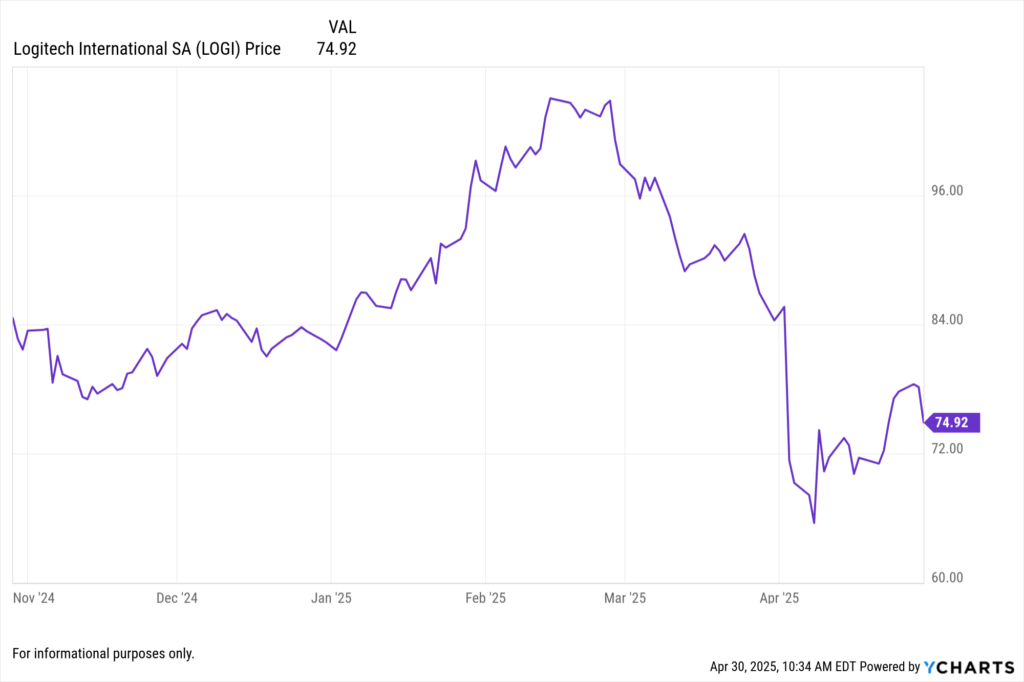
Logitech announced Q4 FY2025 sales of $1.01 billion, flat in U.S. dollars and up 2% in constant currency compared to the prior year. GAAP operating income was $106 million, and non-GAAP operating income was $133 million. GAAP EPS stood at $0.93, with non-GAAP EPS at $1.16. The company highlighted broad-based sales growth and increased profitability for the full fiscal year.
View Logitech’s Earnings Report Here >
April 28, 2025 Earnings
Roper Technologies Inc. (ROP) Delivers Q1 FY2025 Growth
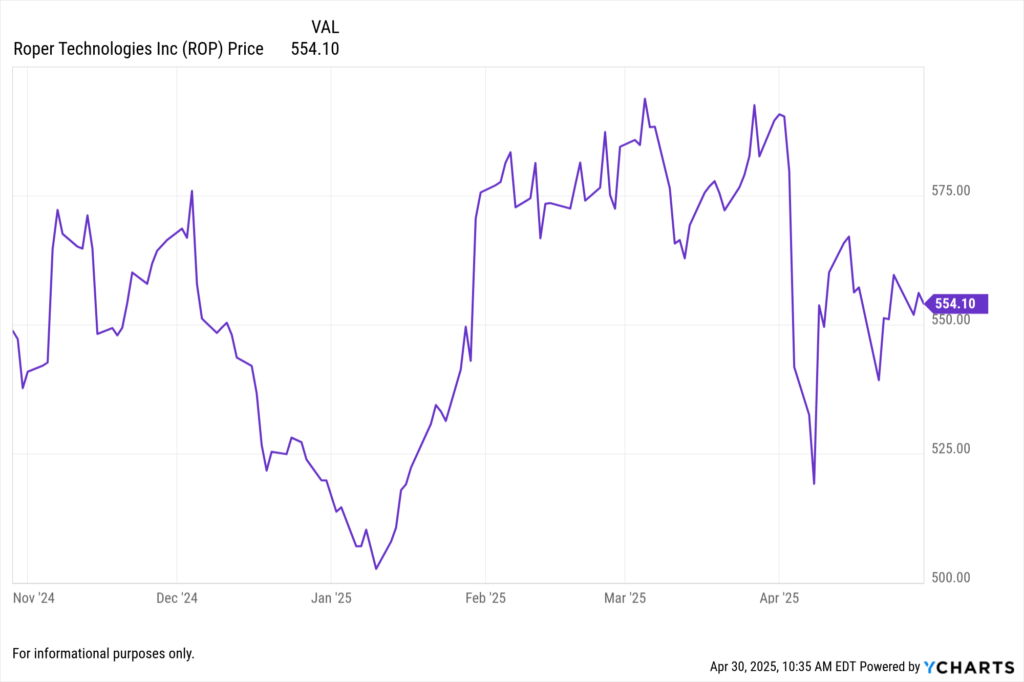
Roper Technologies reported Q1 FY2025 revenue of $1.88 billion, a 12% increase year-over-year, with 8% attributed to acquisitions and 5% to organic growth. GAAP net earnings decreased 13% to $331 million, while adjusted earnings per share exceeded forecasts.
View Roper Technologies’ Earnings Report Here >
NXP Semiconductors NV (NXPI) Announces Q1 FY2025 Results and CEO Transition
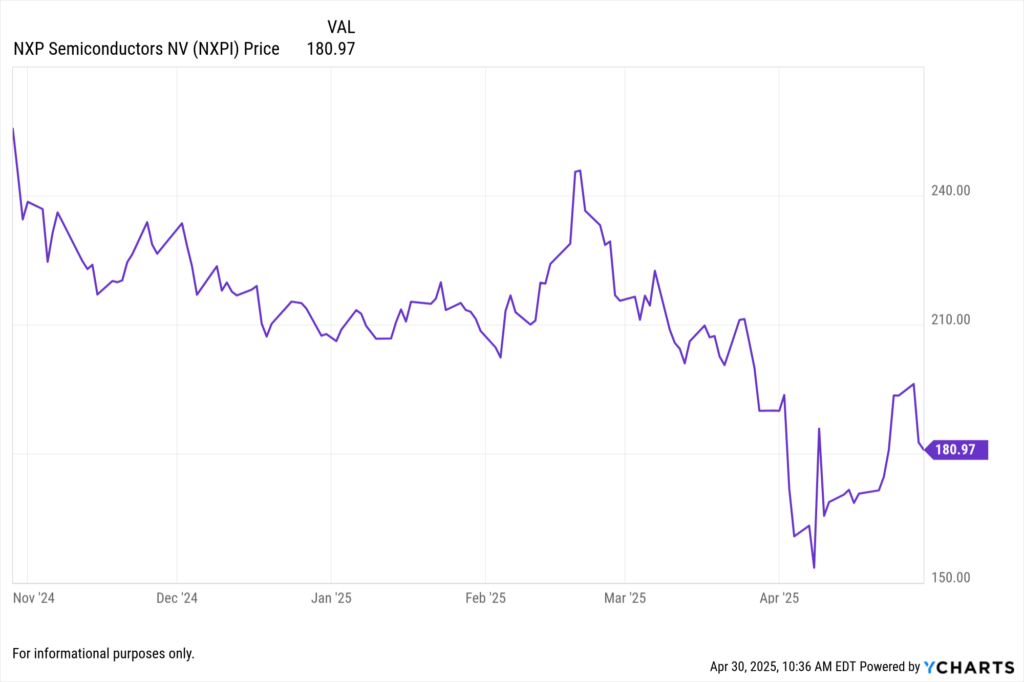
NXP Semiconductors reported Q1 FY2025 revenue of $2.84 billion, surpassing analyst estimates. GAAP gross profit was $1.58 billion. The company announced that CEO Kurt Sievers will retire at the end of the year, citing an uncertain operating environment influenced by tariffs.
View NXP Semiconductors’ Earnings Report Here >
April 23, 2025 Earnings
International Business Machines Corp. (IBM) to Announce Q1 Earnings Post-Market
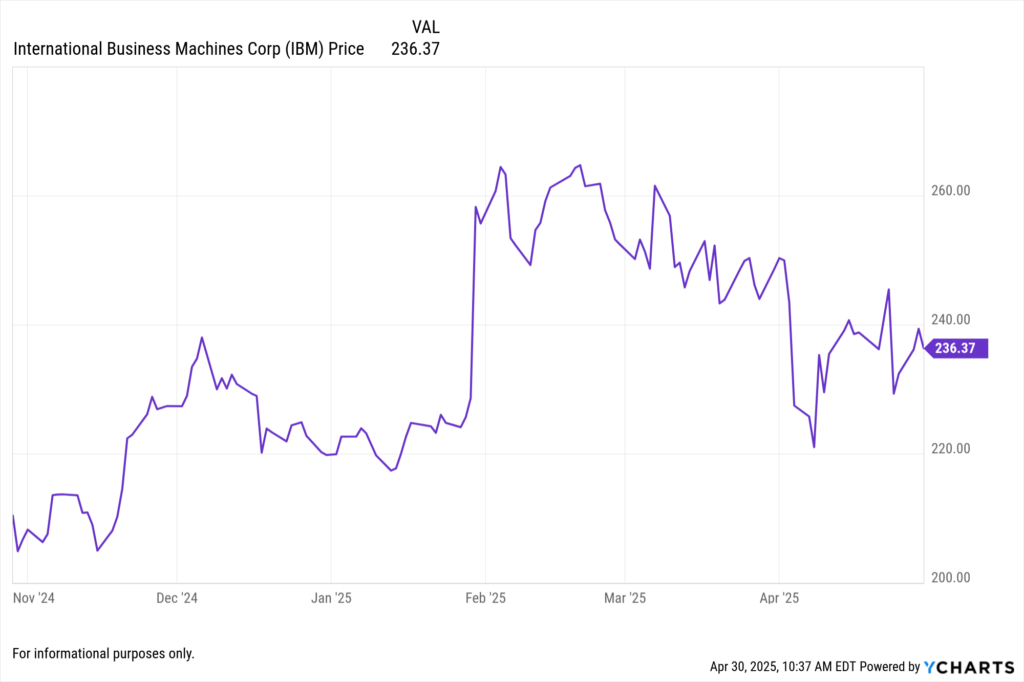
IBM is scheduled to release its Q1 2025 earnings results after the market close on April 23, 2025. Analysts estimate earnings of $1.43 per share for the quarter, compared to $1.68 per share in the prior-year period. Revenues are expected to increase modestly to $14.39 billion.
View International Business Machines Corp’s Earnings Report Here >
ServiceNow Inc. (NOW) to Release Q1 Financial Results After Market Close
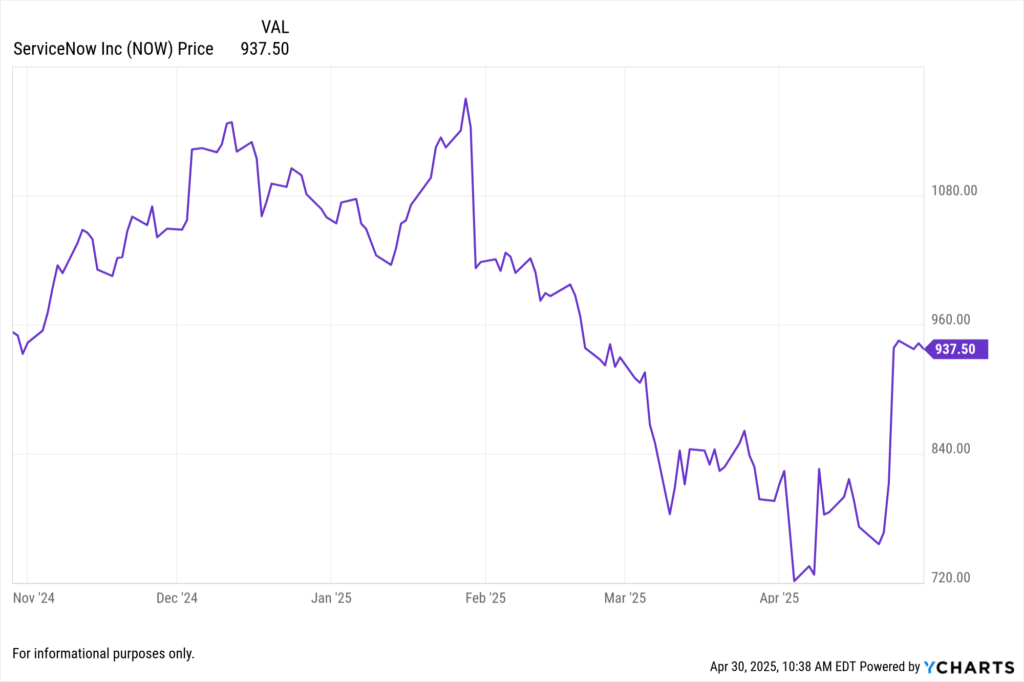
ServiceNow is set to announce its Q1 2025 financial results following the market close on April 23, 2025. The company will host a conference call and live webcast to discuss the financial results.
View ServiceNow’s Earnings Report Here >
United Microelectronics Corp. (UMC) Reports Q1 Net Income Decline Despite Revenue Growth
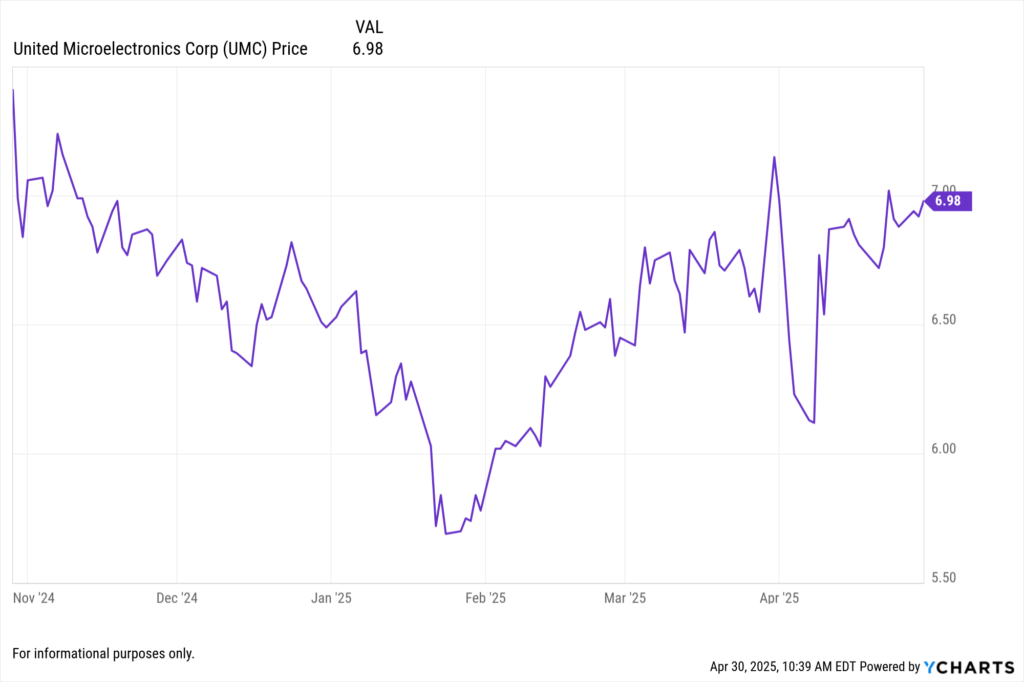
United Microelectronics reported Q1 2025 net income of NT$7.78 billion, a 25.6% decrease from the previous year. Earnings per ordinary share were NT$0.62, down from NT$0.84. First-quarter revenue increased by 5.9% year-over-year to NT$57.86 billion.
View United Microelectronics Corp’s Earnings Report Here >
April 18, 2025 Earnings
Taiwan Semiconductor (TSM) Reaffirms 2025 Outlook After 42% Revenue Surge
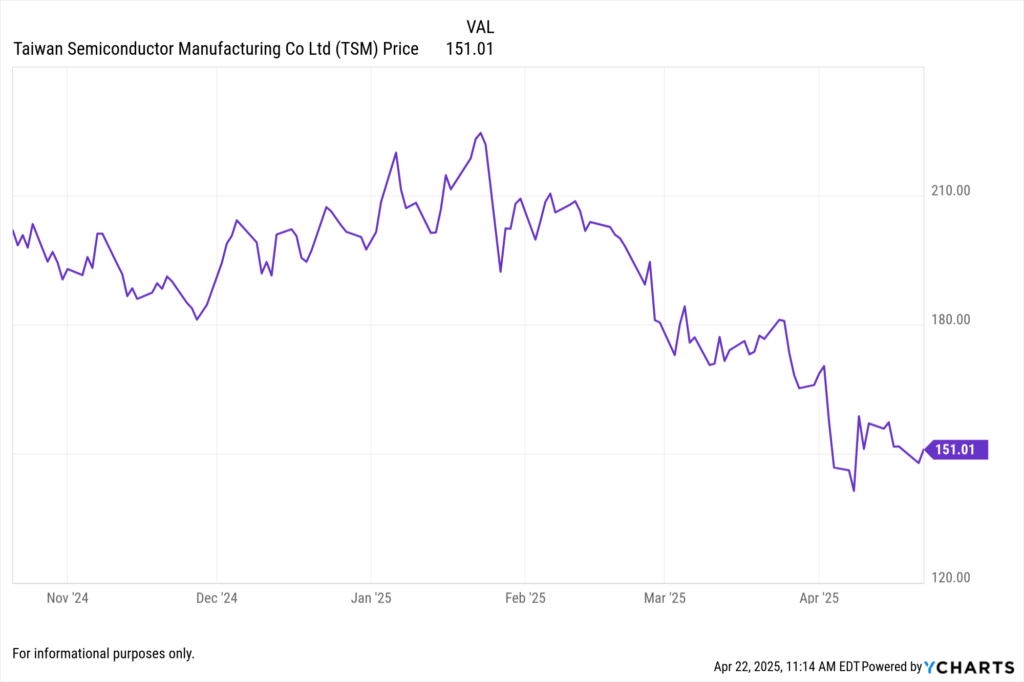
TSM reported strong Q1 2025 results with revenue rising 42% year-over-year and reaffirmed its 2025 revenue forecast, boosting its U.S.-listed shares. The firm reported EPS of 13.94 New Taiwan dollars ($0.43) on revenue that rose 42% year-over-year to NT$839.25 billion ($25.85 billion), topping estimates.
April 17, 2025 Earnings
Netflix Inc (NFLX) Focuses on Profitability Over Subscribers, Beats EPS
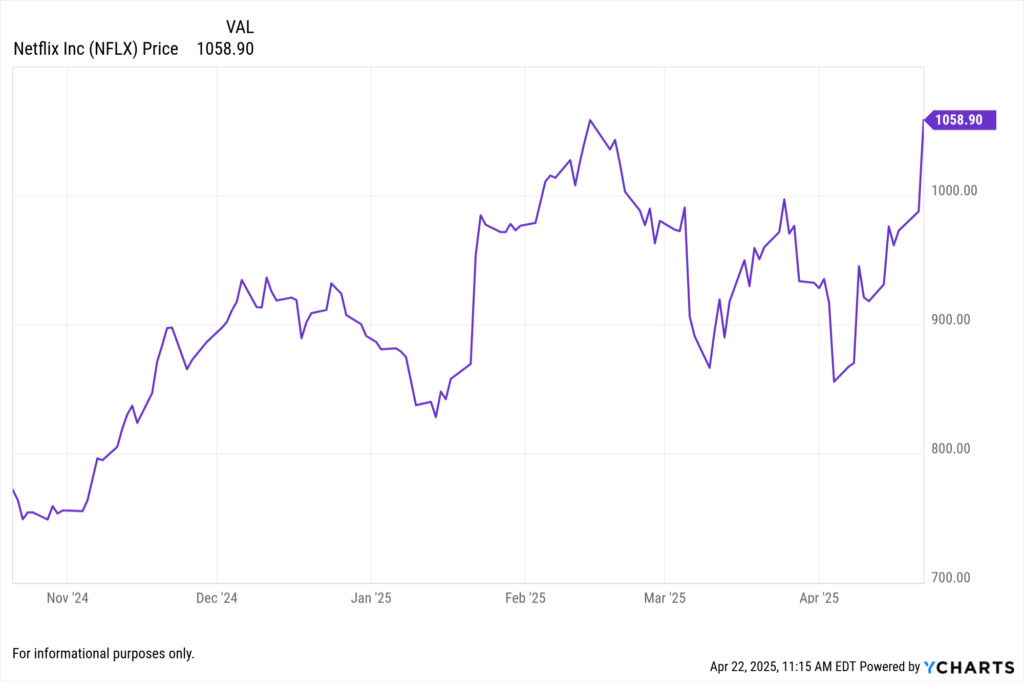
Netflix reported Q1 2025 earnings with earnings per share rising 25% to $6.61, surpassing analysts’ projections of $5.68. Revenue grew 13% to $10.5 billion, in line with estimates. Notably, this was Netflix’s first earnings report that did not include quarterly subscriber numbers, shifting focus to advertising and new content strategies.
April 16, 2025 Earnings
ASML Holding NV (ASML) Delivers Solid Beat as Chip Equipment Demand Holds
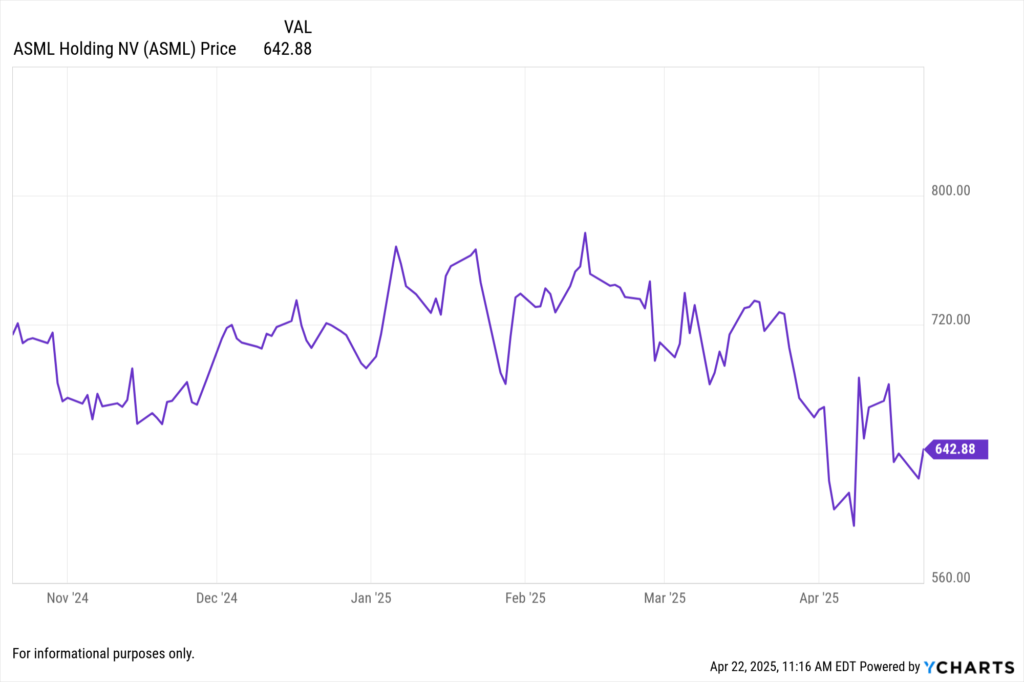
ASML reported Q1 2025 earnings with a net income of $9.332 billion and a normalized diluted EPS of $23.73. Revenue reached $32.95 billion, marking a 1.00% annual EPS surprise.
Infosys Ltd (INFY) Posts Modest Growth, Topping EPS Forecasts
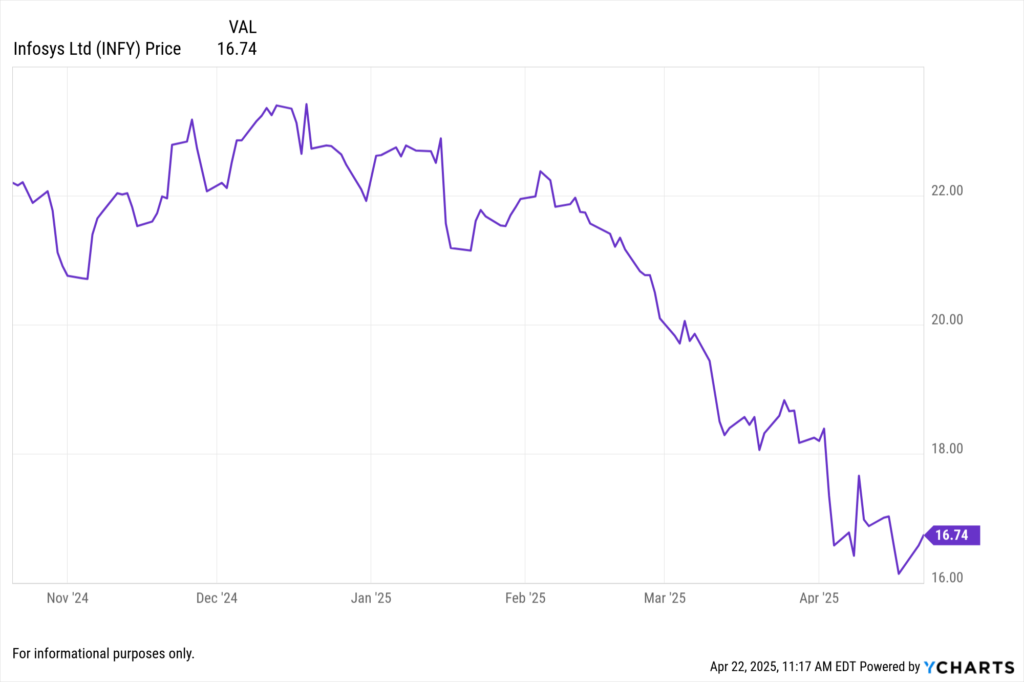
Infosys announced Q1 2025 earnings, reporting a net income of $3.157 billion and a normalized diluted EPS of $0.7564. Revenue stood at $19.28 billion, resulting in a 1.14% annual EPS surprise.
How YCharts Can Help
YCharts provides a suite of tools to analyze and visualize earnings data:
Fundamental Charts: Track revenue, EPS, and other key metrics over time.
Stock Screeners: Filter companies based on earnings surprises and growth rates.
Custom Reports: Generate client-ready reports with the latest earnings data.
Whenever you’re ready, here’s how YCharts can help you:
1. Looking to Move On From Your Investment Research and Analytics Platform?
2. Want to test out YCharts for free?
Start a no-risk 7-Day Free Trial.
Disclaimer
©2025 YCharts, Inc. All Rights Reserved. YCharts, Inc. (“YCharts”) is not registered with the U.S. Securities and Exchange Commission (or with the securities regulatory authority or body of any state or any other jurisdiction) as an investment adviser, broker-dealer or in any other capacity, and does not purport to provide investment advice or make investment recommendations. This report has been generated through application of the analytical tools and data provided through ycharts.com and is intended solely to assist you or your investment or other adviser(s) in conducting investment research. You should not construe this report as an offer to buy or sell, as a solicitation of an offer to buy or sell, or as a recommendation to buy, sell, hold or trade, any security or other financial instrument. For further information regarding your use of this report, please go to: ycharts.com/about/disclosure
Next Article
Breaking Open the Black Box: Introducing Transparent, Customizable Risk ProfilesRead More →