Q1 2025 Consumer Discretionary Earnings: Live Updates & Market Reactions

Updated as of: April 30, 2025 @ 11:10AM CST
Introduction: Navigating Consumer Discretionary Earnings Amid Market Volatility
The Q1 2025 earnings season is underway, and all eyes are on the Consumer Discretionary sector for clues about the strength of consumer demand, housing trends, and discretionary spending habits. From auto manufacturers and homebuilders to luxury goods and retailers, earnings results this quarter are shaping market sentiment and portfolio positioning.
This blog is a live-updating tracker of major Consumer Discretionary earnings reports as they’re released. Updated daily, it delivers timely data and financial insights for advisors, asset managers, and institutional investors. We’re breaking down revenue and EPS results, performance surprises, management commentary, and YCharts-suggested visuals to help you uncover themes and opportunities across the sector.
Bookmark this page and check back regularly as new companies report and the earnings picture evolves across the remainder of the Q1 season.
Latest Earnings Reports
YCharts users can view a full breakdown of all current and upcoming earnings calls and reports live here.
Not a YCharts user? Try a 7-Day Free Trial.
April 30, 2025 Earnings
Penske Automotive Group Inc. (PAG) Posts Strong Q1 Earnings Amidst Evolving Auto Market
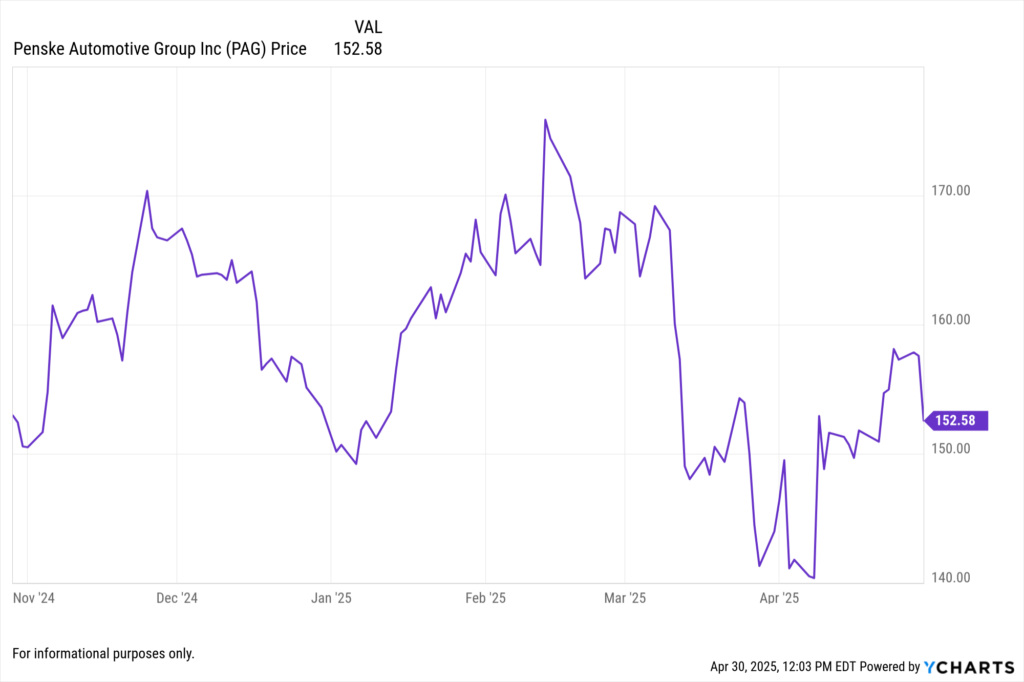
Penske Automotive Group reported Q1 2025 earnings per share (EPS) of $3.66, surpassing analyst expectations of $3.28. Net income increased by 14% year-over-year to $244.3 million, while revenue rose 2.1% to $7.6 billion. The company’s performance was bolstered by a robust brand mix and a flexible cost structure, enabling it to navigate the changing automotive landscape effectively.
View Penske Automotive’s Earnings Report Here >
eBay Inc. (EBAY) Reports Solid Q1 Results with Stable Margins and EPS Beat
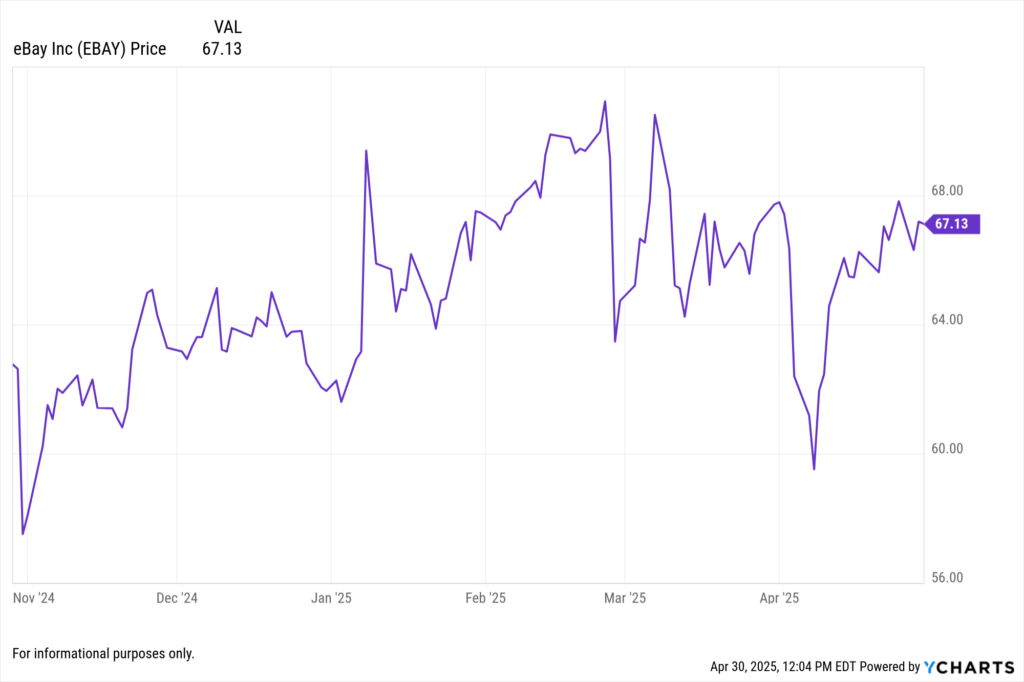
eBay reported Q1 2025 revenue of $2.56 billion, marking a 2.5% increase year-over-year and in line with analyst expectations. Net income for the trailing twelve months reached $1.975 billion, with normalized diluted EPS of $4.015 and an annual EPS surprise of +0.90%. The company posted adjusted EPS of $1.14 for the quarter, slightly exceeding consensus forecasts. eBay highlighted stability in take rate, continued growth in advertising revenues, and progress on cost efficiency initiatives.
View eBay’s Earnings Report Here >
April 29, 2025 Earnings
Starbucks Corp. (SBUX) Reports Decline in Q1 Earnings Amid Turnaround Efforts
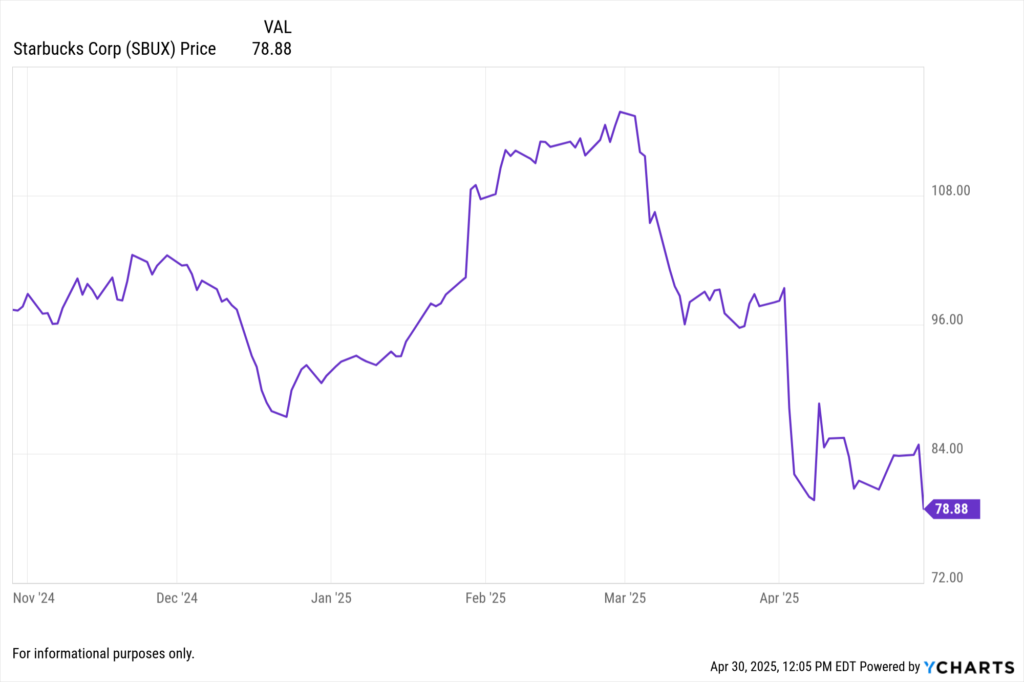
Starbucks reported Q1 2025 revenue of $8.76 billion, a 2% increase year-over-year. Adjusted EPS fell to $0.41, missing analyst expectations of $0.49. The company experienced a 1% decline in global same-store sales, with U.S. sales down 2% and international sales up 2%. CEO Brian Niccol emphasized ongoing turnaround strategies, including staffing enhancements, menu simplification, and improved customer experience initiatives.
View Starbucks’ Earnings Report Here >
Hilton Worldwide Holdings Inc. (HLT) Exceeds Q1 Earnings Expectations but Lowers Full-Year Outlook
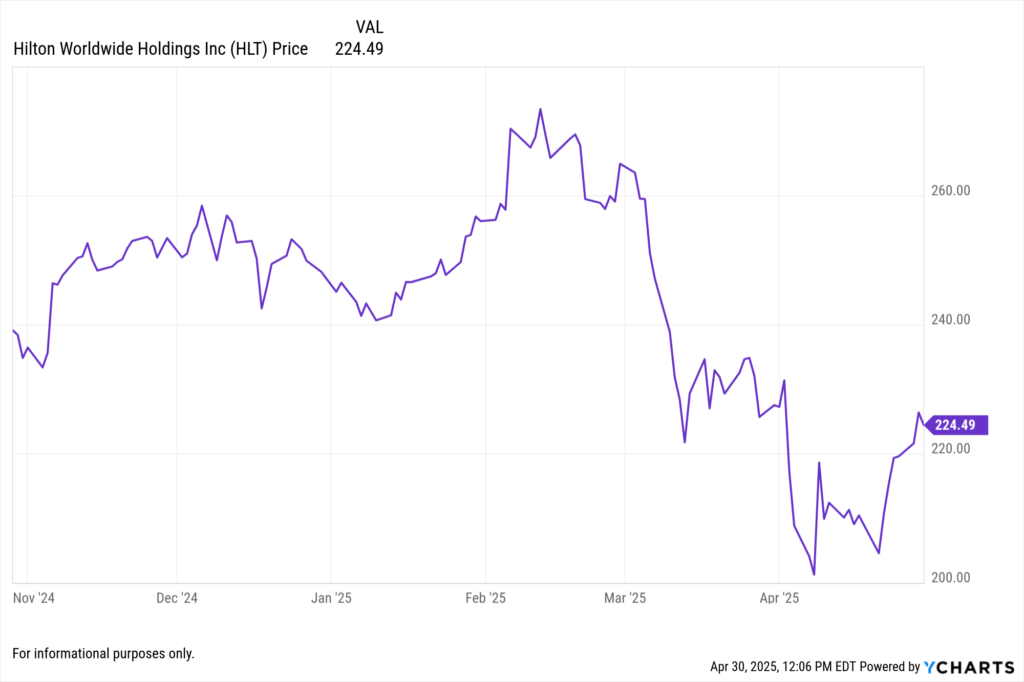
Hilton Worldwide reported Q1 2025 adjusted EPS of $1.72, surpassing analyst estimates of $1.61. Revenue increased by 4.7% year-over-year to $2.70 billion. However, the company revised its full-year revenue per available room (RevPAR) growth forecast to 0–2%, down from the previous 2–3%, citing economic uncertainties and reduced discretionary spending on travel.
View Hilton’s Earnings Report Here >
Booking Holdings Inc. (BKNG) Delivers Strong Q1 Results Driven by International Travel Demand
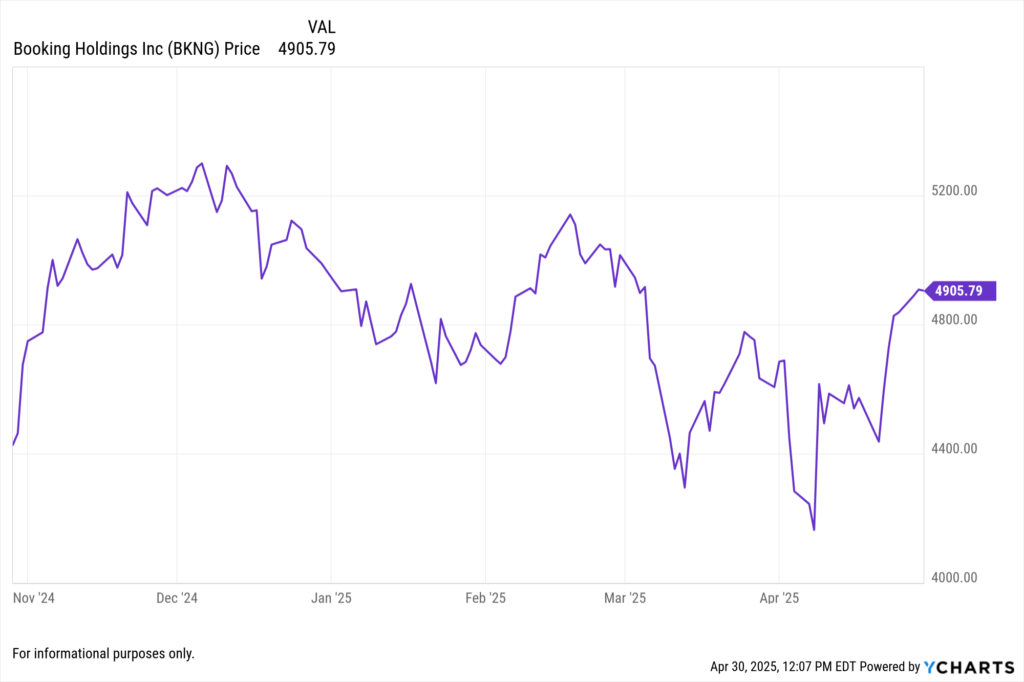
Booking Holdings reported Q1 2025 adjusted EPS of $24.81, significantly exceeding analyst expectations of $17.34. Revenue reached $4.76 billion, an 8% increase year-over-year. The company’s performance was propelled by a 7% rise in gross bookings to $46.7 billion and a 7% increase in room nights booked, reflecting robust international travel demand, particularly in Southeast Asia.
View Booking Holdings’ Earnings Report Here >
April 23, 2025 Earnings
Travel + Leisure Co. (TNL) Reports Strong Q1 Results Driven by Vacation Ownership Growth
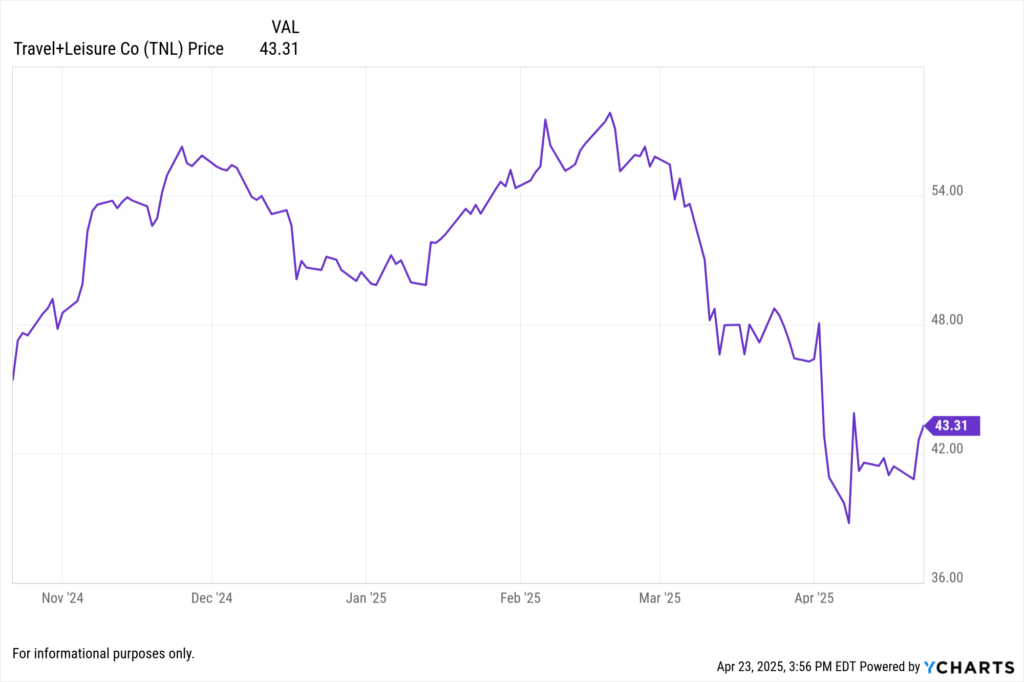
Travel + Leisure Co. announced Q1 2025 revenue of $1.05 billion, a 7% increase year-over-year, and adjusted EBITDA of $230 million. The company reported adjusted diluted EPS of $1.12, surpassing analyst expectations. Growth was primarily driven by increased vacation ownership sales and higher occupancy rates across its resorts.
View Travel + Leisure Co’s Earnings Report Here >
Taylor Morrison Home Corp. (TMHC) Achieves Record Q1 Revenue Amid Strong Housing Demand
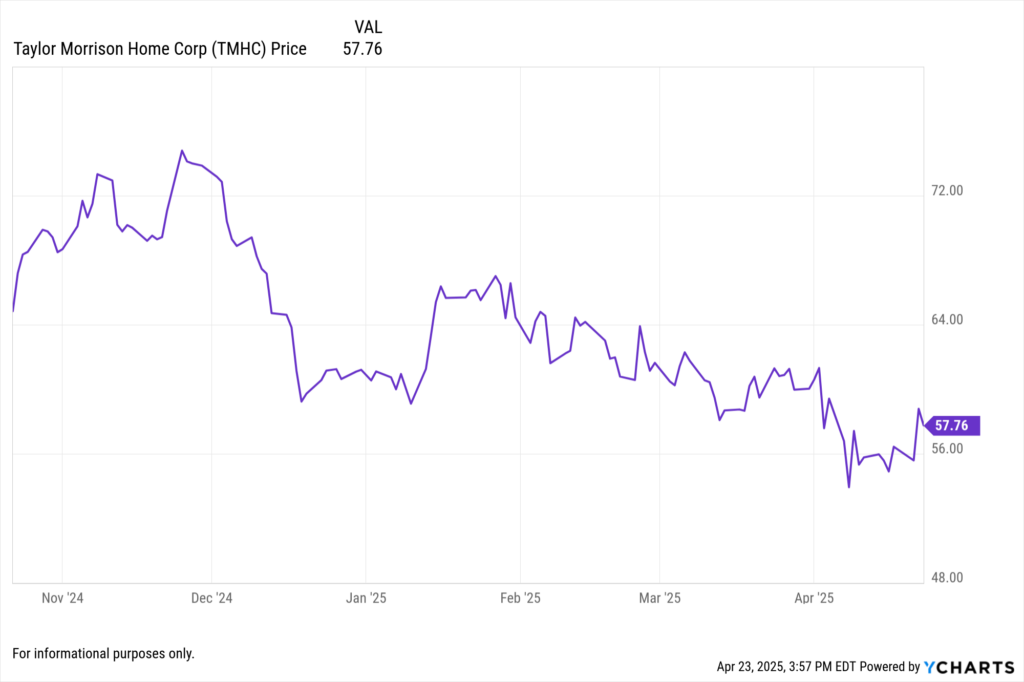
Taylor Morrison reported Q1 2025 revenue of $1.8 billion, marking a 10% increase from the prior year. Net income rose to $150 million, or $1.45 per diluted share, exceeding analyst estimates. The company attributed its performance to robust demand in key markets and effective cost management strategies.
View Taylor Morrison Home Corp’s Earning Report >
NVR Inc. (NVR) Experiences Profit Decline Amid Housing Market Challenges
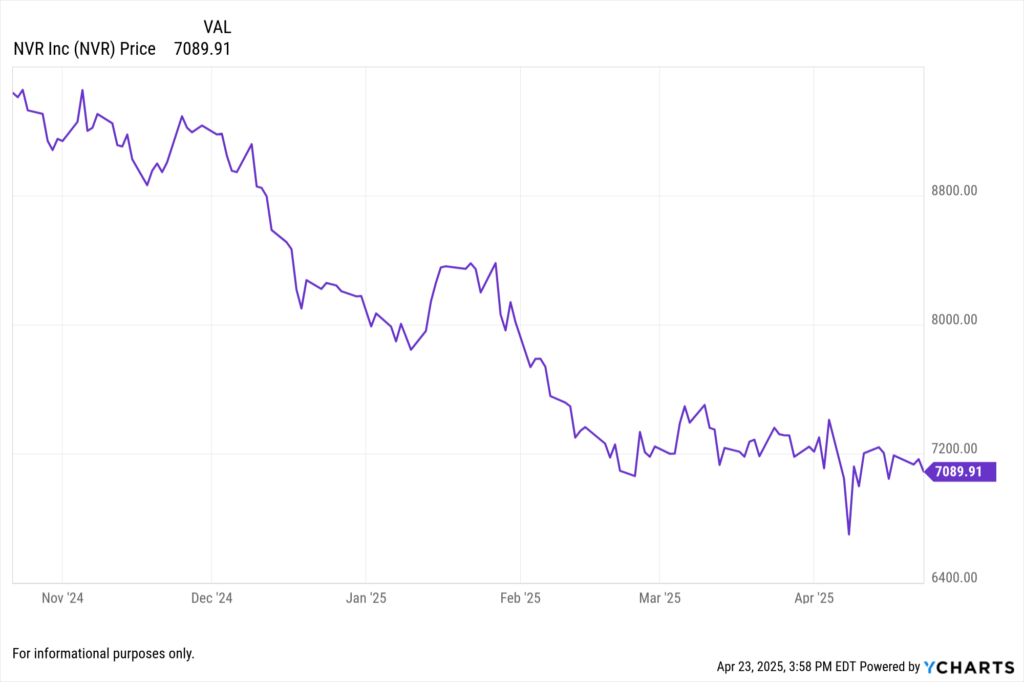
NVR Inc. reported Q1 2025 revenue of $2.4 billion, a 3% increase year-over-year. However, net income decreased by 24% to $299.6 million, or $94.83 per share, due to higher lot costs and pricing pressures. Gross profit margin declined to 21.9% from 24.5% in Q1 2024, reflecting ongoing challenges in the housing market.
View NVR Inc’s Earnings Report Here >
Las Vegas Sands Corp. (LVS) Reports Q1 Revenue Growth Led by Singapore Operations
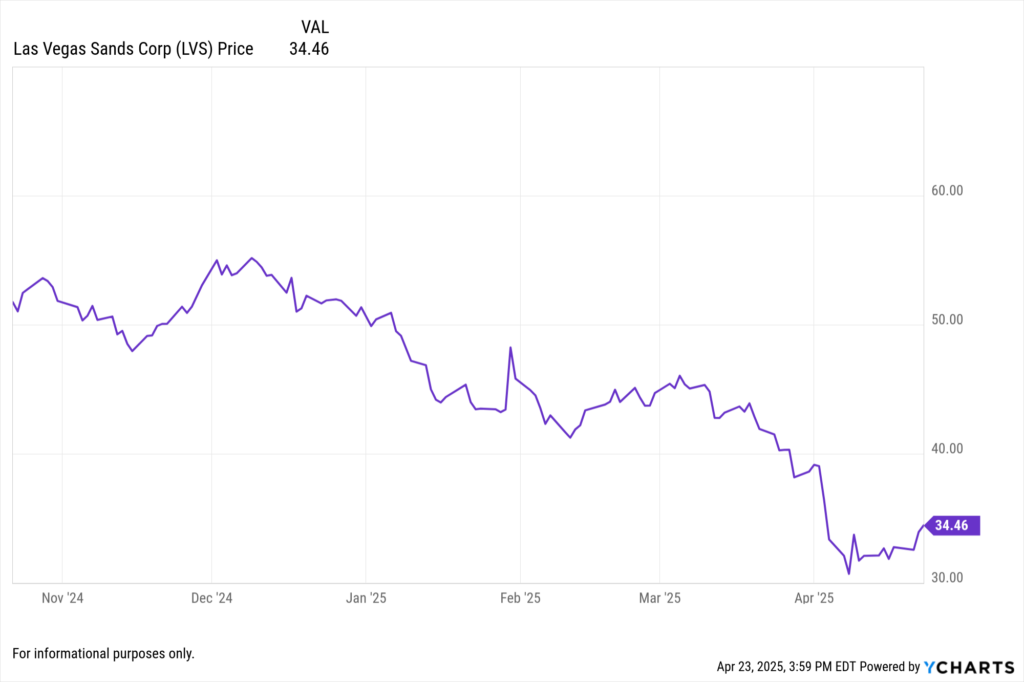
Las Vegas Sands announced Q1 2025 revenue of $2.85 billion, a 12% increase year-over-year, with adjusted EBITDA of $1.1 billion. The company’s Marina Bay Sands property in Singapore was a significant contributor to the growth, offsetting softer performance in Macau due to ongoing travel restrictions.
View Las Vegas Sands Corp’s Earnings Report Here >
LVMH Moët Hennessy Louis Vuitton SE (LVMUY) Faces Q1 Sales Decline Amid Global Economic Uncertainty
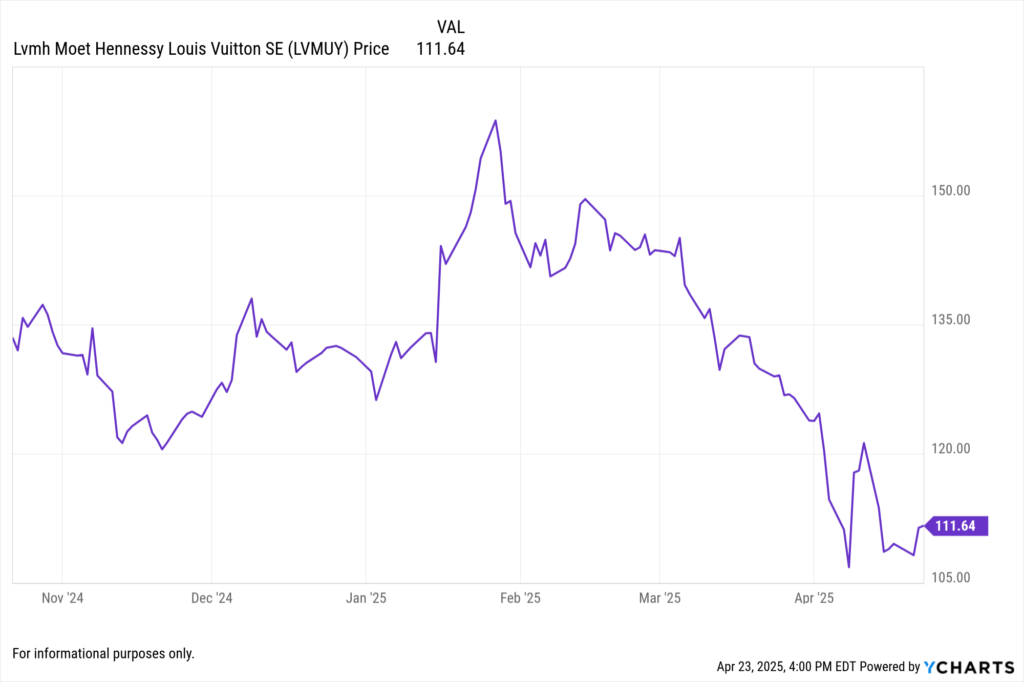
LVMH reported Q1 2025 revenue of €20.3 billion ($23.08 billion), a 3% decline year-over-year, missing analyst expectations. The fashion and leather goods division saw a 5% drop in sales, impacted by economic slowdowns in key markets and new tariffs on European imports. Sales in the U.S. and Asia (excluding Japan) declined by 3% and 11%, respectively.
View LVMH Moët Hennessy Louis Vuitton SE’s Earnings Report Here >
April 22, 2025 Earnings
Tesla Inc. (TSLA) Reports Decline in Earnings Amid Delivery Challenges
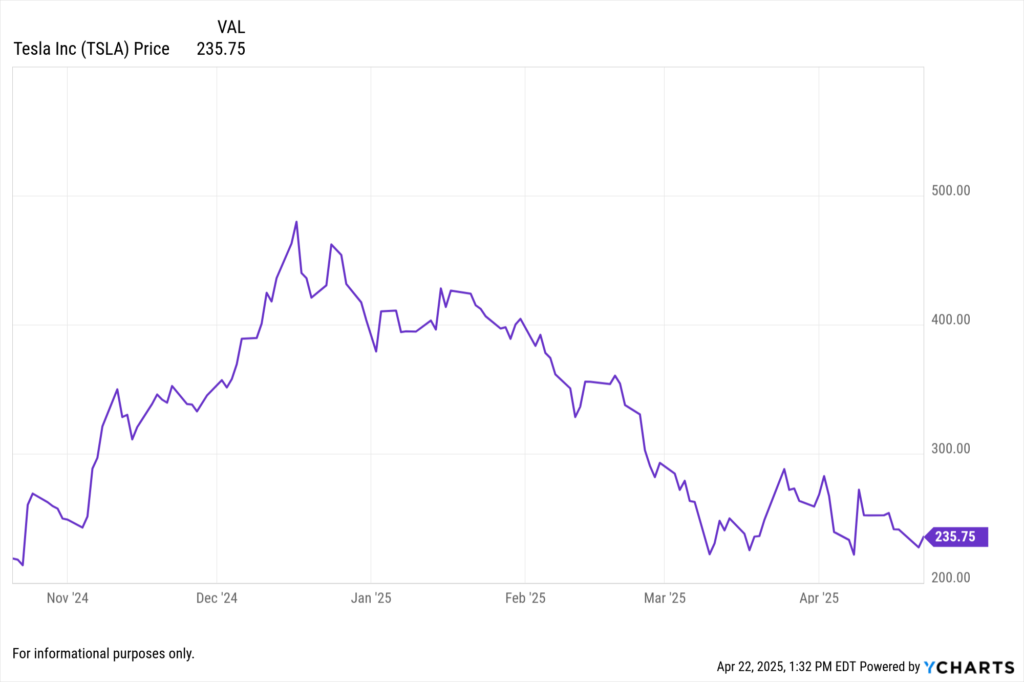
Tesla reported Q1 2025 earnings net income of $7.13 billion (TTM), normalized diluted EPS of $2.195 (TTM), and revenue of $97.69 billion (TTM). The company faced a 13% year-over-year decline in vehicle deliveries, totaling 336,681 units, marking its weakest quarter in three years. Factors contributing to this performance include production adjustments and intensified global competition. The annual EPS surprise stood at -2.42%.
View Tesla’s Earnings Report Here >
PulteGroup Inc. (PHM) Beats Estimates with Strategic Incentives
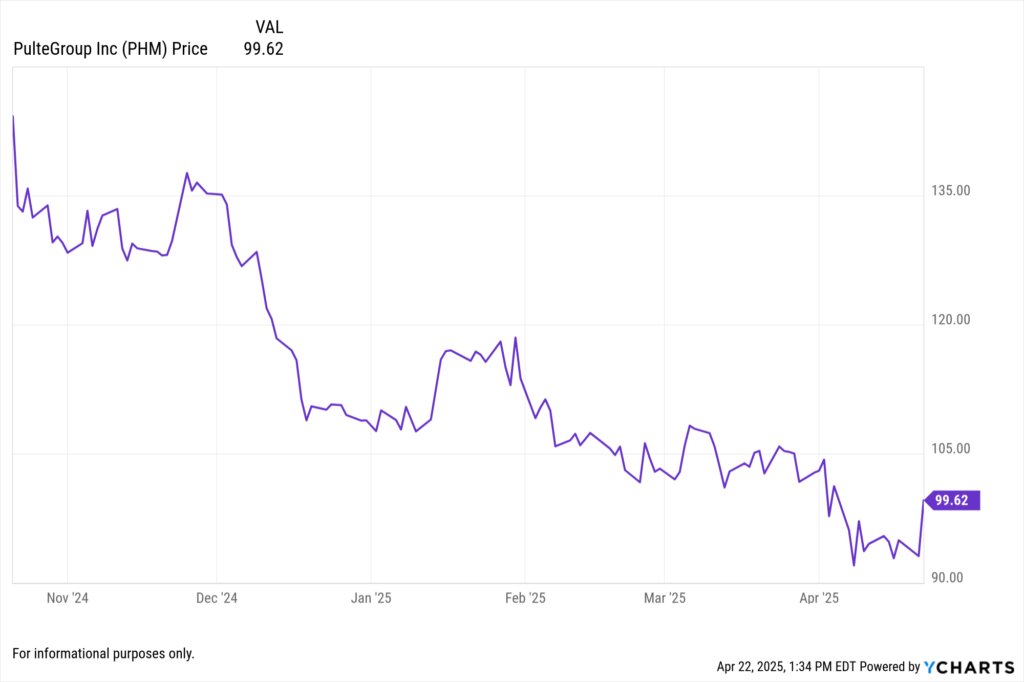
PulteGroup reported Q1 2025 revenue of $3.89 billion, surpassing analysts’ expectations of $3.82 billion. Adjusted earnings per share came in at $2.57, exceeding the anticipated $2.42. The company’s use of buyer incentives, such as rate buydowns and price discounts, effectively stimulated demand in a challenging housing market.
View PulteGroup Inc’s Earnings Report Here >
AMCON Distributing Co. (DIT) Sees Earnings Decline Amid Rising Costs
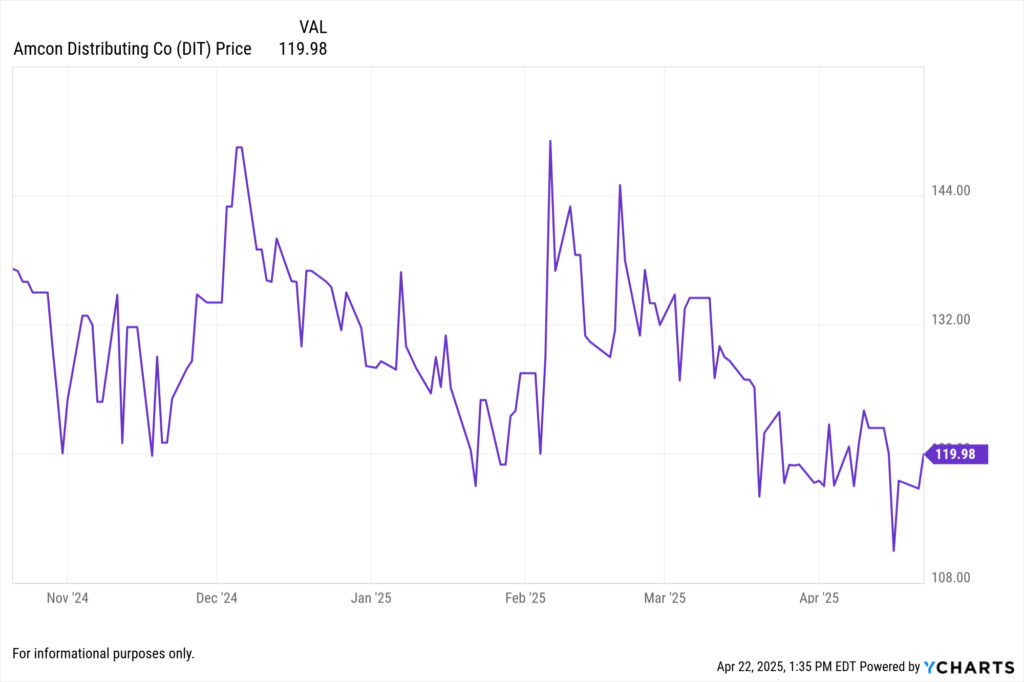
AMCON Distributing reported a fiscal Q3 2025 earnings per share of $2.46, down from the previous year, due to increased operational costs. However, sales rose to $717.9 million, driven by strong demand in the convenience store segment.
View AMCON Distributing Co’s Earnings Report Here >
Genuine Parts Co. (GPC) Reports Steady Growth
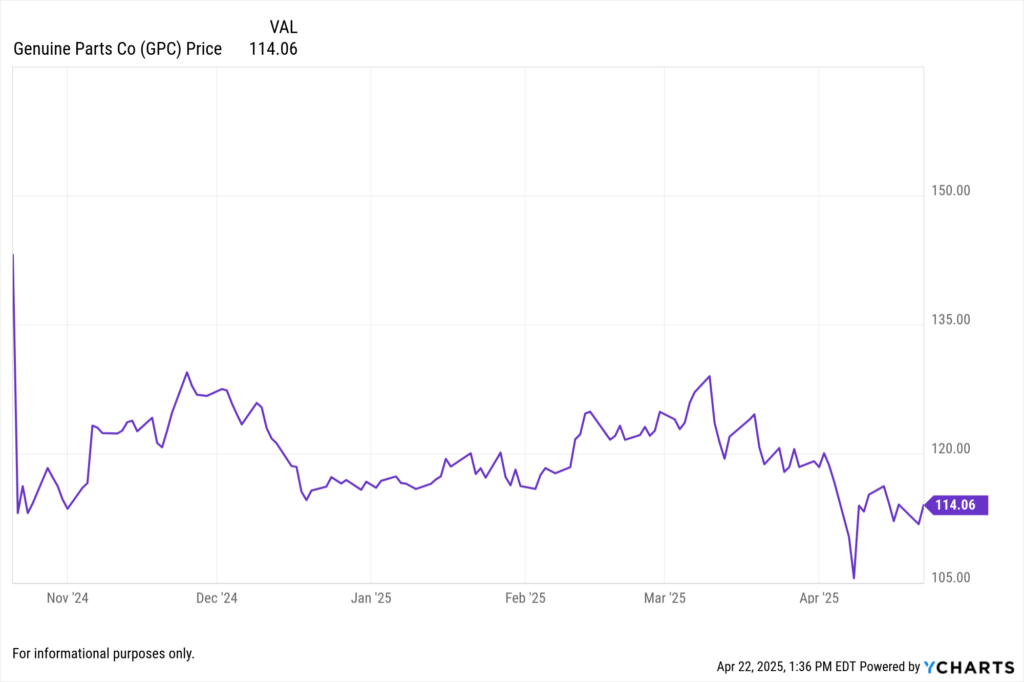
Genuine Parts Co. reported Q1 2025 revenue of $5.8 billion, a 3% increase year-over-year, with net income of $250 million and EPS of $1.75. The company’s diversified portfolio and strong demand in the automotive segment contributed to its steady performance.
View Genuine Parts Co’s Earnings Report Here >
April 17, 2025 Earnings
D.R. Horton Inc. (DHI) Misses Earnings and Lowers Forecast
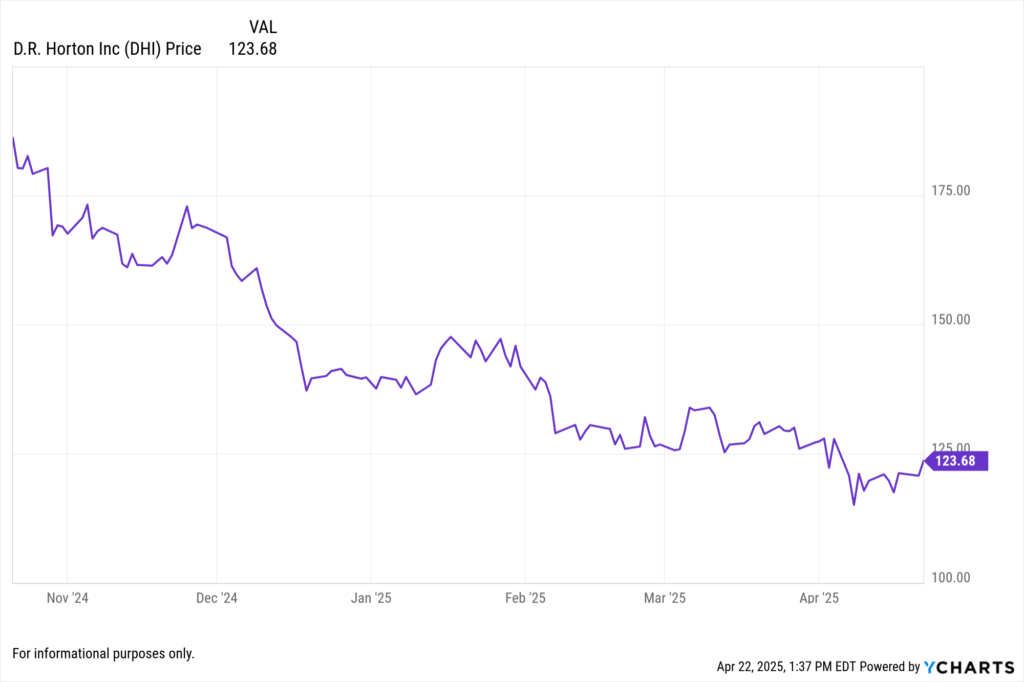
D.R. Horton reported Q2 fiscal 2025 earnings per share of $2.58, below the expected $2.67, with revenue at $7.7 billion. The company cited a slower-than-anticipated spring selling season and affordability challenges as reasons for the performance. Consequently, D.R. Horton lowered its full-year revenue forecast to between $33.3 billion and $34.8 billion.
View D.R. Horton Inc’s Earnings Report Here >
April 10, 2025 Earnings
CarMax Inc. (KMX) Falls Short Amid Market Pressures
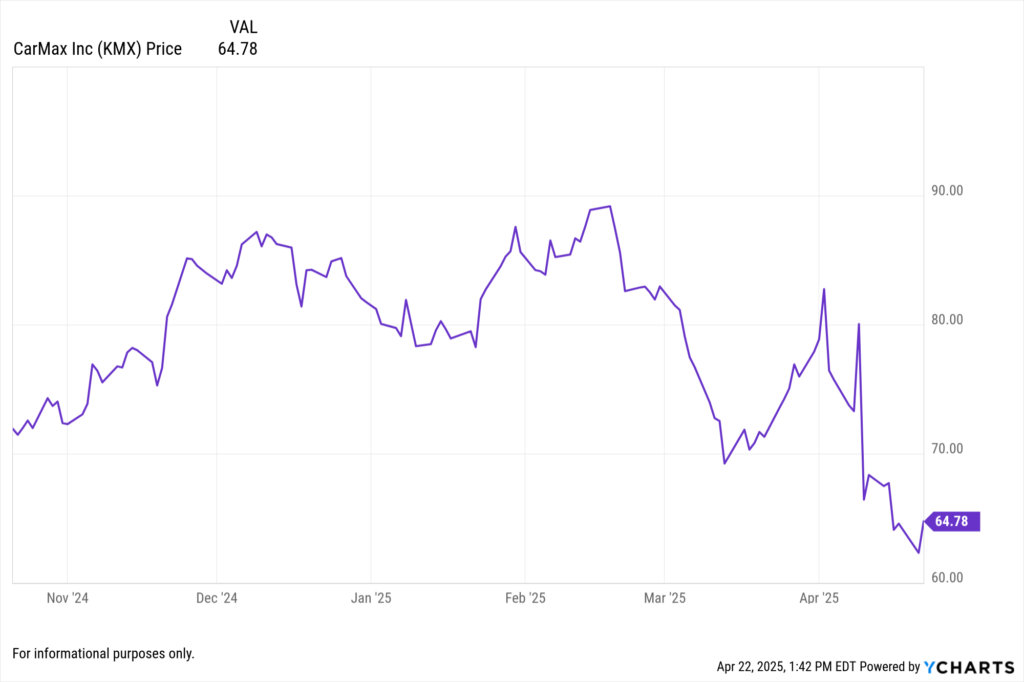
CarMax reported Q4 fiscal 2025 earnings per share of $0.58 on revenue of $6.00 billion, both below analysts’ expectations. The company sold 301,811 used vehicles, missing the anticipated 312,800 units. CarMax also suspended its long-term growth targets due to macroeconomic uncertainties.
YCharts Tools for Consumer Discretionary Sector Analysis
Fundamental Charts: Track performance metrics of financial institutions over time.
Holdings Overlap Tool: Identify concentration risks in financial sector ETFs.
Custom Reports: Generate client-ready visuals highlighting key financial trends.
Whenever you’re ready, here’s how YCharts can help you:
1. Looking to Move On From Your Investment Research and Analytics Platform?
2. Want to test out YCharts for free?
Start a no-risk 7-Day Free Trial.
Disclaimer
©2025 YCharts, Inc. All Rights Reserved. YCharts, Inc. (“YCharts”) is not registered with the U.S. Securities and Exchange Commission (or with the securities regulatory authority or body of any state or any other jurisdiction) as an investment adviser, broker-dealer or in any other capacity, and does not purport to provide investment advice or make investment recommendations. This report has been generated through application of the analytical tools and data provided through ycharts.com and is intended solely to assist you or your investment or other adviser(s) in conducting investment research. You should not construe this report as an offer to buy or sell, as a solicitation of an offer to buy or sell, or as a recommendation to buy, sell, hold or trade, any security or other financial instrument. For further information regarding your use of this report, please go to: ycharts.com/about/disclosure
Next Article
Q1 2025 Healthcare Sector Earnings: Live Updates & Market ReactionsRead More →