Top Dividend-Growth Stocks of the Last 3 Years: Income with Momentum

Introduction: Why Dividend Growth Matters
In today’s market environment – marked by inflation concerns, rate uncertainty, and sector rotation – dividend growth stocks offer a powerful combination of income stability and capital appreciation. For financial advisors and income-focused investors, identifying companies that consistently raise their dividends is critical to building sustainable, long-term portfolios.
While high yield often gets the spotlight, dividend growth can be a more telling signal of management confidence, financial health, and earnings momentum. This blog highlights the top dividend growers of the past three years, measured by compound annual growth rate (CAGR), and explores how YCharts can help uncover these outperformers with ease.
Top Dividend Growth Stocks: 3-Year CAGR Leaders
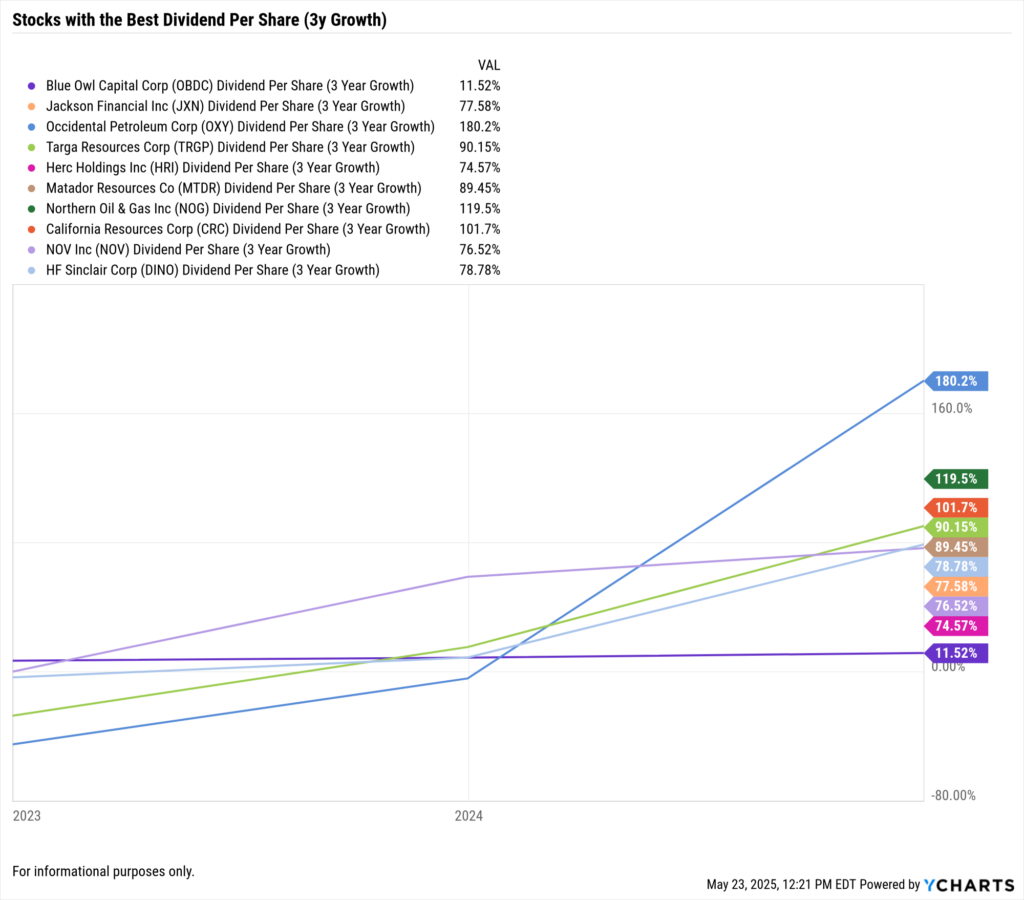
The table below ranks the top 10 U.S.-listed dividend-paying companies with the highest 3-year dividend CAGR. These stocks span Energy, Industrials, and Financials—sectors that have shown strong free cash flow generation and capital return discipline in recent years.
Note: Dividend CAGR figures are based on trailing 3-year dividend per share growth using YCharts’ fundamental calculations.
What These Dividend Growers Have in Common
• Energy Dominance: With oil prices elevated and capital discipline tight, energy companies like OXY, TRGP, and MTDR have not only returned to pre-2020 payout levels but are growing dividends aggressively.
• Financial Rebound: Firms like Blue Owl Capital and Jackson Financial show how asset managers and insurers are restoring and boosting shareholder distributions post-pandemic.
• Strong Free Cash Flow: Across sectors, these companies consistently convert revenue to cash, enabling sustainable dividend increases.
Use Cases for Advisors & Asset Managers
Dividend CAGR matters because it signals more than just a payout—it’s a proxy for management conviction and balance sheet strength. Here’s how this data supports portfolio strategy:
• Retirement Income Planning: Dividend growers offer rising income potential, critical for long-term retirees facing inflation.
• Quality Growth Screening: Combining dividend growth with profitability and valuation metrics can surface under-the-radar compounders.
• Risk Assessment: A history of growing dividends often correlates with lower volatility and drawdown during bear markets.
How YCharts Can Help
YCharts simplifies the discovery and analysis of dividend growth opportunities through a suite of data tools designed for financial professionals:
Stock Screener
Quickly identify companies with high dividend growth using filters like 3-Year Dividend CAGR, Dividend Yield, Sector, and Market Cap.
→ Try the Stock Screener
Fundamental Charts
Track a stock’s dividend per share over time alongside payout ratios, earnings growth, and free cash flow to assess sustainability.
→ Explore Fundamental Charts
Custom Reports
Create client-ready visuals that showcase dividend trends, growth comparisons, and yield scenarios across portfolios.
→ Build a Custom Report
Comparison Tool
Evaluate dividend growth, valuation, and profitability metrics across multiple tickers in a single view to support recommendation workflows.
→ Use the Comparison Tool
Watchlists & Alerts
Monitor dividend policy changes by setting up alerts for payout updates or quarterly declarations across client portfolios.
→ Set Up Watchlists
Conclusion: Growth, Not Just Yield
High dividend yield can fade—but strong dividend growth compounds. These 10 companies have shown a consistent ability to raise their payouts, supported by free cash flow, strong sector trends, and disciplined capital strategies.
Whether you’re seeking to build a rising income portfolio, mitigate inflation risk, or offer clients a more sophisticated dividend approach, YCharts gives you the tools to move from research to action—faster and smarter.
Whenever you’re ready, here’s how YCharts can help you:
1. Looking to Move On From Your Investment Research and Analytics Platform?
2. Want to test out YCharts for free?
Start a no-risk 7-Day Free Trial.
Disclaimer
©2025 YCharts, Inc. All Rights Reserved. YCharts, Inc. (“YCharts”) is not registered with the U.S. Securities and Exchange Commission (or with the securities regulatory authority or body of any state or any other jurisdiction) as an investment adviser, broker-dealer or in any other capacity, and does not purport to provide investment advice or make investment recommendations. This report has been generated through application of the analytical tools and data provided through ycharts.com and is intended solely to assist you or your investment or other adviser(s) in conducting investment research. You should not construe this report as an offer to buy or sell, as a solicitation of an offer to buy or sell, or as a recommendation to buy, sell, hold or trade, any security or other financial instrument. For further information regarding your use of this report, please go to: ycharts.com/about/disclosure
Next Article
How YCharts Supports the Defined Outcome ETF ConversationRead More →