Inflation Week 2025: What Advisors Need to Know Ahead of CPI & PPI Releases

As “Inflation Week” kicks off in June 2025, financial advisors face a critical juncture in interpreting macroeconomic signals. The Consumer Price Index (CPI) release on Wednesday and the Producer Price Index (PPI) on Thursday promise fresh insights into the price pressures shaping Federal Reserve policy – and, by extension, precise portfolio strategy. While markets remain cautiously optimistic, a cocktail of persistent inflation data, renewed tariff pressures, and mixed economic signals suggests that volatility is far from over. Advisors need to be prepared not just to interpret this data, but to swiftly translate it into actionable strategies for their clients.
This blog covers:
- • The current economic context, balancing slowing growth against persistent inflation.
- • The direct implications of new tariffs on inflation dynamics.
- • Asset classes demonstrating resilience during inflationary spikes.
- • Tactical portfolio moves advisors can make across sectors, styles, and geographies.
- • How YCharts provides essential tools to analyze inflation data trends and communicate complex insights effectively.
Market Context: Economic Crosscurrents and Fed Vigilance
The U.S. economic outlook heading into mid-June 2025 is anything but straightforward, characterized by a complex interplay of contrasting indicators. On one hand, recent data, including a modest Q1 GDP contraction, confirms a tangible cooling of the economy. This deceleration suggests that the cumulative impact of aggressive rate hikes over the past two years is permeating various sectors, beginning to temper overall demand. Consumer sentiment has subtly dipped, and certain demand-side metrics are normalizing from their pandemic-driven highs, aligning with the Federal Reserve’s goal of moderating economic activity to combat inflation.
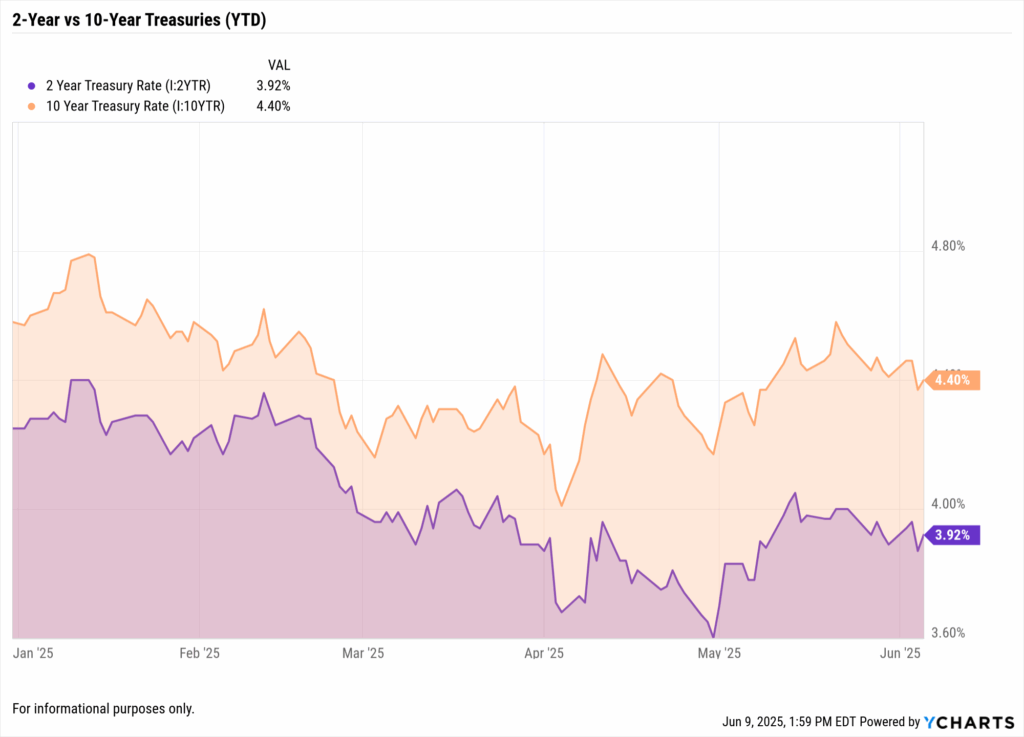
However, despite these signs of cooling, inflationary pressures remain stubbornly persistent, particularly in core services. Sustained wage growth, elevated shelter costs, and lingering supply-side constraints continue to exert upward pressure on prices. Headline CPI, while off its 2022 peak, is still notably above the Fed’s 2% target, creating a delicate balance for policymakers. This leaves the Fed caught between the need to ensure price stability and the risk of overtightening into a significant economic slowdown. Bond markets reflect this tension, with yields on the 2-year Treasury and 10-year Treasury trading in a volatile range, caught in a tug-of-war between slower growth fears and a Fed seemingly unwilling to declare victory on inflation.
The Tariff Factor: Beyond Inflation Week Headlines
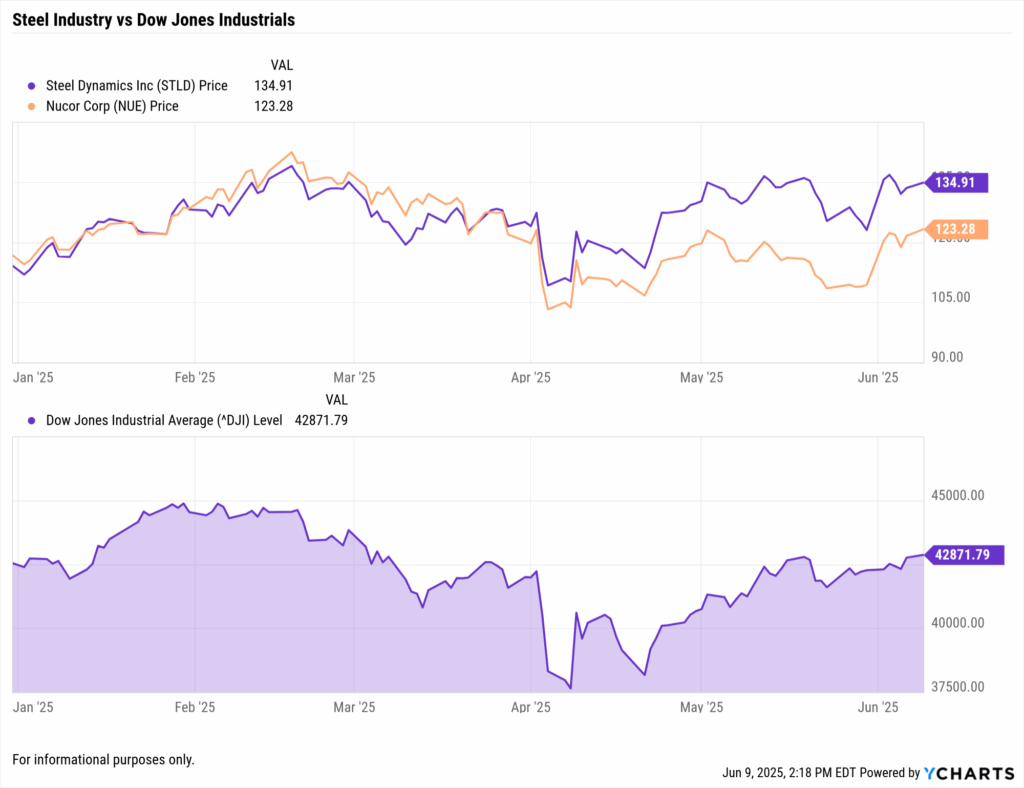
While inflation data takes center stage this week, the re-emergent subplot of tariffs introduces a critical, additional layer of complexity. The U.S.’s recent reimposition of 50% duties on steel and aluminum imports—measures predominantly targeting major trading partners like China—is poised to significantly influence producer prices. This aggressive protectionist move directly increases input costs for any domestic industry relying on these metals, such as automotive, aerospace, and construction.
The impending PPI release on Thursday will offer the first direct insights into how these tariffs are translating into higher costs for producers, potentially signaling a fresh wave of cost-push inflation. Following that, the CPI release will be crucial in determining if these producer-level cost increases are bleeding through to consumer prices. This dynamic risks extending the tail of inflation well into late 2025, especially if retaliatory measures from affected trading partners emerge, further disrupting global supply chains and trade flows. Advisors should view these developments not as isolated political noise, but as actionable risk factors that directly impact corporate margins and ultimately, consumer spending power.
Asset Focus: Hedging Against Inflationary Headwinds
For advisors, inflation isn’t merely an economic statistic; it represents a tangible threat to client portfolios. Identifying which asset classes demonstrate inherent adaptability and resilience in the current inflationary regime is paramount.
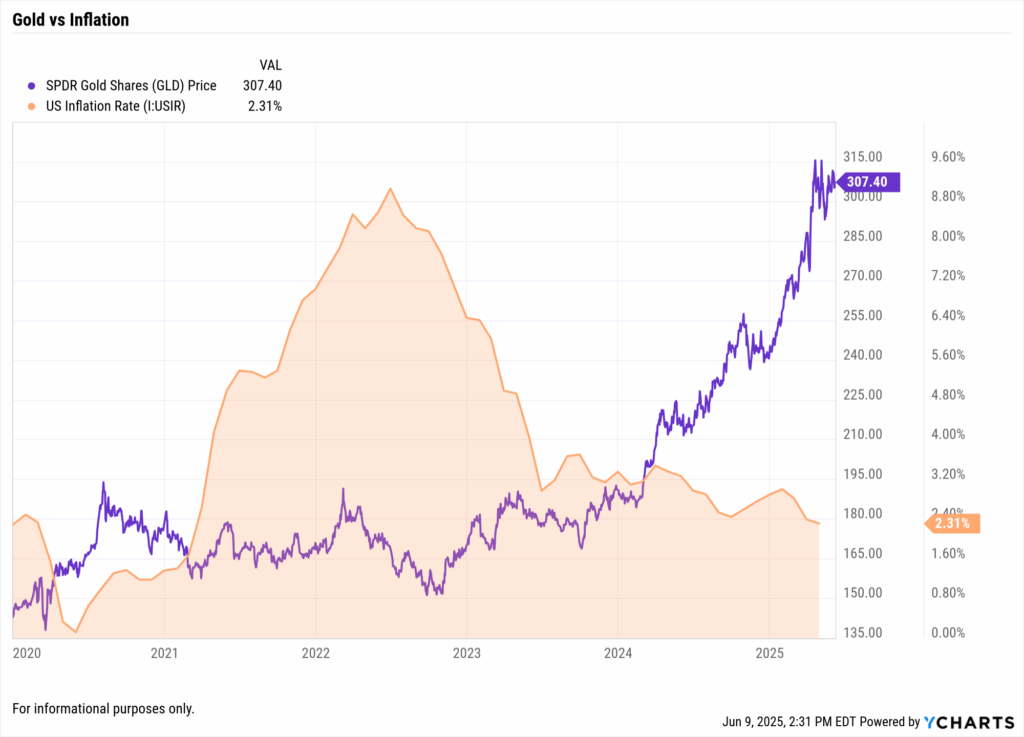
- • Gold (GLD): The Enduring Haven: Gold consistently proves to be a reliable hedge against both inflation and geopolitical stress. As a tangible asset, its intrinsic value offers a strong counterpoint to fluctuating currency purchasing power during inflationary cycles. Its performance often inversely correlates with real interest rates, making it attractive when inflation outpaces nominal rates. Recent market movements, exacerbated by global trade uncertainty, underscore gold’s ability to hold its ground, making it a compelling diversification tool.
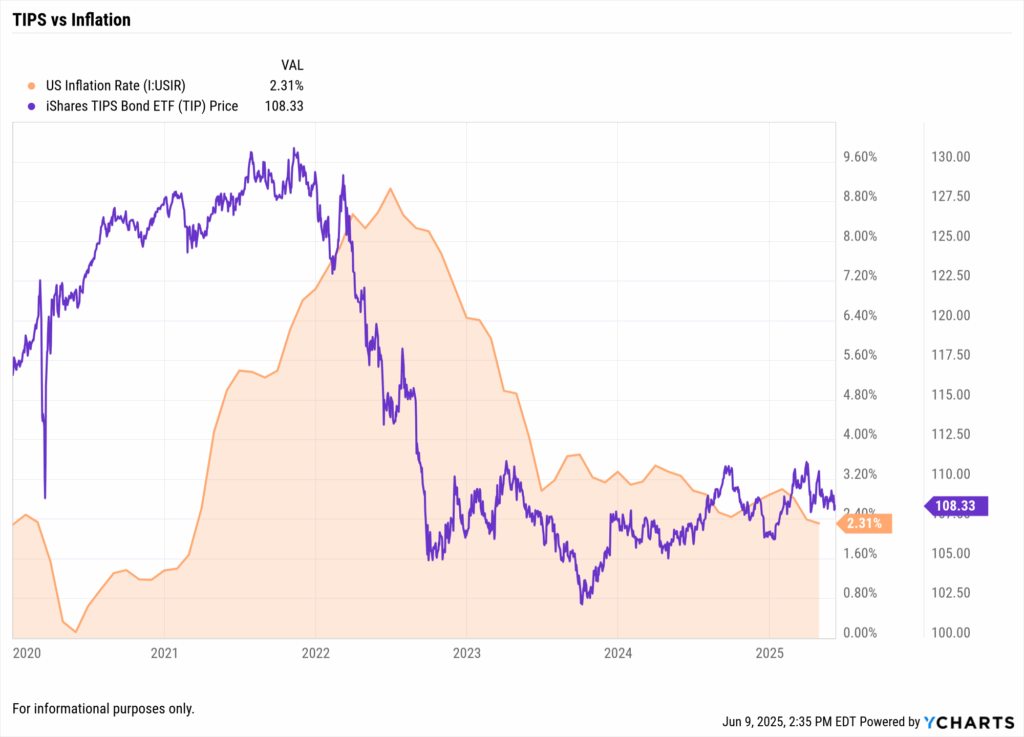
- • TIPS (TIP): Direct Protection: Treasury Inflation-Protected Securities (TIPS) are explicitly designed to offer direct protection against inflation. Their principal value adjusts semiannually with changes in the Consumer Price Index (CPI), preserving investment purchasing power. While real yields might be lower than conventional Treasuries, the inflation adjustment can significantly enhance total returns during periods of unexpected inflation. TIPS, accessible via ETFs like TIP, remain an effective tool for directly hedging inflation risk within fixed income.
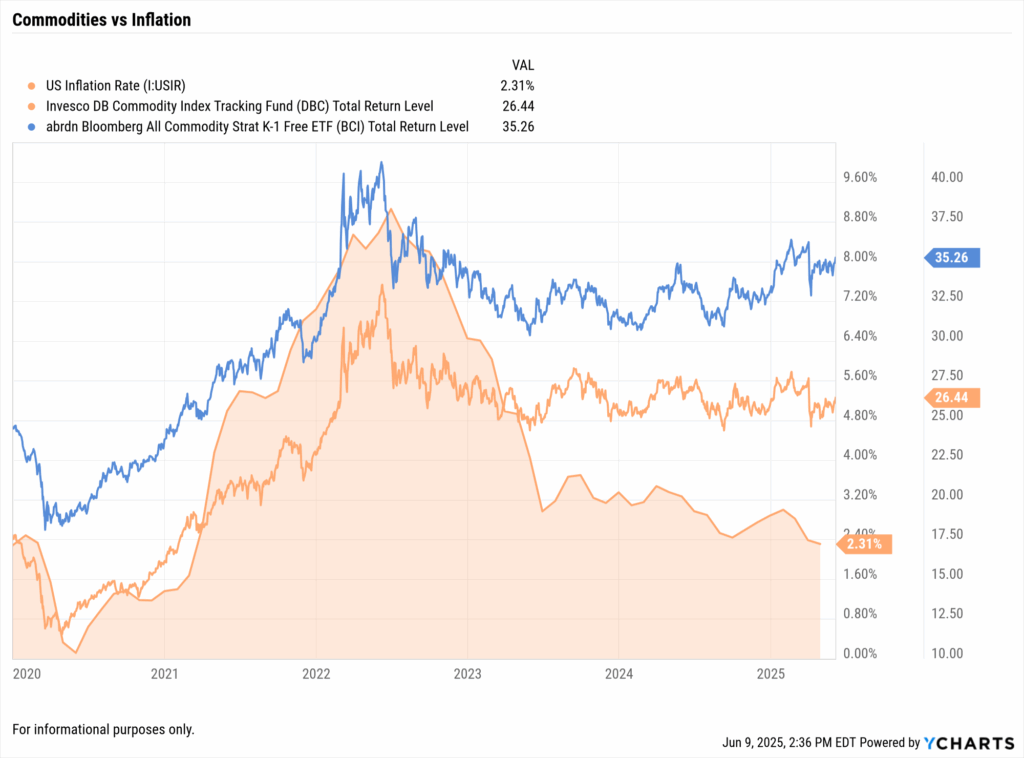
- • Commodities (DBC, BCI): The Raw Material Play: Broad commodity exposure, extending beyond precious metals, serves as a robust inflation hedge. Prices of raw materials, energy, and agricultural products frequently surge during inflationary periods due to increased demand or supply disruptions. With tariffs driving up industrial material costs, diversified commodity ETFs have seen renewed interest. These vehicles offer exposure to a basket of essential raw materials, historically rallying as inflation data strengthens and providing a buffer against rising input costs.
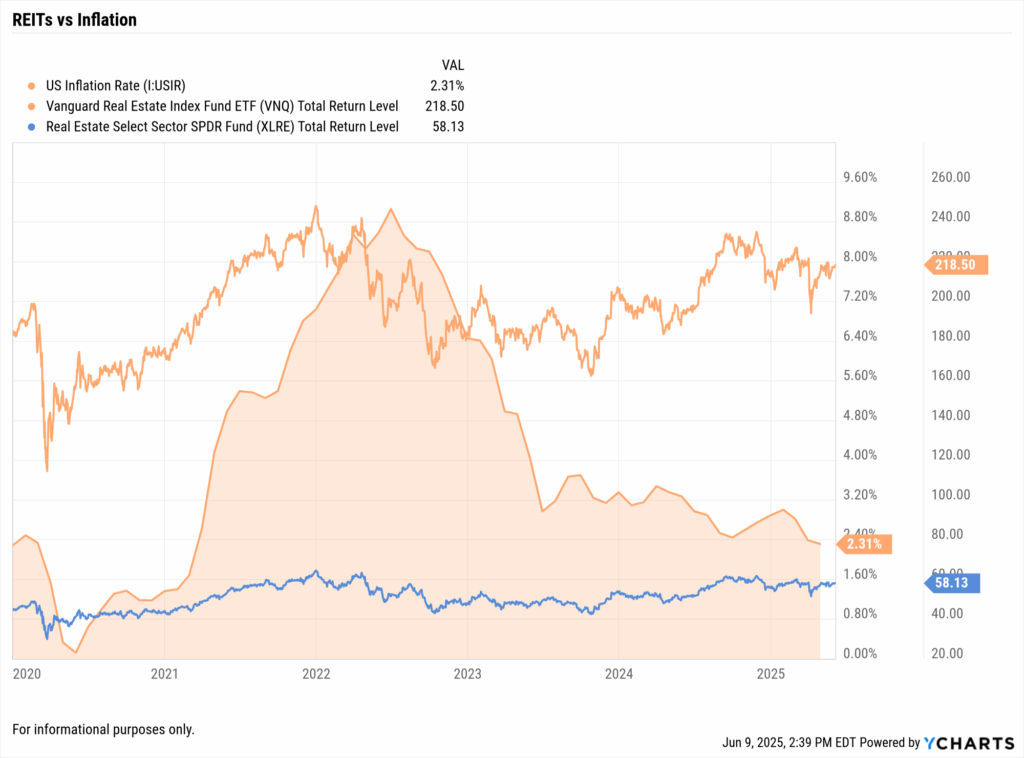
- • REITs (VNQ, XLRE): Inflation Linkage with Rate Sensitivity: Real Estate Investment Trusts (REITs) offer a natural linkage to inflation, as property values and rental income often adjust upwards with rising price levels. REITs provide liquid exposure to various real estate segments, offering potential income growth and capital appreciation. However, advisors must balance this benefit against the sector’s sensitivity to interest rates; continually high rates can increase borrowing costs for real estate firms and dampen property valuations, potentially counteracting inflation benefits.
Portfolio Strategy: Navigating with Precision
A passive “wait-and-see” posture could be insufficient during Inflation Week. Advisors may consider proactively refining their positioning now, well in advance of the data.
- Trim Duration in Fixed Income: The Federal Reserve’s policy trajectory is highly contingent upon incoming inflation data. An upside surprise in CPI or PPI could swiftly reprice market expectations for potential rate cuts, pushing them further out. Longer-duration bonds are inherently more sensitive to these shifts, facing greater price depreciation when yields rise. Shifting client portfolios towards shorter-maturity bonds or implementing laddered bond strategies can significantly manage duration risk, allowing fixed income to provide stability without undue exposure to rate volatility.
- Overweight Pricing Power: In an inflationary environment, companies with strong “pricing power”—the ability to pass rising input costs onto customers without significant loss of sales—are better equipped to protect profit margins. Advisors should consider overweighting sectors where pricing power is prevalent, such as consumer staples (due to inelastic demand), energy (often able to pass on rising fuel costs), and specific parts of healthcare (due to inelastic demand). Conversely, exercising caution in rate-sensitive sectors like real estate and financials, where profitability is directly tied to borrowing costs, is advisable until rate clarity improves.
- Monitor Tariff Fallout and Supply Chain Resilience: The recent reimposition of tariffs introduces a fresh layer of cost-push inflation, directly impacting industries reliant on specific imported raw materials. Sectors like automotive manufacturing, heavy machinery, and construction are particularly vulnerable to increased input costs and potential earnings compression. Advisors should actively screen for U.S.-centric firms or companies with demonstrably diversified supply chains that have successfully re-shored production. This proactive monitoring is essential to identify both companies facing direct headwinds and those better positioned to adapt or even benefit from shifts in global trade.
- Emphasize Global Diversification as a Risk Mitigator: With U.S. trade and fiscal policies potentially introducing idiosyncratic economic distortions, relying solely on domestic exposures can heighten portfolio risk. International equities, particularly in emerging markets or developed markets not directly entangled in current U.S. tariff disputes, could offer crucial diversification benefits. Their economic cycles might be less correlated with U.S. trade tensions, providing a buffer. Assessing companies with strong domestic revenue bases in these regions can further enhance resilience and provide return potential.
YCharts Tools in Action: Empowering Advisor Response
Inflation data and its macroeconomic implications are inherently complex. YCharts provides a robust, intuitive platform designed to simplify this complexity, translating vast datasets into actionable insights and empowering financial advisors to make informed decisions and communicate them with conviction to clients.
- Economic Indicators: As the CPI and PPI releases loom, advisors need immediate access to a comprehensive view of the macro landscape. YCharts’ Economic Indicators allows you to track and overlay key metrics. Visualize “Consumer Price Index (CPI) Year-over-Year (CPIYOY),” “Producer Price Index (PPI) Final Demand Year-over-Year (PPIYOY),” and the “Effective Federal Funds Rate” to instantly understand their historical and current interplay. You can add “U.S. Manufacturing PMI” for real-time factory activity and “U.S. Import Price Index” to track the direct pass-through of tariffs, ensuring your analysis of inflation data is comprehensive and contextualized.
- Yield Curve Tool: The shape of the yield curve is a potent forward-looking indicator for both economic health and inflation expectations. Utilize YCharts’ interactive Yield Curve Tool to visualize shifts in U.S. Treasury yields across different maturities. Monitoring the spread between the USGG10YR (10-Year Treasury Yield) and USGG2YR (2-Year Treasury Yield) can signal recessionary fears or persistent inflation concerns, informing your fixed income adjustments. Dive deeper into the Fed’s stance in our recent blog, “Decoding the Fed’s Holding Pattern: Interest Rate Implications for Markets and the Economy Q2 2025.”
- Fundamental Charts: To assess a company’s vulnerability or resilience to tariffs and inflation, delve into individual firm fundamentals. Use YCharts’ Fundamental Charts to quickly track “Gross Profit Margin” and “Cost of Goods Sold (COGS) as % of Revenue” for companies in tariff-impacted sectors like Ford Motor Company (F), U.S. Steel (X), or Caterpillar (CAT). This visual analysis helps confirm if rising input costs are being absorbed or passed through. Explore detailed trade impacts further in our blog, “Trump’s US-UK Trade Deal: Sector Impacts, Key Companies, and Portfolio Strategy.”
- Custom Reports: Proactive risk management is paramount. Automate alerts for key inflation data releases (CPI, PPI), significant yield curve shifts, or sudden movements in critical commodity prices. Use YCharts’ “Report Builder” to create personalized “Inflation Check-in” reports for your clients, incorporating relevant charts and concise commentary derived from your analysis. This allows for consistent client communication and reinforces your position as a trusted advisor, especially during periods of market uncertainty. Further understand the broader trade environment in “U.S.–China 90-Day Tariff Pause: Market Relief or Temporary Truce?“
Conclusion
“Inflation Week 2025” stands as a defining moment for financial markets, with the forthcoming CPI and PPI releases poised to deliver crucial insights into the persistent inflationary pressures confronting the U.S. economy. For financial advisors, the days ahead offer more than just raw data; they present a definitive opportunity for clarity and strategic refinement. Will inflation data finally show sufficient softening to justify future easing of monetary policy? Or will the twin forces of new tariffs and sticky services inflation prolong the Federal Reserve’s cautious pause on interest rates? Either way, YCharts empowers advisors to act with informed confidence. By leveraging its comprehensive tools, advisors can translate complex inflation data into actionable insights, strategically position portfolios not just to survive inflationary pressures, but to leverage them as a distinct edge in client portfolios.
Whenever you’re ready, here’s how YCharts can help you:
1. Looking to Move On From Your Investment Research and Analytics Platform?
2. Want to test out YCharts for free?
Start a no-risk 7-Day Free Trial.
Disclaimer
©2025 YCharts, Inc. All Rights Reserved. YCharts, Inc. (“YCharts”) is not registered with the U.S. Securities and Exchange Commission (or with the securities regulatory authority or body of any state or any other jurisdiction) as an investment adviser, broker-dealer or in any other capacity, and does not purport to provide investment advice or make investment recommendations. This report has been generated through application of the analytical tools and data provided through ycharts.com and is intended solely to assist you or your investment or other adviser(s) in conducting investment research. You should not construe this report as an offer to buy or sell, as a solicitation of an offer to buy or sell, or as a recommendation to buy, sell, hold or trade, any security or other financial instrument. For further information regarding your use of this report, please go to: ycharts.com/about/disclosure
Next Article
3 Ways Top Wholesalers Will Win This Summer (While Everyone Else Takes PTO)Read More →