Tariff Countdown: Copper and USD to JPY React to Trade Uncertainty
Introduction
As the clock ticks down on a U.S.-China 90-day tariff pause (now extended to August 1st, 2025), global markets are sending mixed signals. Copper prices and the USD to JPY exchange rate, two bellwethers of economic sentiment, are fluctuating amid trade uncertainty. Advisors who remember the temporary truce of the 90-day tariff pause know this countdown could mean renewed volatility ahead. It’s crucial to decode what these moves in commodities and currencies mean for portfolios and client communication.
For a deeper dive into the implications of the U.S.–China 90-day tariff pause, see our analysis: U.S.–China 90-Day Tariff Pause: Market Relief or Temporary Truce?
Table of Contents
Copper Prices Signal Global Trade Anxieties
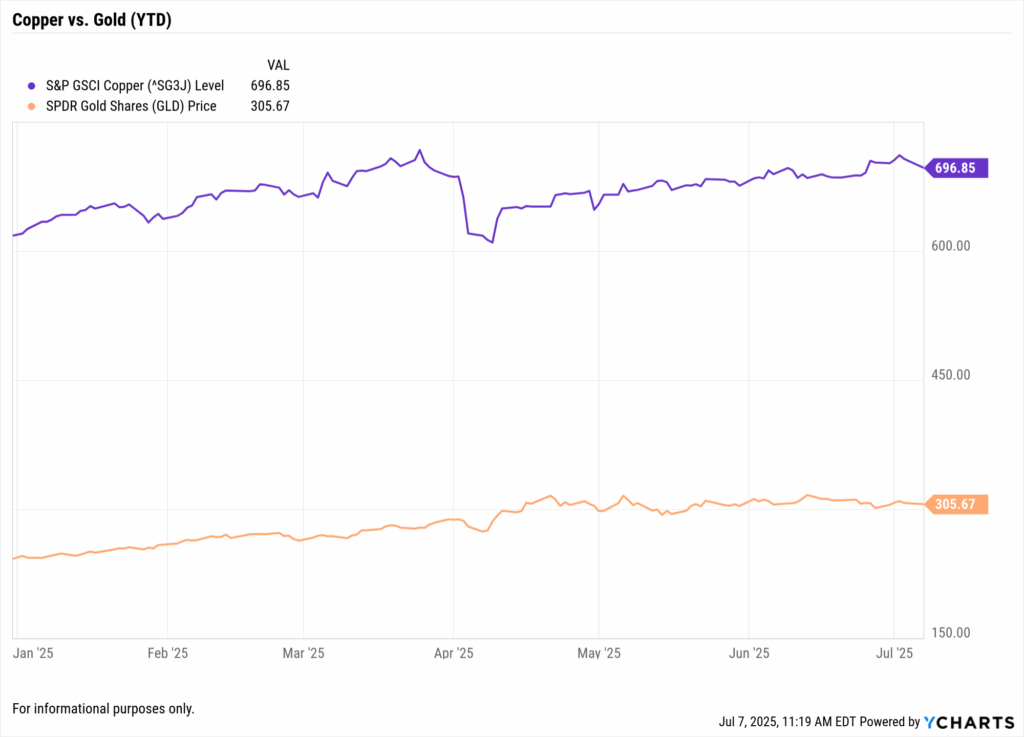
Copper, often referred to as “Dr. Copper” for its predictive power regarding global economic health, has exhibited significant volatility in 2025. This volatility underscores the metal’s sensitivity to trade dynamics and economic indicators.
Tariff-Induced Price Swings
In late March 2025, copper prices soared to an all-time high of $5.28 per pound on the COMEX, driven by anticipations of U.S. tariffs on copper imports. However, the announcement of a 25% tariff led to a sharp reversal, with prices plummeting to $4.26 per pound by April 7, a 19% decline in less than two weeks.
The market turmoil intensified when China imposed a 34% retaliatory tariff on all U.S. imports, effective April 10. This move exacerbated fears of a global economic slowdown, further pressuring copper prices.
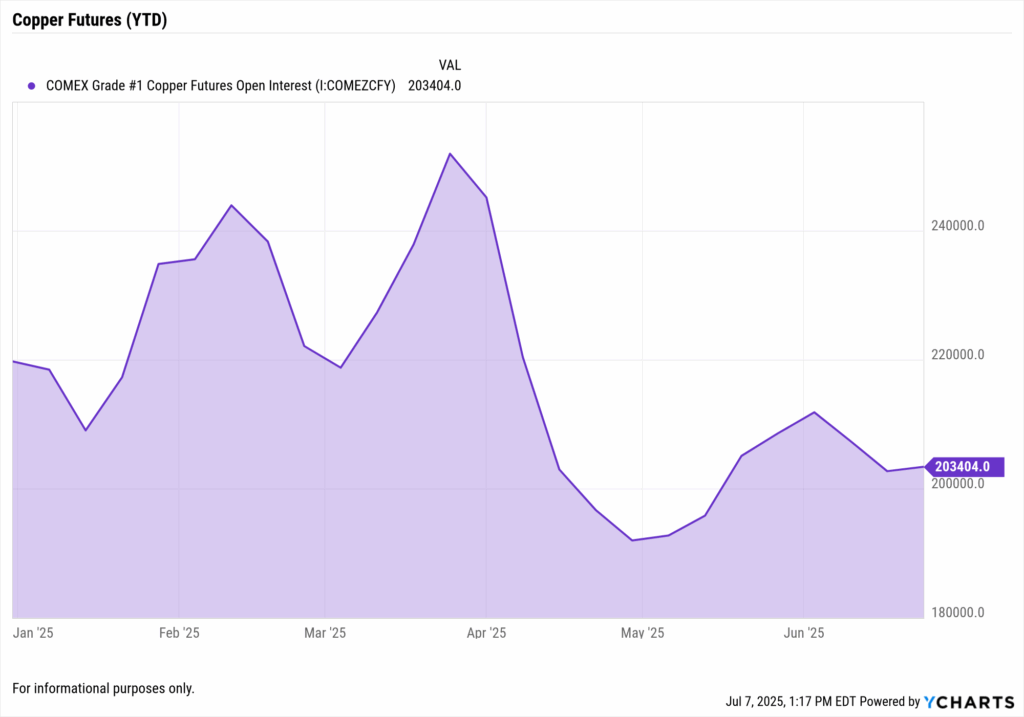
Supply Chain Disruptions and Inventory Shifts
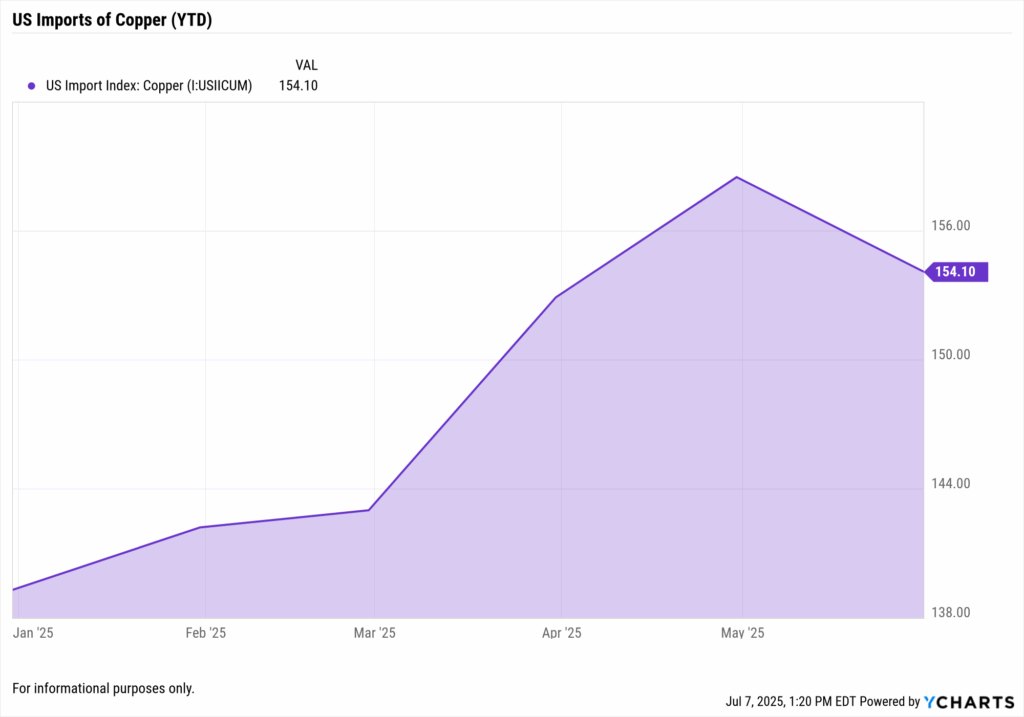
The tariff tensions have disrupted global copper supply chains. Traders rushed to ship copper to the U.S. ahead of the tariff implementation, leading to a surge in CME warehouse inventories, particularly in New Orleans and Baltimore. Conversely, inventories at the London Metal Exchange (LME) and Shanghai Futures Exchange (ShFE) declined, indicating tightening availability in other regions.
Economic Indicators and Demand Outlook
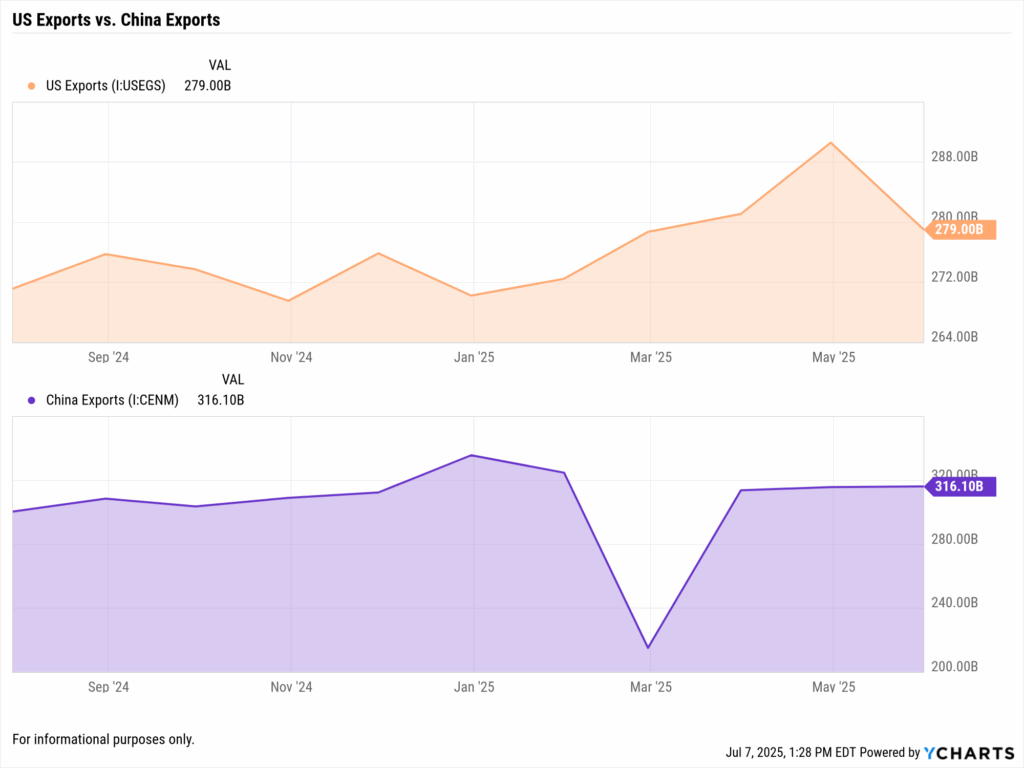
Economic data from the U.S. and China have added to the bearish sentiment. The U.S. economy contracted in the first quarter of 2025, while China’s export orders saw a significant drop in March. These indicators suggest weakening industrial demand, which is critical for copper consumption.
Furthermore, forecasts have shifted from a projected copper shortage to a surplus of 100,000 tons in 2025, primarily due to downward revisions in demand growth expectations.
Implications for Advisors
For financial advisors, these developments highlight the importance of monitoring commodity markets as indicators of economic trends. Copper’s price movements can signal shifts in industrial activity and global trade health.
Q: Why should advisors monitor copper prices during trade tensions?
A: Copper prices reflect the state of global manufacturing and trade. During periods of trade uncertainty, declining copper prices may indicate reduced industrial demand and potential economic slowdown. Advisors can use tools like YCharts’ Fundamental Chart to track copper prices and correlate them with sector performance, aiding in portfolio adjustments.
Yen’s Safe-Haven Role and USD-to-JPY Trends in Focus
The yen’s reputation as the world’s premier risk-off asset is on full display. During the April–July tariff sparring, the USD to JPY pair slid from 151.20 to 143.80 (about 5%) as hedge funds unwound carry trades and real-money accounts rotated toward safety. The Japanese Ministry of Finance’s weekly capital-flow report shows net foreign bond buying by Japanese investors turned negative for three straight weeks, underscoring capital repatriation amid policy uncertainty (MOF, July 4 release).
Policy Divergence with the Bank of Japan
While the Fed debates cuts, the Bank of Japan has stayed ultra-dovish, capping 10-year JGB yields around 1.0%. That yield gap would normally weaken the yen, yet trade headlines outweighed rate differentials. The BoJ’s latest Summary of Opinions (published June 25) noted “heightened external risks” and pledged continued yield-curve control, fuel for further haven demand if tensions flare.
U.S. Data Reinforce Yen Bid
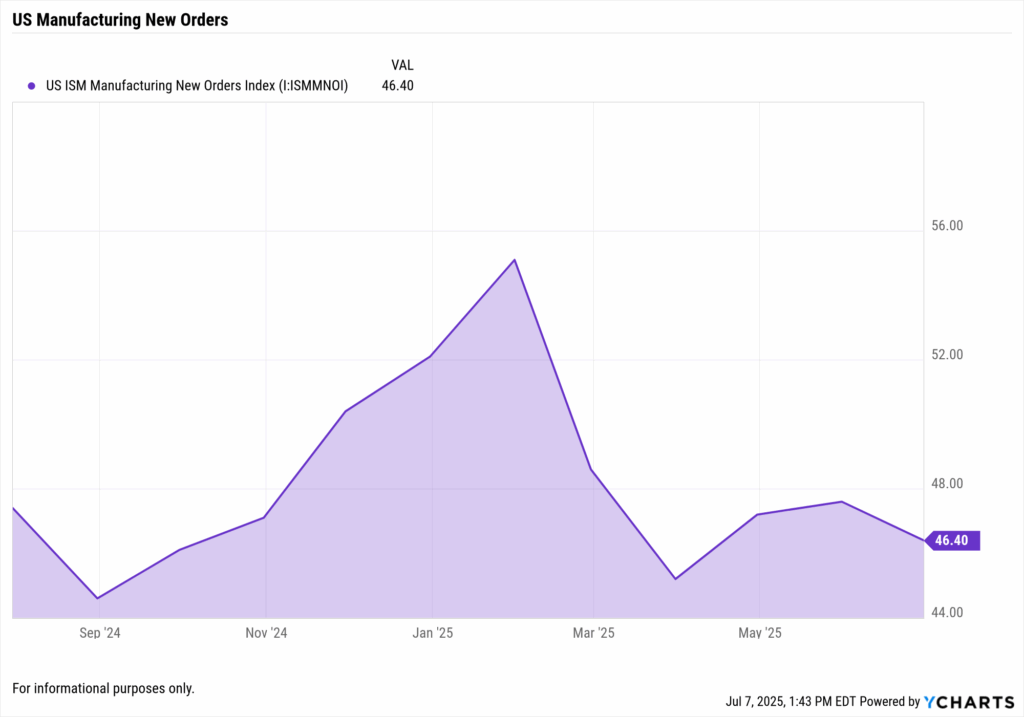
U.S. Treasury’s TIC data (released May 16. 2025) showed a $36 billion decline in foreign purchases of U.S. securities during April, led by Asian official institutions. Declining appetite for dollar assets aligns with yen strength: fewer dollars purchased equals less upward pressure on USD to JPY. Coupled with softer ISM Manufacturing new-orders readings (Institute for Supply Management, July 2), investors interpreted a cooling U.S. outlook, reinforcing yen gains.
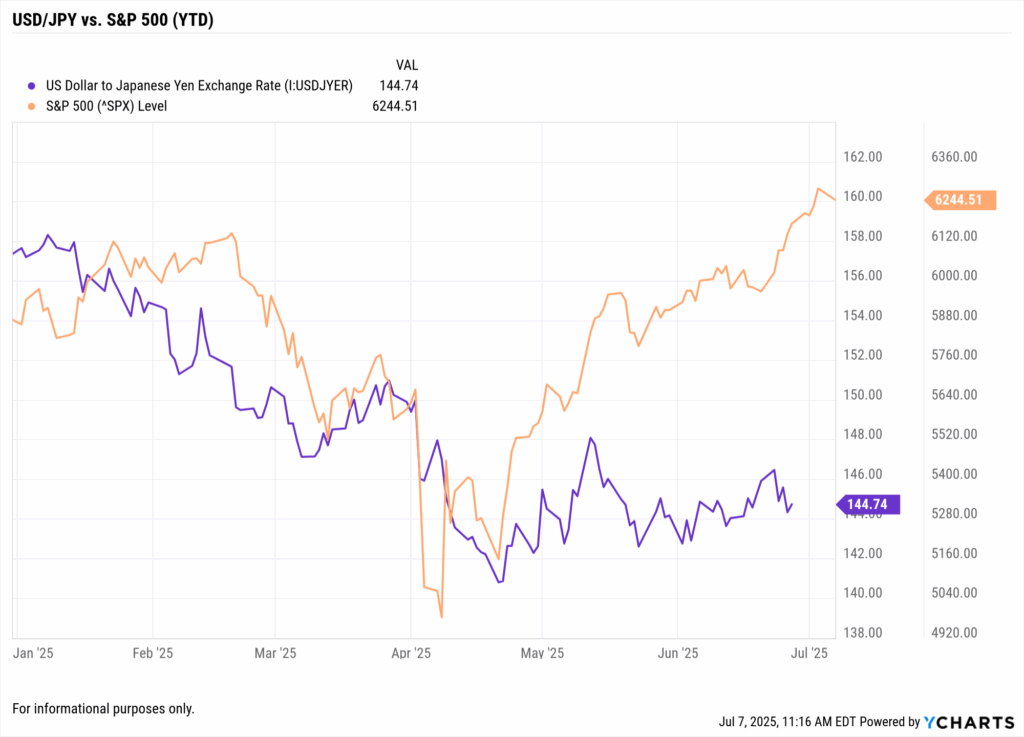
Q: Does a stronger yen spell trouble for U.S. stocks?
A: Historically, a falling USD/JPY – meaning a stronger yen correlates with risk-off equity moves. It is not causal, but it signals rising caution. Advisors often hedge portfolios by raising cash or adding Treasuries when yen strength breaches key technical levels. Plotting USD/JPY beside the S&P 500 in YCharts visually confirms this inverse relationship, easing client conversations about defensive pivots.
Technical Levels and What to Watch
Analysts flag 142.50 as near-term support; a decisive break could target 138. Conversely, a surprise tariff extension or stronger U.S. CPI could propel USD/JPY back toward 148. Setting YCharts alerts at those thresholds keeps advisors ahead of algorithm-driven moves.
Portfolio Implications for Advisors
- Defensive Rotation: Yen rallies often coincide with flows into U.S. Treasuries (IEF) and gold (GLD).
- Currency-Hedged Exposure: For international equity allocations, consider hedged ETFs (e.g., DXJ) if yen strength persists.
- Relative-Value Trades: Compare unhedged MSCI EAFE returns with hedged versions in YCharts to quantify currency drag for clients.
By integrating BoJ policy notes, MOF capital-flow data, and TIC statistics into YCharts dashboards, advisors transform currency volatility into actionable insight; choosing hedges, sizing bond positions, and articulating the “why” behind every move.
Portfolio Moves Before Tariffs Resume
With only days left on the tariff pause clock, advisors are proactively revisiting portfolios. The possibility of tariff escalation (or an extension of the truce) presents a classic binary outcome scenario. Rather than guess policy outcomes, many advisors are preparing for both cases:
- Hedge for Escalation: This could mean increasing allocations to assets that historically benefit from trade conflicts. Think gold and yen exposure (via bullion ETFs or currency funds) and domestic-oriented stocks that aren’t as reliant on global supply chains. At the same time, reducing positions in trade-sensitive cyclicals (industrials, semiconductors, exporters) can mitigate downside if tariffs strike again.
- Position for Resolution: Conversely, if a last-minute deal emerges, risk assets could rally. Some advisors maintain a watchlist of beaten-down names in emerging markets or export-heavy sectors that might rebound on positive trade news. Balanced portfolios might keep a foot in both camps, emphasizing diversification.
Q: What steps can advisors take now to guard portfolios against tariff risks?
A: Advisors should stress-test and rebalance portfolios now. Using YCharts’ Scenario Analysis or Stress Testing tools, simulate a tariff spike: see which holdings would suffer from, say, a 10% drop in Chinese imports or a stronger yen. Hedge potential weak spots by adding safe havens (gold, JPY, defensive stocks) or trimming overexposed positions in client portfolios. Clear communication is key too, tell clients you’ve evaluated the “what ifs” and adjusted their allocation to weather either outcome.
Additionally, checking for concentration in tariff-vulnerable stocks is wise. YCharts’ Holdings Overlap or Fund Screener can identify if multiple funds hold the same at-risk multinationals (e.g., major exporters or firms with heavy China revenue). If a portfolio is inadvertently overloaded on a particular company or sector that could get hit by new tariffs, this is the time to dial that back. In proposals or review meetings, advisors are presenting these adjustments as part of a proactive strategy, turning the tariff countdown from a threat into an opportunity to demonstrate diligent risk management.
Staying Data-Driven: Tools to Track Trade Uncertainty
In such a fluid macro situation, data and visualization are an advisor’s best friend. This tariff saga can evolve overnight with a tweet or a headline. YCharts’ suite of tools helps ensure you’re not reacting blindly:
- Dashboard: Set up a custom dashboard to display real-time indicators that matter for trade. You might include export volumes, manufacturing PMI, currency rates like USD/JPY, and commodity indexes. By having these on one screen, advisors can quickly gauge if trade tension is truly spiking volatility or if markets are taking news in stride.
- Fundamental Charts: Create charts overlaying, for example, Copper Prices vs. Global Equity Indexes, or USD to JPY vs. VIX. Visual correlations help turn abstract market moves into concrete stories for clients. YCharts allows saving these charts and even adding recession or event markers, so you can highlight “Here’s when tariff talk heated up, and here’s how copper and the yen responded.”
- Alerts and Reports: Advisors are also leveraging YCharts’ alert features. For instance, you can get notified if Copper falls by another 5% in a week or if USD to JPY breaches a key level (indicating sudden yen strength). Armed with that info, you’re ready to email clients or update them in near real-time. And for more formal touchpoints, YCharts Custom Reports let you package these charts and data into a clean client-ready format – ideal for a quick “trade tensions update” newsletter to clients.
Conclusion: Guidance Through the Trade Fog
The tariff countdown is more than a news cycle—it’s a real-time case study in market psychology and portfolio resilience. Copper and USD to JPY might seem like niche metrics, but their moves speak volumes about investor expectations. As trade uncertainty hangs in the air, these indicators remind advisors to stay vigilant. Whether they signal a looming storm or a passing cloud, advisors equipped with the right data can navigate either scenario.
For clients, the message is clear: volatility can be managed with preparation. By tracking key market signals and adjusting strategies accordingly, you’re helping them stay on course. The coming days around this tariff decision will test nerves, but also present opportunities. Armed with YCharts’ analytics and a careful eye on copper and the yen, financial advisors can cut through the fog of trade war fears and lead with clarity, context, and confidence.
Whenever you’re ready, here’s how YCharts can help you:
1. Looking to Move On From Your Investment Research and Analytics Platform?
2. Want to test out YCharts for free?
Start a no-risk 7-Day Free Trial.
Disclaimer
©2025 YCharts, Inc. All Rights Reserved. YCharts, Inc. (“YCharts”) is not registered with the U.S. Securities and Exchange Commission (or with the securities regulatory authority or body of any state or any other jurisdiction) as an investment adviser, broker-dealer or in any other capacity, and does not purport to provide investment advice or make investment recommendations. This report has been generated through application of the analytical tools and data provided through ycharts.com and is intended solely to assist you or your investment or other adviser(s) in conducting investment research. You should not construe this report as an offer to buy or sell, as a solicitation of an offer to buy or sell, or as a recommendation to buy, sell, hold or trade, any security or other financial instrument. For further information regarding your use of this report, please go to: ycharts.com/about/disclosure
Next Article
June 2025 Jobs Report: Advisors Brace for Yield Curve SteepeningRead More →