Advisor Technology ROI: Why Usage Drives Real Returns
It’s shiny, it’s new, it’ll optimize every workflow in your organization and maybe even optimize you, too.
Tech platforms often flash impressive feature sets and dangle visions of operational transformation. But at the core of any tech stack decision comes a simple question: Will advisors actually use it?
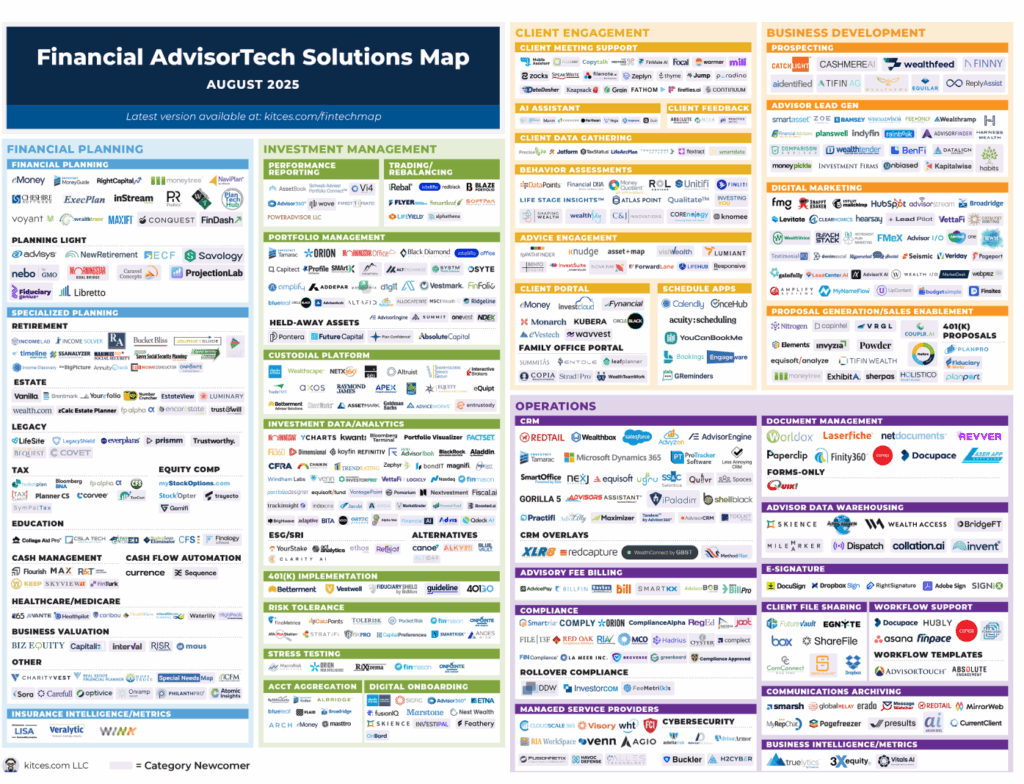
A quick glance at the latest Kitces FinTech Map shows how crowded the AdvisorTech landscape has become, expanding as if the industry had its own version of the Louisiana Purchase.
While optionality creates exciting opportunities, it also introduces decision fatigue. And when those decisions involve significant cost and firm-wide implementation, the stakes are high.
Adding to this complexity is technology’s growing role in business valuation. As Craig Iskowitz from Ezra Group reported from the T3 Conference in March 2025, “tech-forward firms command an 8.24x EBITDA multiple compared to 6.62x for traditional peers. That valuation premium translates to millions when selling a practice.”
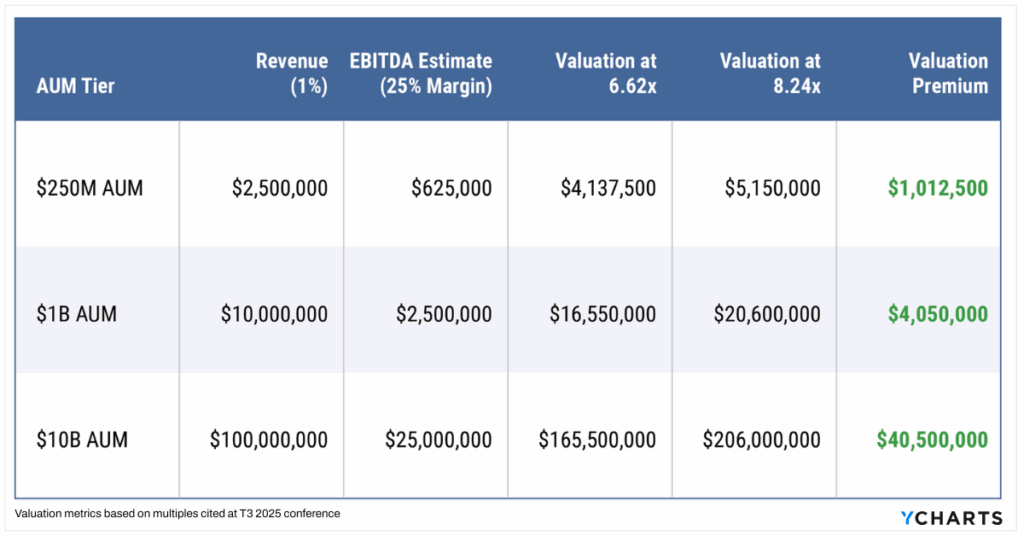
According to Iskowitz, one key reason for this valuation premium is that standardized technology adoption signals operational readiness to potential acquirers.
But it’s not just about optics.
Technology that truly improves advisor productivity across the entire organization drives more client face time, leading to higher organic growth.
“Right now, what we hear so frequently from advisors is that they want tools and technology that can help them win back more time in the week to spend on deepening client relationships,” said Andy Zolper, Chief Information Officer at Raymond James, in an interview with ThinkAdvisor.
So, how do you know if the technology you’ve invested in delivers on the promise of improving advisor productivity and fueling organic growth?
One word: Usage.
Why Usage Matters
Many investors are familiar with the difference between price and value. As Warren Buffett and Benjamin Graham have stated, “Price is what you pay; value is what you get.”
In this context, the price of the technology is straightforward; the value is in how often you use it and the business outcomes it drives.
Usage is the bridge between cost and ROI.
Technology can only deliver its full return when it becomes embedded in workflows, such as powering proposals, client reviews, and prospecting conversations.
The more integral it is to these core activities, the more it amplifies its value: accelerating growth, enhancing client communication, and streamlining operations far beyond its initial price tag.
See How Carson Group unified 150+ Offices with a Scalable Platform
A platform used in every prospect meeting that helps close business and convert leads provides exponentially more value than a cheaper tool that’s only opened once a month for a routine report.
And like any sound investment, usage compounds over time.
Each time the platform supports a proposal, drives a productive client review, or helps an advisor close new business, it adds incremental value.
The first proposal might save time. The tenth might help land an account. The hundredth?
As usage becomes more consistent across your team, client engagement, operational efficiency, and new revenue increase.
That’s why it’s not just about what a tool costs. It’s about what it empowers your team to do repeatedly.
Each additional client interaction, proposal sent, or portfolio conversation supported by the platform increases the tangible ROI, making adoption and cadenced usage as important as the sticker price.
Tracking Usage with DAUs, WAUs, MAUs
To continue our valuation analogy from the section above, how do you measure the “value” of technology once it’s deployed across a business?
When it comes to tracking product adoption and engagement, three metrics are standard practice: Daily Active Users (DAU), Weekly Active Users (WAU), and Monthly Active Users (MAU).
These metrics are commonly used to gauge growth and stickiness. For instance, Spotify (SPOT) announced in its Q2 2025 earnings report that it had added 18 million MAUs in a single quarter.
In investing, we use ratios like Price-to-Earnings (P/E) to contextualize a company’s valuation. The stock price alone doesn’t tell us if it is expensive or cheap; we need to understand how much value (earnings) it generates relative to what we pay for it.
The same concept applies to software adoption.
For advisory firms, DAU/WAU and WAU/MAU are signals of whether the tools your team logs into are actually moving the business forward or just shelfware with a login.
DAU/WAU and WAU/MAU function as a “usage-to-price” ratio, giving us a sense of how frequently a platform is being leveraged relative to its user base. High usage ratios indicate that the platform is fully embedded in workflows, delivering continuous value.
- DAU/WAU shows how many weekly users rely on the platform daily.
- WAU/MAU reflects how many monthly users sign in at least once a week.
Industry Benchmarks to Consider
When benchmarking across B2B SaaS:
- A healthy DAU/MAU ratio typically ranges from 10% to 20%, with best-in-class products exceeding 40% (Gainsight, Alexander Jarvis).
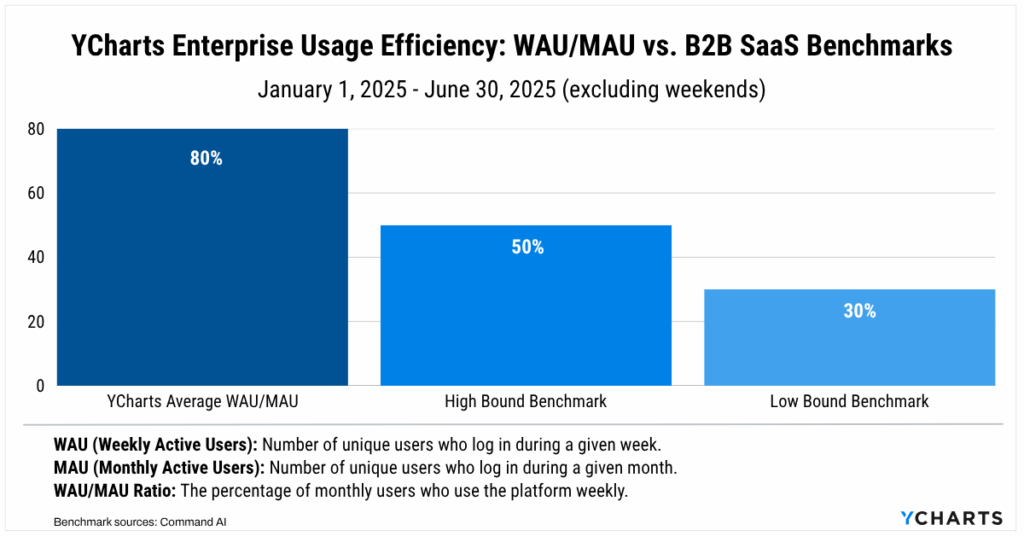
- A strong WAU/MAU ratio usually falls between 30% and 50%, especially for platforms designed for weekly workflows (Command AI).
Slack is a prime example of usage-driven value. Before being acquired by Salesforce in 2019, Slack reported 12 million DAUs out of 20+ million MAUs, achieving a DAU/MAU ratio of over 60%. While this level of engagement is atypical for most B2B SaaS products, it exemplifies the high stickiness achieved by tools designed for daily team collaboration.
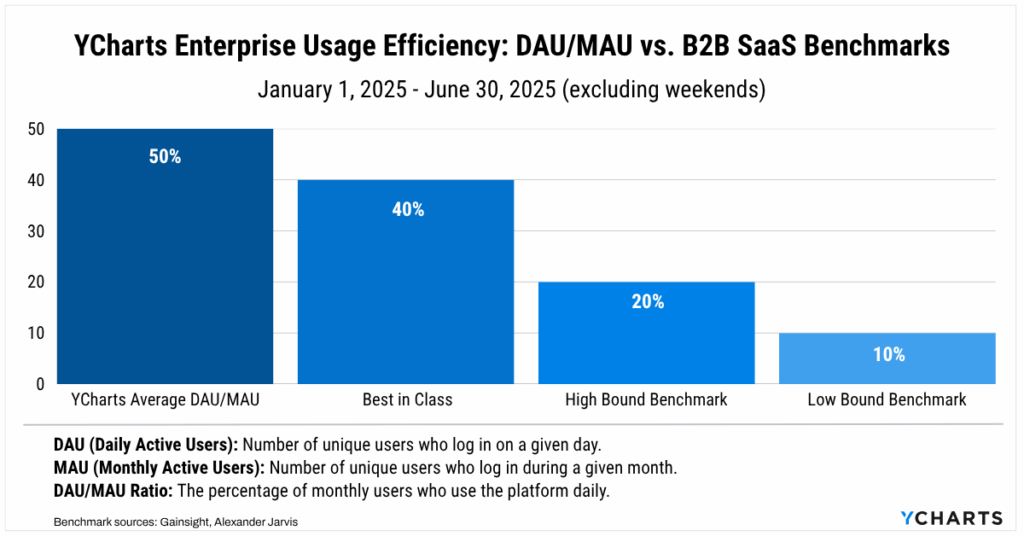
YCharts: Best-in-Class Usage Ratios
At YCharts, we view these ratios as leading indicators of business impact. Across our enterprise client base in the first half of 2025:
The average DAU/MAU ratio for YCharts is 50% (excluding weekends), outperforming typical B2B benchmarks.
Book time with our team to improve tech stack usage
The WAU/MAU ratio for YCharts averages 79.9% (excluding weekends), demonstrating how frequently advisors integrate YCharts into their weekly workflows.
Book time with our team to improve tech stack usage
These metrics are a reflection of real value creation. Each login represents an opportunity: a proposal sent, a client meeting prepped, or a market question answered quickly with confidence.
As Charlie Munger said, “It’s far better to buy a wonderful company at a fair price than a fair company at a wonderful price.”
The same principle applies to technology investments.
A platform that becomes deeply embedded in your daily workflows delivers returns far beyond its sticker price. In the long run, paying a fair price for a best-in-class platform yields far greater returns than underpaying for barely used tools. Usage is what turns cost into ROI.
What leads to Strong Usage
A core driver of strong platform adoption is “time to value,” or how quickly a person using the platform can experience something valuable.
For YCharts, time to value is defined by how effortlessly advisors can:
- Get onboarded after an acquisition.
- Monitor and manage client or model portfolios with precision.
- Generate standardized, compliant, yet personalized proposals that accelerate organic growth.
Having these capabilities is one thing. What truly drives adoption is having a dedicated strategy to ensure your team actively uses the technology you’ve invested in. That’s where YCharts sets itself apart.
Our Customer Success team provides white-glove support from day one. From onboarding through the life of our partnership, you’ll have a dedicated representative who tailors the YCharts experience to fit your firm’s unique needs and priorities.
Beyond onboarding, our enterprise solution includes:
- Unlimited one-on-one sessions to tackle specific use cases
- Firm-wide team calls to align on best practices
- Cadenced check-ins with key stakeholders to ensure the platform continues to meet evolving business goals.
This structure facilitates a tech implementation process you can look back on in a quarter, a year, or five and be confident it delivered lasting value.
Adoption Opens Doors. Usage Drives Business Outcomes.
We understand that technology doesn’t win clients, advisors are the ones who build trust, foster relationships, and align solutions with client goals.
In the same way, YCharts, the platform, is designed to augment your growing practice, while YCharts, “the people,” ensure you’re confident, supported, and consistently deriving value that translates into positive business outcomes.
That’s the real ROI: more impact, less friction, and a firm that’s built to grow.
Whenever you’re ready, here’s how YCharts can help you:
1. Want to benchmark your firm’s usage metrics?
Book time with our team to help you assess where you stand.
2. Want to test out YCharts for free?
Start a no-risk 7-Day Free Trial.
3. Want to see how YCharts Proposals helped double an advisors’ business?
Read Alan Cohen’s Success Story.
Disclaimer
©2025 YCharts, Inc. All Rights Reserved. YCharts, Inc. (“YCharts”) is not registered with the U.S. Securities and Exchange Commission (or with the securities regulatory authority or body of any state or any other jurisdiction) as an investment adviser, broker-dealer or in any other capacity, and does not purport to provide investment advice or make investment recommendations. This report has been generated through application of the analytical tools and data provided through ycharts.com and is intended solely to assist you or your investment or other adviser(s) in conducting investment research. You should not construe this report as an offer to buy or sell, as a solicitation of an offer to buy or sell, or as a recommendation to buy, sell, hold or trade, any security or other financial instrument. For further information regarding your use of this report, please go to: ycharts.com/about/disclosure
Next Article
5 Conversations That Turn Summer Into a Planning SeasonRead More →