Institutions Lead $200B Retreat from S&P Funds — But Core ETFs Gain Ground
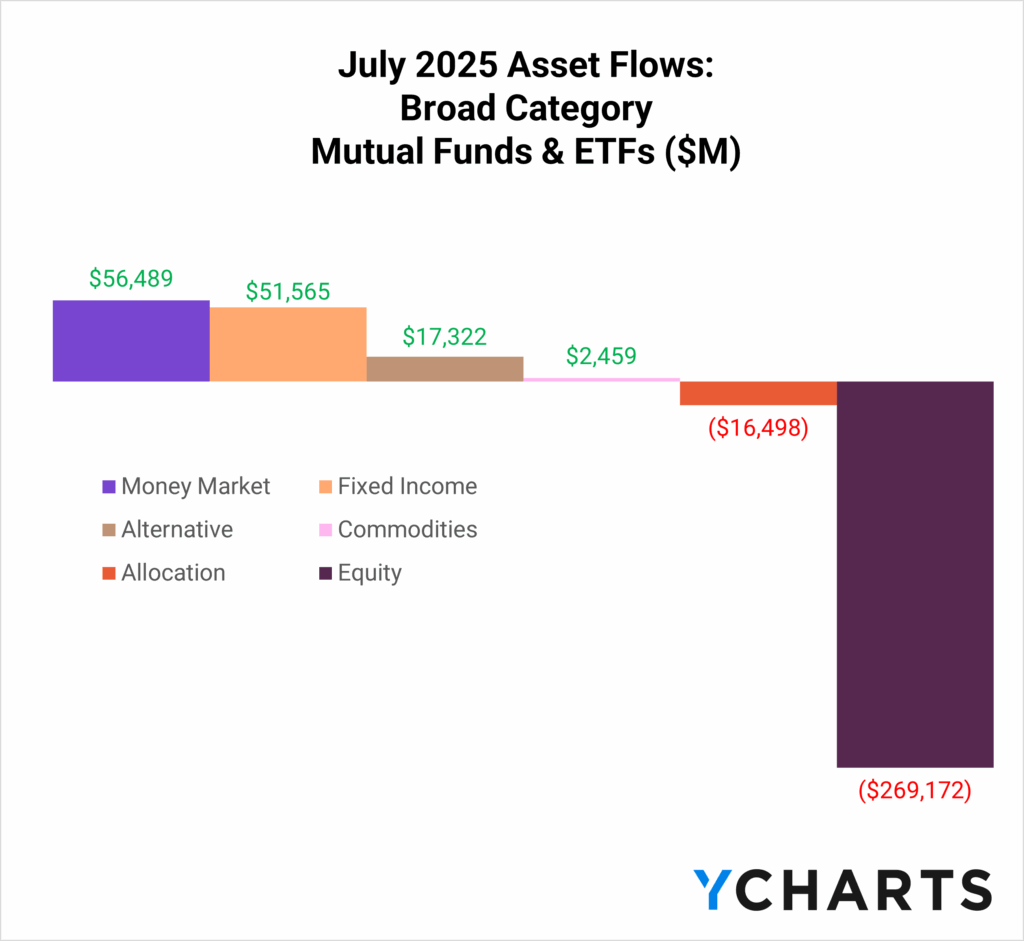
Stark outflows from equity strategies dominated July fund flows, as the asset class shed more than $270 billion across ETFs and mutual funds.
While fixed income and money market strategies collectively added nearly $100 billion, that headline misses the deeper story.
Subscribe to the Fund Flow Report
Sign up for our free monthly Fund Flow Report to stay updated on how assets are moving in and out of these strategies:
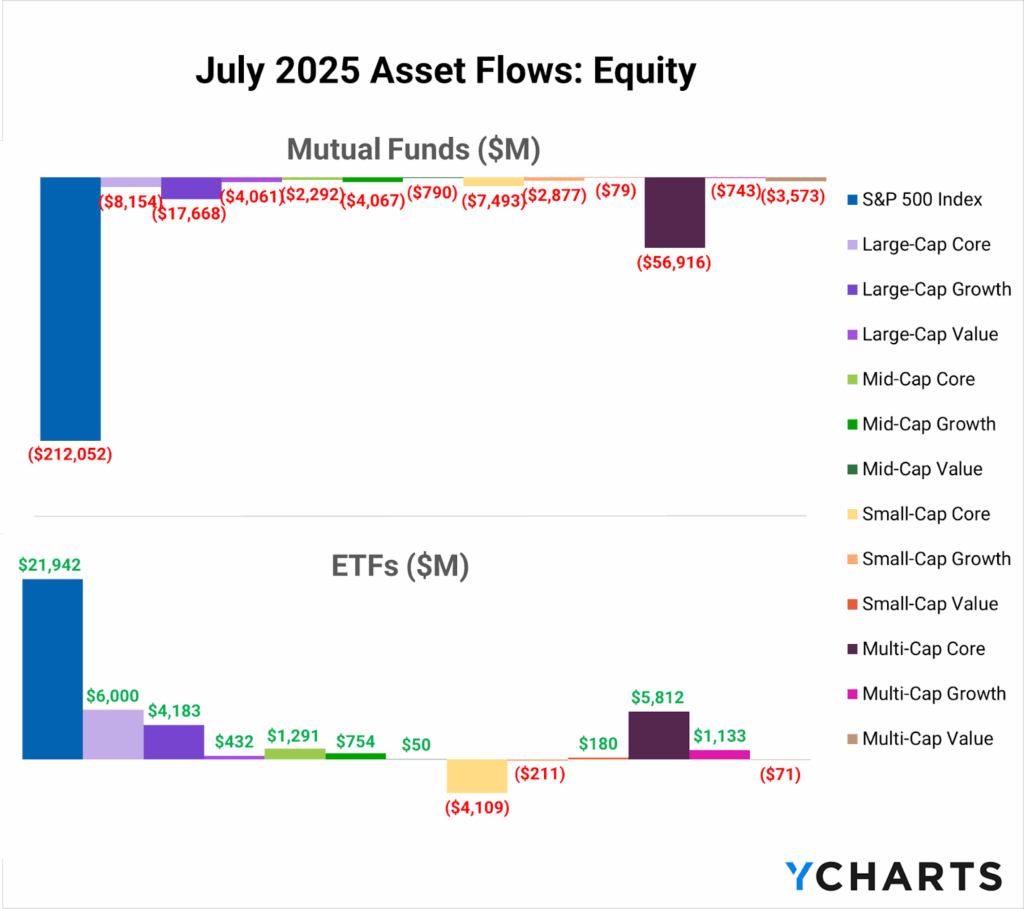
The equity bleed was driven by two sources: first, a capital-M, Massive $212 billion departure from S&P 500 mutual funds, and second, $56.9 billion in outflows from multi-cap mutual funds.
These two categories accounted for the lion’s share of redemptions and outweighed what was otherwise a relatively solid month for ETFs, where 10 of 13 equity categories managed net inflows.
Subscribe to the Fund Flow Report
What makes the S&P exodus particularly striking is where the money came from.
The largest single contributor was the Vanguard 500 Index Fund Institutional Select (VFFSX), which saw more than $200 billion in redemptions. Several other flagship S&P mutual funds, including offerings from Fidelity and DFA, posted multi-million dollar outflows.
One potential cause of the heightened outflows is a risk that has been relevant to the S&P 500 for some time: concentration.
Considering that institutional share classes like VFFSX are held almost exclusively by pensions, endowments, insurance companies, and large retirement platforms, this could suggest that concerns about market concentration are not limited to retail investors or advisors but also to some of the largest institutional allocators in the world.
At this point, the dominance of a handful of mega-cap tech companies is literally causing rules to be rewritten, just as Tiger Woods once forced golf courses to rethink their layouts in the late 1990s.
The practice known as “Tiger-proofing” caused courses like Augusta National (where the Masters is played) to famously lengthen their courses to keep up with Woods’ power.
Similarly, when S&P Dow Jones announced its “New Capping Mechanism” in 2024, it was effectively Tiger-proofing Select Sector indices, like those tracked by XLK, against the outsized weight of companies like Nvidia, Microsoft, and Apple.
July’s outflows from S&P mutual funds can be viewed in the same light; investors, including institutions, are Tiger-proofing their portfolios.
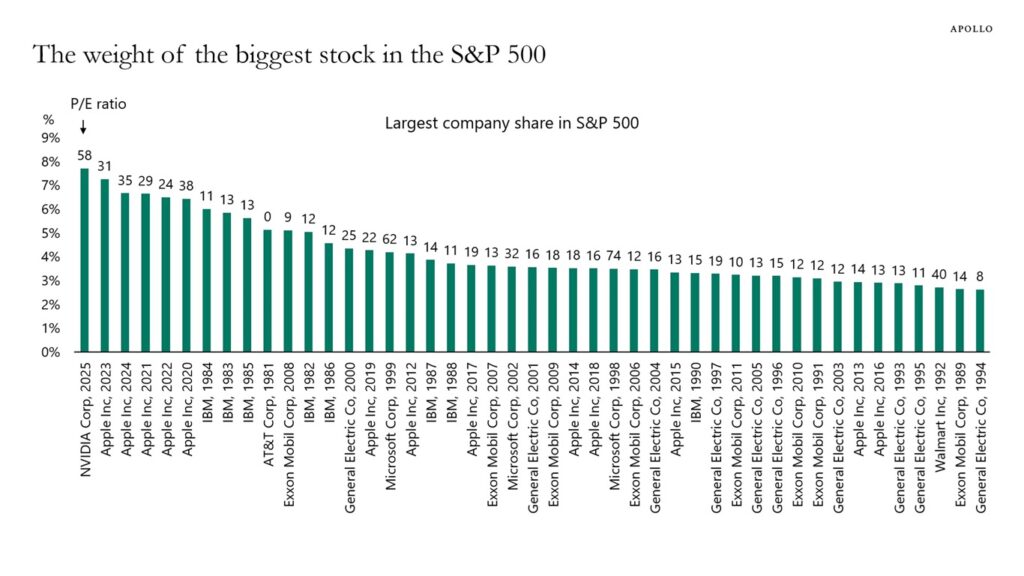
Today, the top 10 names account for 35% of the S&P 500, and in early August, Nvidia became the most highly concentrated stock in the index since 1981 (credit to Torsten Sløk and Apollo Global).
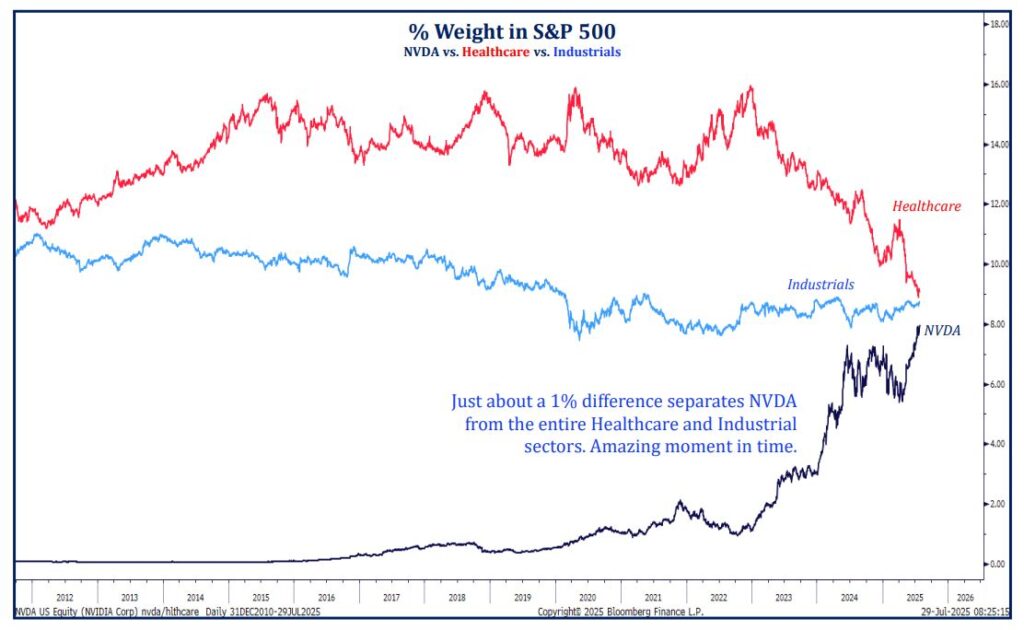
By itself, Nvidia has nearly the same weight in the S&P as the entire healthcare and industrial sectors (credit to Todd Sohn).
Investors appear to be taking a barbell approach in this era of heightened concentration.
On one side, they are diversifying away from the S&P through total market ETFs or increasing their international allocations.
On the other, they are showing a growing willingness to shed passive S&P investments and lean into concentration—but on their terms.
Rather than accepting the market-cap-weighted concentration of broad passive indexes like the S&P 500, they are opting for active or rules-based strategies where concentration is intentional rather than incidental.
Against this backdrop, three ETF peer groups each attracted more than $5 billion in July: International Multi-Cap Core, Large Cap Core, and Multi-Cap Core.
Below, we break down the funds that led flows in each category.
International Multi-Cap Core ETFs
International Multi-Cap Core ETFs were the strongest equity peer group in July, attracting $7 billion and bringing year-to-date inflows to $30.8 billion. With a total addressable market approaching $574 billion, the category continues to serve as a core vehicle for advisors seeking diversification beyond U.S. equities.
The Vanguard Total International Stock ETF (VXUS) led the way with $2.4 billion in July inflows and nearly $10 billion YTD, equal to 10.2% of its assets. The Vanguard Developed Markets ETF (VEA) followed with $1.8 billion for the month and $6.2 billion YTD, while the iShares Core MSCI EAFE ETF (IEFA) added $1.5 billion in July and $1.8 billion year-to-date.
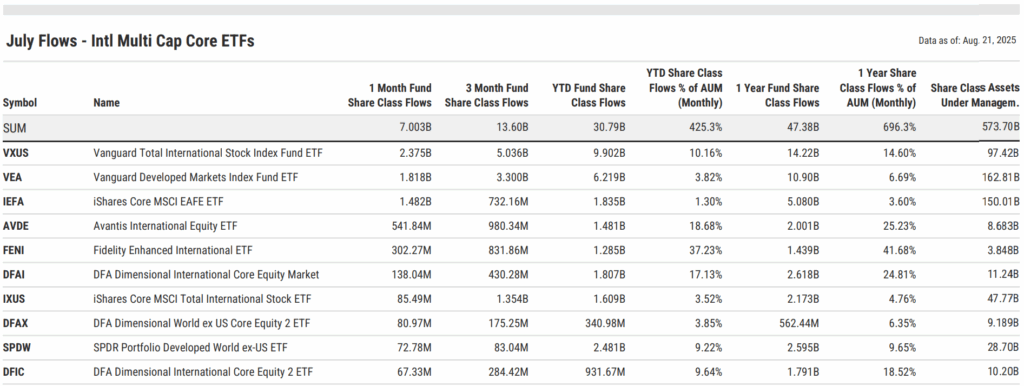
Start a Free Trial to See the Full Table | Modify in YCharts
The Avantis International Equity ETF (AVDE) brought in $542 million in July and $1.5 billion YTD, with inflows equal to 18.7% of its AUM. Similarly, the Fidelity Enhanced International ETF (FENI) added $302 million in July and $1.3 billion YTD, representing 37.2% of its assets this year.
Other standouts when looking at YTD flows relative to assets include the DFA Dimensional International Core Equity Market ETF (DFAI), with inflows equal to 17.1% of AUM, and the iShares International Equity Factor ETF (INTF), which has grown 32.3% YTD. A notable newcomer, the MFS Active International ETF (MFSI), which launched on December 4, 2024, has already accumulated more than $250 million in assets, signaling strong early adoption among advisors.
Taken together, these results underscore a dual trend in international allocations: Vanguard and iShares funds continue to anchor the bulk of global diversification, while newer active and factor-based entrants are scaling rapidly relative to their size, capturing advisor demand for intentional, higher-conviction exposure abroad.
Large Cap Core ETFs
Large Cap Core ETFs also had a strong showing in July, attracting $6 billion and lifting year-to-date inflows to $37.4 billion. With a total addressable market of more than $457 billion, the category has become one of the most dynamic spaces for non-index-based ETF innovation, as advisors look beyond traditional market-cap benchmarks to active, factor-driven, and rules-based strategies.
The iShares U.S. Equity Factor Rotation Active ETF (DYNF) led all peers with $1.8 billion in July and $6 billion YTD, or 28.2% of its assets. The Invesco S&P 500 Momentum ETF (SPMO) followed with $1.2 billion for the month and $5.7 billion YTD, representing more than half its AUM.
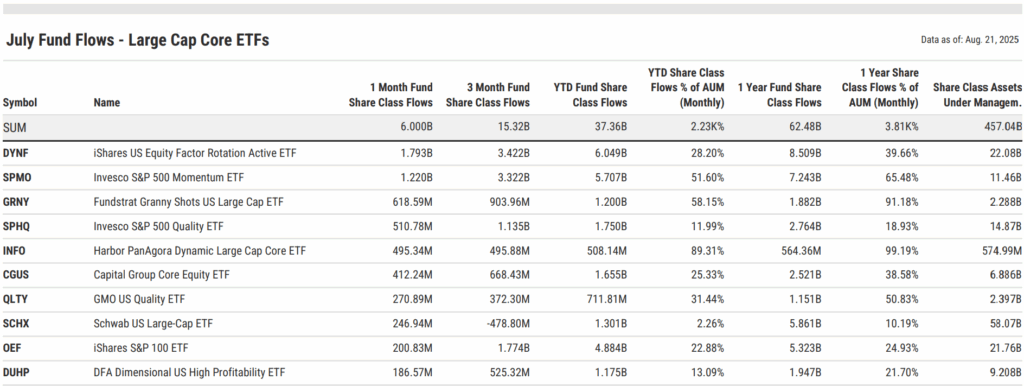
Start a Free Trial to See the Full Table | Modify in YCharts
One of the most remarkable stories of 2025 has been the Fundstrat Granny Shots U.S. Large Cap ETF (GRNY), which added $619 million in July and now manages $2.3 billion. Having launched in November 2024, GRNY has become one of the fastest ETFs on record to surpass the $2 billion milestone, underscoring the demand for high-conviction thematic strategies.
Other top performers included the Invesco S&P 500 Quality ETF (SPHQ), with $511 million in July inflows and $1.8 billion year-to-date, and the Harbor PanAgora Dynamic Large Cap Core ETF (INFO), which added $495 million in July. INFO, which debuted in October 2024, has already accumulated over $500 million in assets, highlighting rapid early adoption.
Beyond the top five, several other strategies are scaling quickly relative to their size. The Capital Group Core Equity ETF (CGUS) has attracted $1.7 billion YTD, or 25% of AUM. The GMO U.S. Quality ETF (QLTY) has grown by more than 31% of its AUM in 2025, while the DFA U.S. High Profitability ETF (DUHP) has seen inflows equal to 13% of assets. The Columbia Research Enhanced Core ETF (RECS) has also emerged as a standout, with inflows representing 43.6% of its AUM year-to-date.
Taken together, these flows reinforce Large Cap Core as one of the most exciting segments of the ETF market. Unlike traditional index-based products, the leaders here are almost entirely active or factor-driven, signaling growing advisor willingness to back innovative strategies redefining core equity allocations.
Multi-Cap Core ETFs
Multi-Cap Core ETFs added $5.8 billion in July, pushing year-to-date inflows to $30.9 billion. With a total addressable market exceeding $930 billion, multi-cap core remains a foundational allocation in advisor portfolios, capturing broad U.S. equity exposure in both passive and active vehicles.
The Vanguard Total Stock Market ETF (VTI) once again led the charge, gathering $4.2 billion in July and $20.9 billion year-to-date, equal to 4.1% of its AUM. The iShares Core S&P Total U.S. Stock Market ETF (ITOT) followed with $1.1 billion in July and $3.2 billion YTD, or 4.3% of assets.
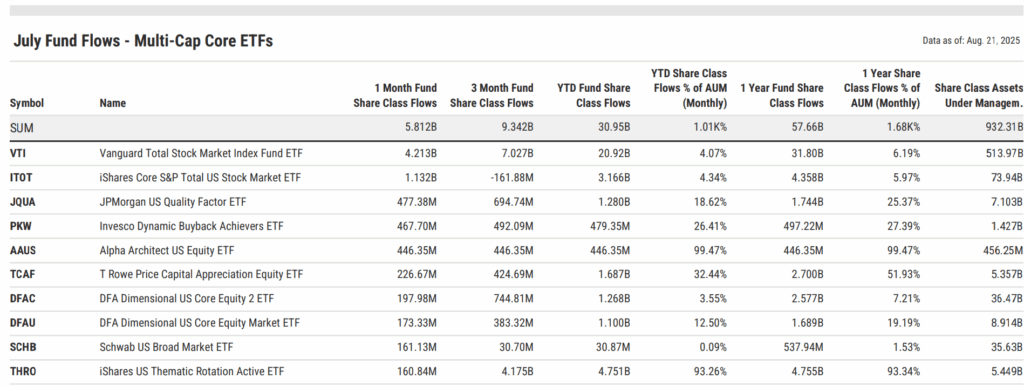
Start a Free Trial to See the Full Table | Modify in YCharts
Rounding out the top five were the JPMorgan U.S. Quality Factor ETF (JQUA) with $477 million in July inflows, the Invesco Dynamic Buyback Achievers ETF (PKW) at $468 million, and the T. Rowe Price Capital Appreciation Equity ETF (TCAF) with $227 million for the month and $1.7 billion YTD, equal to 32.4% of its assets.
Outside the top five, the DFA U.S. Core Equity Market ETF (DFAU) added $173 million in July and $1.1 billion YTD, or 12.5% of AUM, signaling consistent adoption among advisors. Meanwhile, the iShares U.S. Thematic Rotation Active ETF (THRO), which pulled in $161 million in July and $4.8 billion YTD, saw a dramatic volume spike in July, suggesting its inclusion into model portfolios.
The category shows how advisors blend beta and conviction to power their core equity allocations, from massive index-tracking anchors like VTI and ITOT, to active funds like TCAF and DFAU.
Conclusion: ETF Innovation is Meeting Investor Demand
July’s flows underscored a striking divide: while legacy S&P 500 mutual funds saw historic redemptions, equity ETFs in International Multi-Cap, Large Cap Core, and Multi-Cap Core together captured nearly $19 billion in new assets.
This shift highlights how institutions and advisors are actively “Tiger-proofing” portfolios, reducing reliance on cap-weighted benchmarks and leaning into diversification, active, and factor-driven strategies.
To keep up with how investors are repositioning across asset classes, subscribe to our monthly Fund Flows Report and get the full breakdown delivered directly to your inbox.
Whenever you’re ready, here’s how YCharts can help you:
Unlock access to our Fund Flows Report and Visual Deck by becoming a client.
Dive into YCharts with a no-obligation 7-Day Free Trial now.
Sign up for a copy of our Fund Flows Report and Visual Deck (clients only):
Follow YCharts Social Media to Unlock More Content!
Disclaimer
©2025 YCharts, Inc. All Rights Reserved. YCharts, Inc. (“YCharts”) is not registered with the U.S. Securities and Exchange Commission (or with the securities regulatory authority or body of any state or any other jurisdiction) as an investment adviser, broker-dealer or in any other capacity, and does not purport to provide investment advice or make investment recommendations. This report has been generated through application of the analytical tools and data provided through ycharts.com and is intended solely to assist you or your investment or other adviser(s) in conducting investment research. You should not construe this report as an offer to buy or sell, as a solicitation of an offer to buy or sell, or as a recommendation to buy, sell, hold or trade, any security or other financial instrument. For further information regarding your use of this report, please go to: ycharts.com/about/disclosure.
Next Article
2025 U.S. Manufacturing: Critical Policy Changes, Automation, and Investment TrendsRead More →