6 Reasons That Would Lead to Fed Rate Cuts
Published: August 25, 2025 | Analysis by YCharts Research Team
Federal Reserve Chair Jerome Powell’s Jackson Hole remarks last week signaled a potential shift in monetary policy: “With policy in restrictive territory, the baseline outlook and the shifting balance of risks may warrant adjusting our policy stance.” This statement leans more dovish than Powell’s previous statements which could be a positive signal for rate cuts in the short term.
For the opposing perspective on current economic conditions, our analysis of 6 reasons the Fed would hold rates explores scenarios where policy patience may prove more appropriate than accommodation.
With inflation moderating to 2.7% and unemployment at 4.2%, market participants are evaluating conditions that could lead to rate cuts.
For a comprehensive understanding of inflation’s broader market impact, see our analysis: What Is Inflation Doing to the Market?
Table of Contents
Current Landscape: Six Potential Catalysts
Our analysis identifies six conditions that could trigger Federal Reserve action, each with varying probabilities based on current economic data:
| Catalyst | Current Status | Key Metric | Trigger Level | Probability |
|---|---|---|---|---|
| Economic Slowdown | Q1: -0.5% | Q2: +3.0% | GDP Growth | <0% for 2 quarters | 60% Medium |
| Rising Unemployment | 4.2% ↑ | Unemployment Rate | >4.5% | 60% Medium |
| Falling Inflation | 2.7% ↓ | CPI YoY | <2.0% | 50% Medium |
| Financial Crisis | Stable | VIX Index | >30 | 25% Low |
| Global Weakness | Mixed signals | Global PMI | <48 | 55% Medium |
| Policy Over-tightening | Yield curve +50-60 bps | 2Y-10Y Spread | Restrictive policy | 55% Medium |
|
Powered by
|
||||
These factors suggest the Fed faces a complex decision environment. Let’s examine each potential catalyst and its implications for investment strategy.
Start Your 7-Day Free Trial to track these indicators in real-time with YCharts.
Reason #1: Economic Slowdown or Recession Risks
The Q1 2025 GDP contraction of -0.5% marked the first negative quarter since the pandemic, though Q2 rebounded to +3.0%. This mixed economic picture creates uncertainty about the growth trajectory.
Historically, the Fed has responded decisively to economic contractions. During the 2007-2009 recession, the Fed cut rates by 525 basis points. The 2001 recession saw 550 basis points of cuts. This pattern suggests that sustained economic weakness would likely prompt Fed action.
Current economic signals remain mixed:
- Manufacturing PMI: 48.0 (contraction territory)
- Retail Sales: +0.5% MoM (modest growth)
- Housing Starts: +12.9% YoY (surprising strength)
- Corporate Earnings: Sector-specific variations
The SPDR S&P 500 ETF (SPY) has historically posted gains of 15-20% in the 12 months following initial rate cuts during economic slowdowns, a pattern worth monitoring for tactical allocations.
Reason #2: Rising Unemployment and Labor Market Weakness
At 4.2%, unemployment remains relatively low by historical standards, but the trend bears watching. Powell’s Jackson Hole remarks noted that while the labor market “appears to be in balance,” it represents “a curious kind of balance” with “downside risks to employment rising.”
The Sahm Rule indicator, which historically signals recession when the 3-month unemployment average rises 0.5% above its 12-month low, is approaching its threshold. Additional labor market indicators show mixed signals:
- Initial jobless claims averaging 248K (below recession levels)
- Wage growth slowing to 3.8% YoY
- Job openings at 8.2M (declining but still elevated)
- Quits rate at 2.1% (suggesting reduced worker confidence)
Rate-sensitive sectors already show employment stress in construction and manufacturing, while services remain relatively stable. The Financial Select Sector SPDR (XLF) typically experiences distinct performance patterns following unemployment-driven rate adjustments.
Reason #3: Falling Inflation and Price Stability
The decline from 9.1% inflation in 2022 to 2.7% today represents one of the most rapid disinflation periods in Fed history. This trajectory toward the Fed’s 2% target could provide room for policy adjustment.
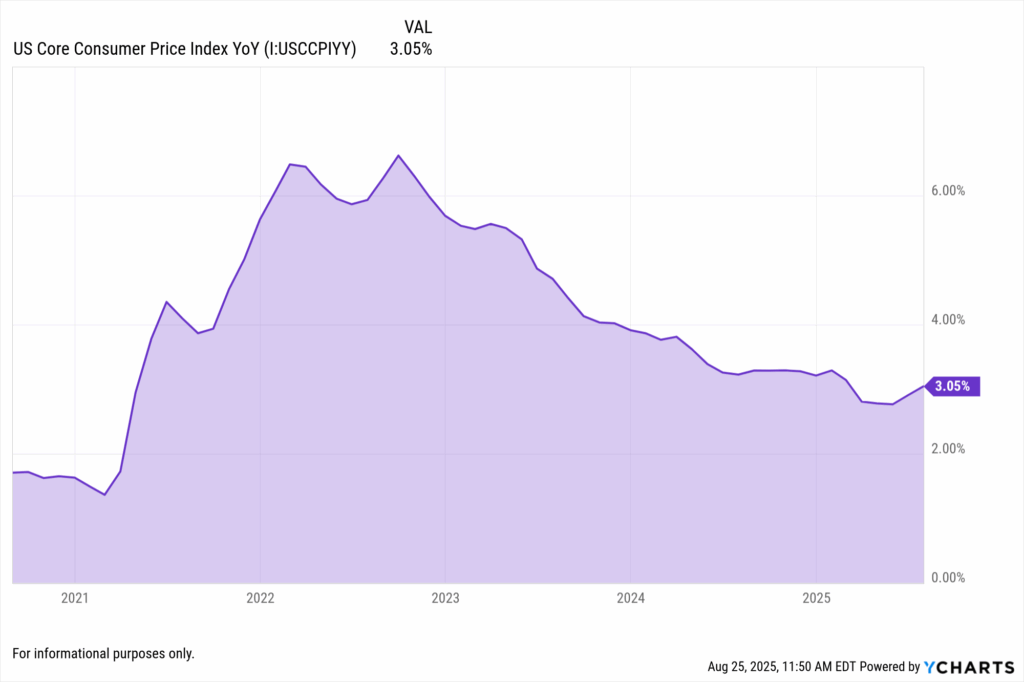
Core CPI at 3.1% continues trending lower, with housing costs, historically the stickiest component, beginning to show moderation. Energy inflation has turned deflationary at -1.6% YoY, while core services inflation remains elevated at 3.8%.
Market-based inflation expectations have converged near Fed targets:
- 5Y5Y Forward: ~2.0-2.3% range
- 10Y Breakeven: ~2.0-2.3% range
- 2Y Breakeven: ~2.0-2.3% range
The iShares 20+ Year Treasury Bond ETF (TLT) pricing reflects these inflation expectations, with yields declining 35 basis points from recent peaks.
Reason #4: Financial System Stress
While financial markets currently appear stable, the Fed monitors stress indicators closely. Any deterioration in financial conditions could prompt policy response.
Current stress indicators show mixed signals:
- VIX Index: 18-20 (within normal range)
- Investment Grade Spreads: 120 bps (normal range)
- High Yield Spreads: 380 bps (slightly elevated)
- Bank CDS Spreads: 85 bps (monitoring level)
Historical precedent shows the Fed acts preemptively to prevent financial contagion. The 1998 LTCM crisis triggered 75 basis points of cuts in three months. The 2008 financial crisis saw 525 basis points over 15 months. Major banks like JPMorgan Chase (JPM) and Bank of America (BAC) remain well-capitalized, though regional bank concerns persist.
Reason #5: Global Economic Conditions
International economic weakness could influence Fed policy decisions. Current global growth remains subdued:
- Eurozone: ~0.3% growth (near stagnation)
- China: ~4.2% growth (below trend)
- Japan: ~0.8% growth (minimal expansion)
- UK: ~0.1% growth (near recession)
- Emerging Markets: ~3.1% average (below potential)
The Dollar Index (DXY) declined below 100 following Jackson Hole, potentially reflecting changing rate expectations. Historical examples like the 1998 Asian crisis and 2019 trade tensions show the Fed sometimes provides “insurance cuts” to insulate the U.S. economy from global headwinds.
Market Expectations and Positioning
Fed funds futures currently price in the following path, though these expectations can shift with incoming data:
| Meeting Date | Current Rate | Market Expectation | Cut Probability | Total Cuts |
|---|---|---|---|---|
| September 2025 | 4.25-4.50% | 4.00-4.25% | 80% • 25 bps | 25 bps |
| November 2025 | 4.00-4.25% | 3.75-4.00% | 65-70% | 50 bps |
| December 2025 | 3.75-4.00% | 3.50-3.75% | 55-60% | 75 bps |
| January 2026 | 3.50-3.75% | 3.25-3.50% | 50-55% | 100 bps |
| March 2026 | 3.25-3.50% | 3.00-3.25% | 45-50% | 125 bps |
|
Powered by
|
||||
Note: Probabilities derived from: (1) Historical Fed response rates to similar conditions, (2) Current indicator distance from typical action thresholds, (3) Fed communication analysis, (4) Market pricing where available. Classifications: Low <30%, Medium 30-70%, High >70%”
These expectations suggest markets anticipate 75-100 basis points of cuts by year-end 2025, though this pricing may prove optimistic if economic conditions stabilize or inflation remains elevated.
Reason #6: Policy Stance Assessment
With the fed funds rate at 4.25-4.50% and neutral rate estimates around 2.5%, current policy sits approximately 200 basis points in restrictive territory. The yield curve recently turned positive (50-60 bps) after an extended inversion.
Historical precedents for preemptive policy adjustments include:
- 1995: 75 bps of cuts helped extend the expansion
- 1998: 75 bps of cuts mitigated contagion risks
- 2019: 75 bps of cuts provided economic cushion
The iShares 7-10 Year Treasury Bond ETF (IEF) positioning suggests fixed income markets are already adjusting to potential policy shifts.
Investment Implications by Sector
Understanding historical patterns can inform portfolio positioning decisions. Different sectors typically show distinct responses to rate cycles:
| Sector | Rate Cut Impact | ETF | Historical Pattern |
|---|---|---|---|
| Utilities | ++ Positive | XLU | Dividend yields become relatively attractive |
| Real Estate | ++ Positive | XLRE | Lower financing costs support valuations |
| Financials | − Negative | XLF | Net interest margins typically compress |
| Technology | + Positive | XLK | Growth valuations often benefit |
| Small Caps | ++ Positive | IWM | Credit-sensitive firms typically outperform |
|
Powered by
|
|||
These patterns are based on historical averages and may not predict future performance. Each cycle presents unique characteristics that can alter traditional relationships.
Start Your Free Trial to access our sector analysis tools.
Fixed Income Considerations
Rate expectations significantly impact fixed income positioning. Current opportunities across the duration spectrum include:
| Asset Class | Current Yield | Duration | Rate Sensitivity | ETF |
|---|---|---|---|---|
| Long Treasury | 4.25% | 17 years | +++ Highest | TLT |
| Intermediate Treasury | 4.15% | 7 years | ++ High | IEF |
| Investment Grade | 5.20% | 7 years | ++ High | LQD |
| High Yield | 7.80% | 4 years | + Moderate | HYG |
| Floating Rate | 6.50% | 0.25 years | −− Negative | FLOT |
|
Powered by
|
||||
Duration positioning becomes crucial if rate cuts materialize. Longer-duration assets typically benefit most from declining rates, while floating-rate instruments would see yields adjust lower.
Risk Factors to Monitor
Several factors could delay or prevent rate cuts:
Inflation Reacceleration (20% probability): Core CPI above 3.5% would likely pause Fed action. Housing costs and wage growth remain key watchpoints.
Geopolitical Shocks (25% probability): Oil prices above $100/barrel could complicate monetary policy decisions. Middle East tensions and supply chain disruptions warrant monitoring.
Fiscal Policy Changes (15% probability): Unexpected government spending could affect growth and inflation dynamics. Deficit trajectories and policy proposals require attention.
Labor Market Resilience (30% probability): Unemployment below 4% might keep the Fed on hold. Monthly payroll reports and jobless claims provide early signals.
Dollar Crisis (10% probability): A sharp dollar decline could import inflation. International capital flows and currency markets need watching.
Historical Context and Patterns
Past rate cycles provide context, though each presents unique characteristics:
- Initial Market Response: Equities have historically rallied 4-8% in the first three months after cuts begin
- Relative Performance: Small caps have typically outperformed large caps by 5-7% in the first year
- Fixed Income Returns: Long-duration bonds have delivered 10-15% returns in the first 12 months
- Sector Rotation: REITs and utilities have historically benefited from the search for yield
- Currency Impact: The dollar has typically weakened 3-5% in the first six months
These patterns represent historical averages and may not repeat in future cycles.
Monitoring Framework
Key indicators to track for signs of Fed policy shifts:
High-Frequency Indicators (Daily/Weekly)
- VIX levels and term structure
- Treasury yield curve shape
- Dollar index movements
- Credit spread changes
- Fed funds futures pricing
Economic Releases (Monthly)
- Employment report (first Friday)
- CPI/PPI inflation data (mid-month)
- Retail sales and consumer sentiment
- ISM manufacturing and services indices
- Housing starts and existing home sales
Policy Signals (Ongoing)
- FOMC meeting minutes
- Fed speaker calendar
- Dot plot projections
- Financial stability reports
Use YCharts’ Economic Calendar to track all key releases and Fed communications.
Considerations for Advisors
The current environment presents both opportunities and challenges for portfolio management:
Portfolio Review Priorities
- Assess duration exposure in fixed income allocations
- Evaluate sector weights relative to rate sensitivity
- Review credit quality across holdings
- Consider international diversification implications
- Update risk management frameworks
Client Communication Topics
- Explain the Fed’s dual mandate and current trade-offs
- Set appropriate expectations based on historical patterns
- Discuss portfolio adjustments in context of long-term goals
- Address concerns about market volatility
- Review and update Investment Policy Statements as needed
Strategic Considerations
- Balance between positioning for cuts and maintaining prudent risk levels
- Consider the lag between Fed action and economic impact
- Evaluate the difference between market expectations and potential outcomes
- Maintain flexibility to adjust as conditions evolve
Ready to analyze Fed policy impacts on your portfolios?
Conclusion
The convergence of moderating inflation, evolving employment dynamics, and restrictive policy levels suggests the Fed faces important decisions ahead. While market pricing indicates expectations for rate cuts beginning in September, the actual path will depend on incoming economic data.
Powell’s Jackson Hole remarks signal the Fed is carefully weighing its options. The six factors we’ve analyzed, economic growth, employment, inflation, financial stability, global conditions, and policy stance, will determine the timing and magnitude of any policy adjustments.
For advisors, understanding these dynamics and their historical patterns can inform portfolio positioning and client communications. Whether the Fed cuts rates or maintains current policy, preparation and flexibility remain key to navigating the months ahead.
Ready to Move On From Your Investment Research and Analytics Platform?
Follow YCharts Social Media to Unlock More Content!
Disclaimer
©2025 YCharts, Inc. All Rights Reserved. YCharts, Inc. (“YCharts”) is not registered with the U.S. Securities and Exchange Commission (or with the securities regulatory authority or body of any state or any other jurisdiction) as an investment adviser, broker-dealer or in any other capacity, and does not purport to provide investment advice or make investment recommendations. This report has been generated through application of the analytical tools and data provided through ycharts.com and is intended solely to assist you or your investment or other adviser(s) in conducting investment research. You should not construe this report as an offer to buy or sell, as a solicitation of an offer to buy or sell, or as a recommendation to buy, sell, hold or trade, any security or other financial instrument. For further information regarding your use of this report, please go to: ycharts.com/about/disclosure.
Next Article
Institutions Lead $200B Retreat from S&P Funds — But Core ETFs Gain GroundRead More →