The Great Rate Cut Debate: Will the Fed Ease in 2025?
Published: September 10, 2025 | Analysis by YCharts Research Team
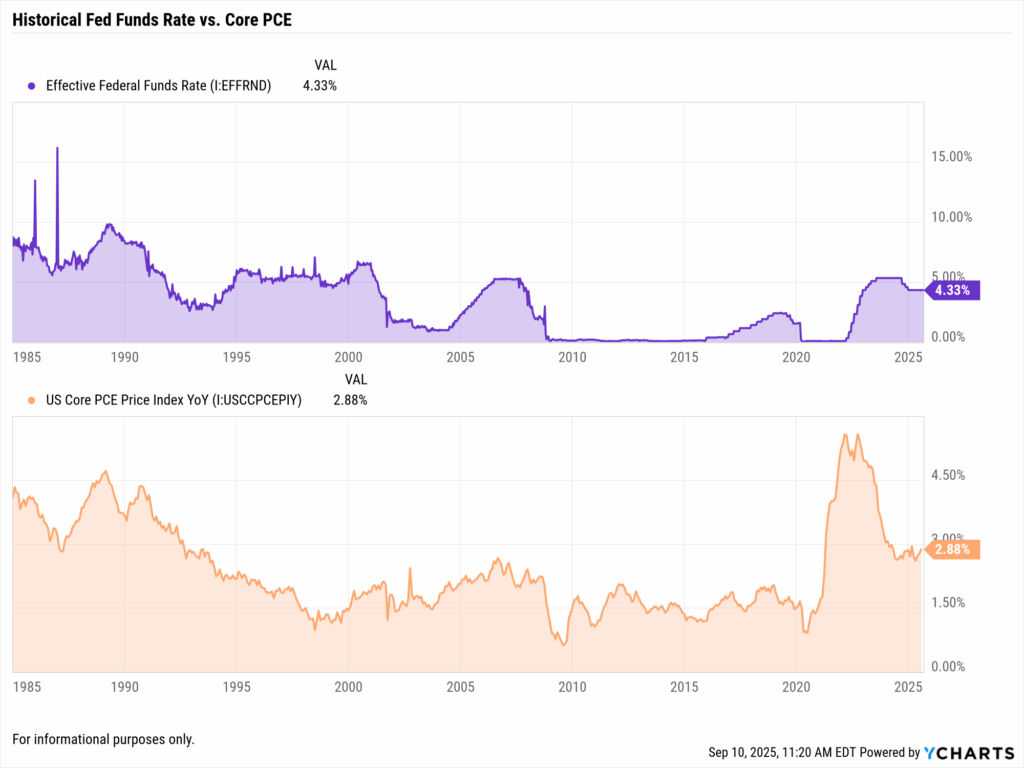
As the Federal Reserve maintains its target rate at 4.25-4.50%, financial markets find themselves at a critical juncture. With Core PCE inflation still elevated at 2.8% and unemployment at 4.2%, the central bank faces one of its most challenging policy decisions in recent history. This analysis examines the heated debate surrounding potential rate cuts in 2025, synthesizing arguments from both sides while providing institutional investors and financial advisors with data-driven insights.
The market currently prices in an 87% probability of a 0.25% rate cut in September 2025, yet significant disagreement persists about the timing, magnitude, and necessity of monetary easing. This divide reflects fundamental uncertainty about whether the Fed should prioritize fighting lingering inflation or supporting economic growth amid emerging weakness signals.
Table of Contents
The Current Economic Crossroads
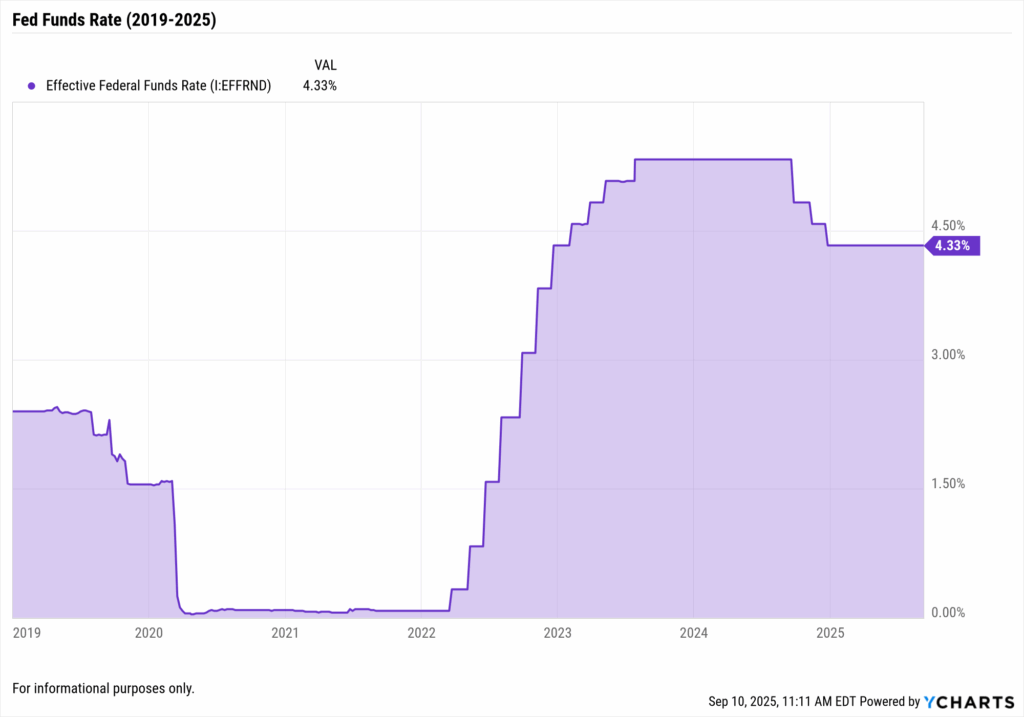
The U.S. economy presents a paradox that complicates monetary policy decisions. GDP growth rebounded to 3.0% annualized in Q2 2025 after a concerning -0.5% contraction in Q1, while unemployment has crept up to 4.3% from cycle lows. This mixed picture fuels intense debate about the appropriate policy path forward.
Major equity indices reflect this uncertainty, with the S&P 500 (SPY) showing resilience despite rate uncertainty, while small-caps (IWM) lag, suggesting concerns about tighter financial conditions’ impact on smaller companies. The technology-heavy Nasdaq (QQQ) continues to outperform, benefiting from the AI revolution that appears somewhat insulated from monetary policy shifts.
As we explored in our comprehensive analysis of what inflation is doing to the market, the persistence of services inflation at 4.9% annually remains the Fed’s primary concern. This stubborn inflation component, driven by wage pressures and structural factors in healthcare and housing, argues against premature easing.
Fed Rate Scenarios for 2025
| Scenario | Current Rate | End 2025 Target | Total Change | Market Probability | Key Drivers |
|---|---|---|---|---|---|
| Aggressive Cuts | 4.25-4.50% | 2.75-3.00% | -125 to -175 bps | 15% | Recession fears, financial stress |
| Moderate Cuts | 4.25-4.50% | 3.50-3.75% | -75 bps | 40% | Balanced approach, gradual normalization |
| Hold Steady | 4.25-4.50% | 4.25-4.50% | 0 bps | 20% | Persistent inflation, strong economy |
| Data Dependent | 4.25-4.50% | 3.75-4.00% | -50 bps | 25% | Meeting-by-meeting decisions |
|
Powered by
|
|||||
Source: YCharts analysis, Federal Reserve data, CME FedWatch Tool
The Case for Rate Cuts: Six Compelling Arguments
As detailed in our analysis of 6 reasons leading to Fed rate cuts, several factors support monetary easing:
1. Economic Slowdown Signals
The Q1 2025 GDP contraction of -0.5% sent shockwaves through markets. While Q2’s 3.0% rebound provided relief, the Manufacturing PMI remains in contraction territory at 48.0, suggesting underlying economic weakness. Leading economic indicators point to deceleration ahead, with the Conference Board’s LEI declining for three consecutive months.
2. Labor Market Softening
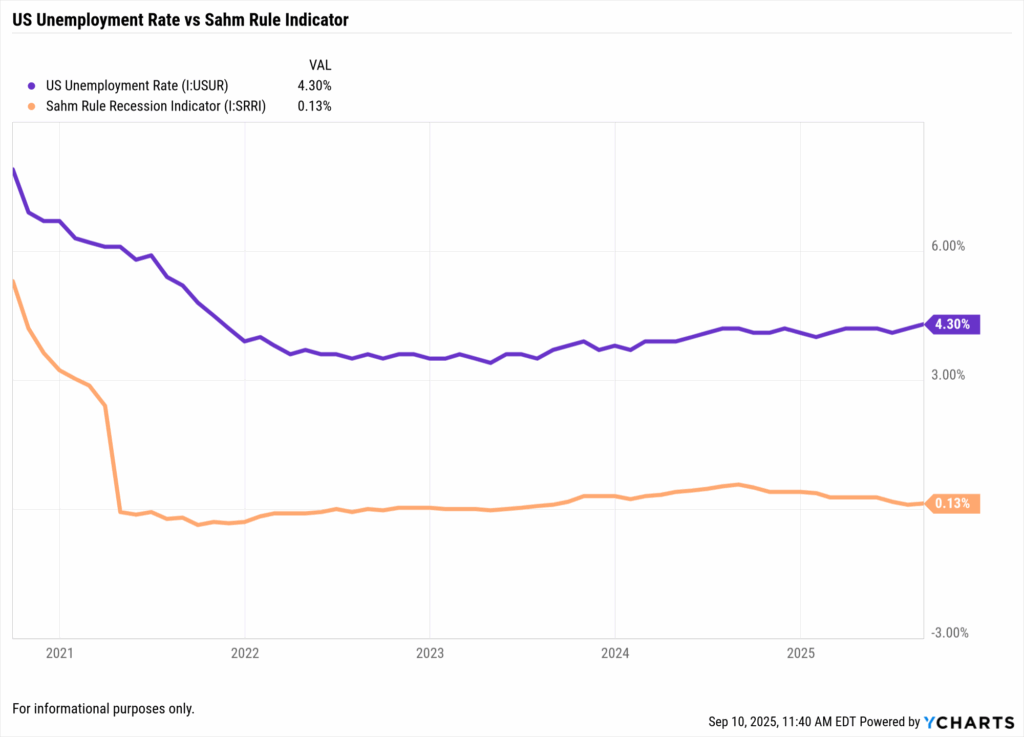
At 4.3%, unemployment approaches levels that historically trigger Fed action. The Sahm Rule recession indicator sits precariously close to its threshold, while wage growth has moderated to 4.3% year-over-year from peaks above 5%. Job openings have declined 25% from their peaks, indicating cooling labor demand.
3. Disinflation Progress
Headline inflation has fallen dramatically from 9.1% to 2.7%, approaching the Fed’s 2% target. Market-based inflation expectations, as measured by 5-year TIPS breakevens, hover near 2.0-2.3%, suggesting confidence in continued disinflation. The dramatic decline in commodity prices and easing supply chain pressures support this trajectory.
4. Global Economic Weakness
International growth concerns mount with the Eurozone growing at just 0.3%, China at 4.2% (well below historical norms), and the UK nearly stagnant at 0.1%. This synchronized global slowdown reduces inflationary pressures through weakened demand and lower commodity prices.
5. Financial Conditions Assessment
Current policy sits approximately 200 basis points above neutral rate estimates of 2.5%, placing significant restriction on economic activity. Real rates (adjusted for inflation) exceed 1.5%, historically high levels that may unnecessarily constrain growth.
6. Preemptive Action Precedent
Historical analysis shows the Fed often cuts rates preemptively to prevent recessions rather than react to them. With long and variable lags in monetary policy transmission, waiting for clear recession signals may prove too late.
The Case Against Cuts: Six Counterarguments
However, as examined in 6 reasons the Fed would hold rates, equally compelling arguments exist for maintaining current policy:
1. Persistent Services Inflation
Services inflation at 4.9% remains more than double the Fed’s target, driven by structural factors unlikely to respond quickly to monetary policy. Healthcare, insurance, and transportation costs continue rising at uncomfortable rates, suggesting premature easing could entrench inflation expectations.
2. Resilient Labor Market
Despite softening, 4.3% unemployment remains below long-term averages. The job openings-to-unemployed ratio at 1.3 indicates continued tightness, while 4.3% wage growth exceeds levels consistent with 2% inflation given productivity trends.
3. Robust Consumer Spending
Real consumer spending grew 3.2% in Q2 2025, powered by accumulated pandemic savings, wealth effects from rising asset prices, and solid wage growth. Travel and leisure spending exceeds pre-pandemic levels, hardly suggesting an economy requiring stimulus.
4. Loosened Financial Conditions
Despite elevated policy rates, financial conditions have paradoxically eased. The S&P 500’s 8.75% year-to-date gain, compressed credit spreads, and a weakening dollar (down 10%) all provide economic stimulus that could offset restrictive monetary policy.
5. Global Central Bank Coordination
Major central banks remain hawkish, with the ECB and Bank of England maintaining restrictive stances. Unilateral U.S. rate cuts could trigger currency market disruptions and import inflation through a weaker dollar.
6. Credibility Preservation
After the inflation surge of 2021-2023, the Fed must protect its hard-won credibility. Premature easing that allows inflation to reaccelerate would damage long-term inflation expectations anchoring, potentially requiring even more aggressive tightening later.
Historical Fed Rate Cut Cycles Comparison
| Cycle | Starting Rate | Ending Rate | Total Cuts | Duration | Economic Context | Market Performance |
|---|---|---|---|---|---|---|
| 2019-2020 | 2.50% | 0.25% | -225 bps | 8 months | COVID pandemic | -34% to +70% recovery |
| 2007-2008 | 5.25% | 0.25% | -500 bps | 15 months | Financial crisis | -57% peak to trough |
| 2001 | 6.50% | 1.75% | -475 bps | 12 months | Dot-com bust | -49% bear market |
| 1995 | 6.00% | 5.25% | -75 bps | 7 months | Soft landing | +34% S&P 500 |
| 1989-1992 | 9.75% | 3.00% | -675 bps | 36 months | S&L crisis | +28% over cycle |
|
Powered by
|
||||||
Source: YCharts historical database, Federal Reserve Economic Data
Sector and Asset Class Implications
Winners in a Rate-Cut Scenario:
- Real Estate (REITs): Lower rates reduce financing costs and increase property valuations
- Utilities: High-dividend sectors become more attractive as bond yields fall
- Technology Growth: Lower discount rates favor long-duration growth assets
- Small Caps: Reduced borrowing costs disproportionately benefit smaller companies
- Emerging Markets: Dollar weakness and improved liquidity conditions
Winners if Rates Hold:
- Financials: Banks benefit from wider net interest margins
- Money Market Funds: Continue attracting assets with 4%+ yields
- Value Stocks: Higher rates favor profitable, cash-flowing businesses
- Dollar Assets: Continued rate differential supports USD strength
Market Positioning by Rate Scenario
| Asset Class | Aggressive Cuts | Moderate Cuts | Rates Hold | Key Metrics to Monitor |
|---|---|---|---|---|
| U.S. Equities | +15-20% | +8-12% | +3-5% | P/E expansion, earnings revisions |
| Investment Grade Bonds | +8-10% | +4-6% | +1-2% | Duration, credit spreads |
| High Yield Bonds | +10-12% | +6-8% | +4-5% | Default rates, spread compression |
| Real Estate | +20-25% | +10-15% | -5% to 0% | Cap rates, mortgage rates |
| Commodities | +5-10% | 0-5% | -5% to 0% | Dollar index, global growth |
| International Equities | +12-18% | +8-10% | +5-7% | Currency effects, relative valuations |
|
Powered by
|
||||
Analysis based on YCharts historical scenario modeling
Portfolio Strategy Considerations
For Institutional Investors:
The current environment demands sophisticated scenario planning. Consider barbell strategies combining:
- Duration exposure through Treasury securities to benefit from potential rate cuts
- Equity positions in sectors with pricing power to hedge against sustained inflation
- Alternative investments providing uncorrelated returns
Portfolio stress testing across rate scenarios becomes crucial. YCharts’ portfolio analytics tools enable modeling various rate paths’ impacts on asset allocation, helping institutional investors prepare for multiple outcomes.
For Financial Advisors:
Client communication takes precedence during uncertain periods. Key strategies include:
- Rebalancing into weakness if rate uncertainty creates opportunities
- Extending duration gradually as rate cut probability increases
- Maintaining strategic allocation while tactically adjusting at margins
- Focusing on total return rather than yield chasing
The YCharts platform provides advisors with data visualization tools to illustrate rate scenarios’ portfolio impacts, facilitating informed client discussions about positioning.
The FOMC Calendar: Critical Decision Points
The Fed’s 2025 meeting schedule provides eight opportunities for policy adjustments:
- January 28-29: Assessment of Q4 2024 data and initial 2025 outlook
- March 18-19: First quarter evaluation with updated economic projections
- April 29-30: Spring assessment as data clarifies
- June 17-18: Mid-year comprehensive review with new dot plot
- July 29-30: Summer evaluation ahead of Jackson Hole
- September 16-17: Critical autumn meeting with updated projections
- November 4-5: Pre-year-end assessment
- December 16-17: Year-end positioning for 2026
Market participants increasingly focus on the September meeting as the potential inflection point, allowing sufficient time to assess inflation trends while avoiding acting too late if economic weakness accelerates.
Key Risk Factors and Monitoring Points
Inflation Indicators to Watch:
- Core PCE trends, particularly services ex-housing
- Wage growth trajectory and labor productivity
- Inflation expectations from TIPS breakevens and surveys
- Housing costs and owners’ equivalent rent
Growth Indicators Requiring Attention:
- Weekly jobless claims and continuing claims trends
- Consumer confidence and spending patterns
- Credit card delinquencies and auto loan defaults
- Corporate earnings guidance and capital expenditure plans
Financial Stability Metrics:
- Bank lending standards and loan demand
- Credit spreads across quality spectrum
- Term structure and yield curve dynamics
- Cross-asset correlations and volatility regimes
Conclusion: Navigating Unprecedented Uncertainty
The great rate-cut debate of 2025 reflects genuine uncertainty about the economy’s trajectory and appropriate policy response. While markets price in substantial easing, the case for maintaining restrictive policy remains credible given persistent inflation and economic resilience.
YCharts provides institutional investors and advisors with comprehensive tools for navigating this complexity, from economic data monitoring to portfolio stress testing and client communication resources.
As the debate intensifies heading into the Fed’s autumn meetings, one certainty emerges: the decisions made in 2025 will shape market dynamics for years to come. Whether the Fed cuts aggressively, moderately, or holds steady, investors must prepare for multiple scenarios while maintaining discipline and focusing on long-term objectives.
The next rate cut is coming! See how YCharts can help you prepare:
Follow YCharts Social Media to Unlock More Content!
Disclaimer
©2025 YCharts, Inc. All Rights Reserved. YCharts, Inc. (“YCharts”) is not registered with the U.S. Securities and Exchange Commission (or with the securities regulatory authority or body of any state or any other jurisdiction) as an investment adviser, broker-dealer or in any other capacity, and does not purport to provide investment advice or make investment recommendations. This report has been generated through application of the analytical tools and data provided through ycharts.com and is intended solely to assist you or your investment or other adviser(s) in conducting investment research. You should not construe this report as an offer to buy or sell, as a solicitation of an offer to buy or sell, or as a recommendation to buy, sell, hold or trade, any security or other financial instrument. For further information regarding your use of this report, please go to: ycharts.com/about/disclosure.
Next Article
How YCharts Helps Asset Managers Secure Assets in the Model ExplosionRead More →