The Best Performing Bond ETFs over the Last 10 Years
Updated as of: November 10, 2025
Bonds are often a dependable option for clients who prefer the relative safety of fixed income over an equity-focused investment strategy.
For advisors looking to gain their clients exposure to the bond market, bond ETFs offer a convenient and cost-effective method to achieve a diversified fixed income tilt for any portfolio.
Many types of bond ETFs are available on the open market, including those by issuer (ex. treasury bond ETFs, corporate bond ETFs, municipal bond ETFs), maturity (ex. short-term, intermediate-term and long-term bond ETFs), and credit quality (investment-grade and high-yield “junk” bond ETFs).
This article contains the best-performing bond ETFs from the last year all the way back to the past decade, with data routinely updated by YCharts.
To create this list, we analyzed the entire ETF universe using the YCharts Fund Screener to find the best-performing US-domiciled fixed income ETFs on a 1-year, 3-year, 5-year, and 10-year basis. (ETFs with leveraged or inverse attributes as well as those in the alternative currency strategy and options arbitrage strategy peer groups were excluded to focus on long-term investment vehicles that align with broader financial planning goals)
Table of Contents
Best Performing Bond ETFs in the Last Year
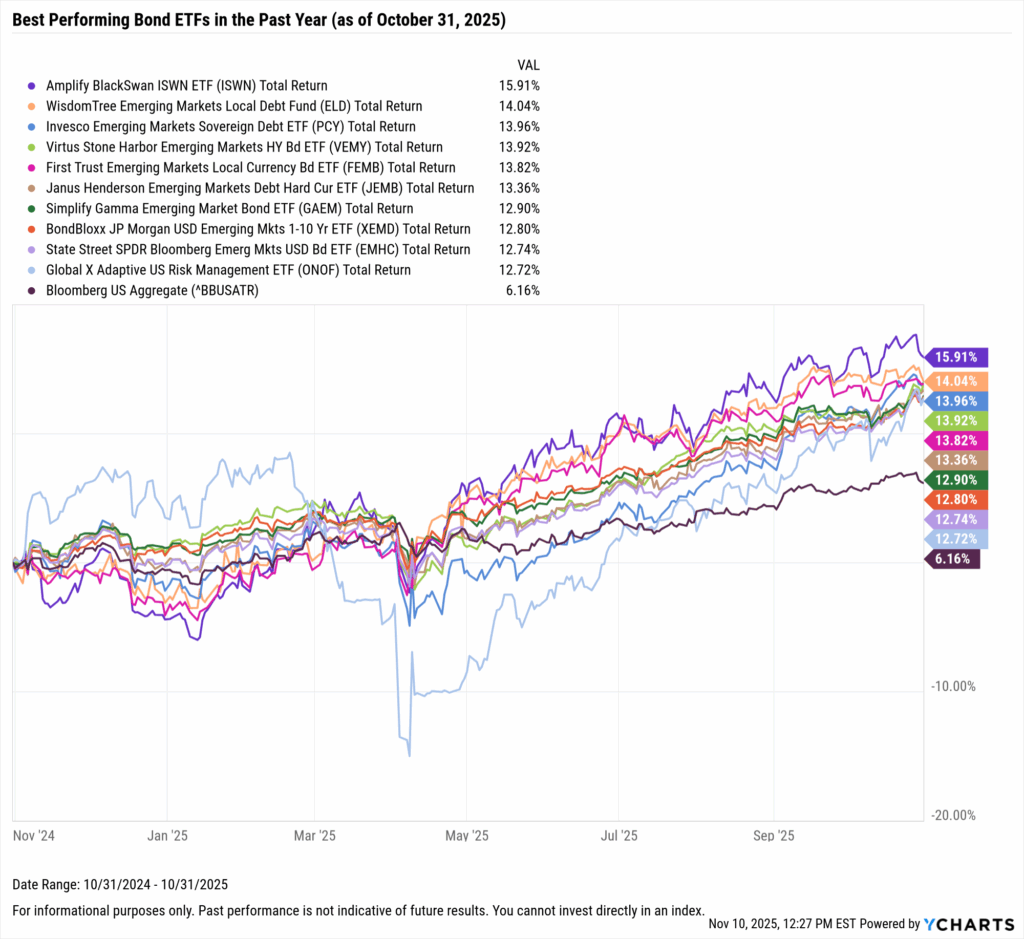
These are the top-performing bond ETFs over the past year, as of October 31, 2025.
| Symbol | Name | 1 Year Total Returns (Monthly) | Yield to Maturity | Effective Duration | Effective Maturity | Net Expense Ratio | Share Class Assets Under Management | Peer Group Name |
|---|---|---|---|---|---|---|---|---|
| ISWN | Amplify BlackSwan ISWN ETF | 15.91% | 3.98% | N/A | 7.3801 | 0.49% | $33,506,416 | General U.S. Treasury Funds |
| ELD | WisdomTree Emerging Markets Local Debt Fund | 14.04% | 6.43% | 4.68 | 7.5938 | 0.55% | $93,153,535 | Emerging Markets Local Currency Debt Fds |
| PCY | Invesco Emerging Markets Sovereign Debt ETF | 13.96% | 6.54% | 10.58 | 21.7984 | 0.50% | $1,283,588,456 | Emerging Mrkts Hard Currency Debt Funds |
| VEMY | Virtus Stone Harbor Emerging Markets HY Bd ETF | 13.92% | 7.51% | 4.64 | 8.2540 | 0.55% | $15,419,810 | Emerging Mrkts Hard Currency Debt Funds |
| FEMB | First Trust Emerging Markets Local Currency Bd ETF | 13.82% | 6.74% | 5.19 | 7.1169 | 0.85% | $274,929,041 | Emerging Markets Local Currency Debt Fds |
| JEMB | Janus Henderson Emerging Markets Debt Hard Cur ETF | 13.36% | 6.27% | 6.98 | 9.8315 | 0.52% | $421,355,575 | Emerging Mrkts Hard Currency Debt Funds |
| GAEM | Simplify Gamma Emerging Market Bond ETF | 12.90% | 6.81% | 6.06 | 11.1421 | 0.76% | $32,557,024 | Emerging Markets Local Currency Debt Fds |
| XEMD | BondBloxx JP Morgan USD Emerging Mkts 1-10 Yr ETF | 12.80% | 5.70% | 4.18 | 5.0873 | 0.29% | $561,763,582 | Emerging Mrkts Hard Currency Debt Funds |
| EMHC | State Street SPDR Bloomberg Emerg Mkts USD Bd ETF | 12.74% | 5.90% | 7.01 | 11.2972 | 0.23% | $223,949,756 | Emerging Mrkts Hard Currency Debt Funds |
| ONOF | Global X Adaptive US Risk Management ETF | 12.72% | N/A | N/A | N/A | 0.39% | $138,672,546 | Flexible Portfolio Funds |
Start a Free Trial to See Full Rankings | View & Modify in Fund Screener
Download Visual | Modify in YCharts
Best Performing Bond ETFs in the Last 3 Years
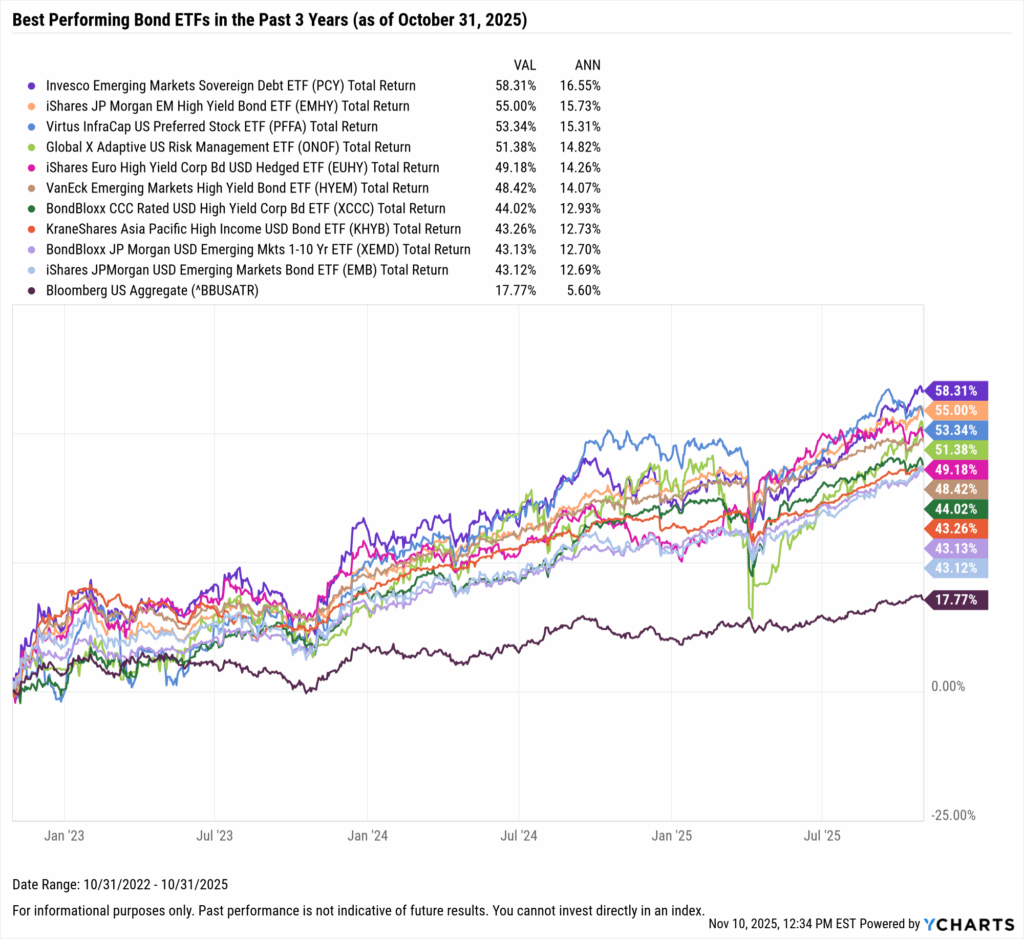
These are the top-performing bond ETFs on an annualized basis between November 1st, 2022 and October 31, 2025.
| Symbol | Name | 3 Year Total Returns (Monthly) | Annualized 3 Year Total Returns (Monthly) | Yield to Maturity | Effective Duration | Effective Maturity | Net Expense Ratio | Share Class Assets Under Management | Peer Group Name |
|---|---|---|---|---|---|---|---|---|---|
| PCY | Invesco Emerging Markets Sovereign Debt ETF | 58.31% | 16.55% | 6.54% | 10.58 | 21.7984 | 0.50% | $1,283,588,456 | Emerging Mrkts Hard Currency Debt Funds |
| EMHY | iShares JP Morgan EM High Yield Bond ETF | 55.00% | 15.73% | 6.87% | 5.02 | 8.9633 | 0.50% | $513,260,997 | Emerging Mrkts Hard Currency Debt Funds |
| PFFA | Virtus InfraCap US Preferred Stock ETF | 53.34% | 15.31% | 8.58% | N/A | 16.9316 | 2.48% | $1,883,919,854 | Flexible Income Funds |
| ONOF | Global X Adaptive US Risk Management ETF | 51.38% | 14.82% | N/A | N/A | N/A | 0.39% | $138,672,546 | Flexible Portfolio Funds |
| EUHY | iShares Euro High Yield Corp Bd USD Hedged ETF | 49.18% | 14.26% | 4.73% | 2.96 | 6.3701 | 0.35% | $70,922,070 | Global High Yield Funds |
| HYEM | VanEck Emerging Markets High Yield Bond ETF | 48.42% | 14.07% | 6.40% | 3.46 | 5.9361 | 0.40% | $436,499,715 | Emerging Mrkts Hard Currency Debt Funds |
| XCCC | BondBloxx CCC Rated USD High Yield Corp Bd ETF | 44.02% | 12.93% | 8.49% | 2.53 | 3.2288 | 0.40% | $241,726,161 | High Yield Funds |
| KHYB | KraneShares Asia Pacific High Income USD Bond ETF | 43.26% | 12.73% | 6.43% | N/A | 4.9885 | 0.69% | $23,176,266 | Emerging Mrkts Hard Currency Debt Funds |
| XEMD | BondBloxx JP Morgan USD Emerging Mkts 1-10 Yr ETF | 43.13% | 12.70% | 5.70% | 4.18 | 5.0873 | 0.29% | $561,763,582 | Emerging Mrkts Hard Currency Debt Funds |
| EMB | iShares JPMorgan USD Emerging Markets Bond ETF | 43.12% | 12.69% | 5.91% | 6.85 | 11.4184 | 0.39% | $14,629,748,888 | Emerging Mrkts Hard Currency Debt Funds |
Start a Free Trial to See Full Rankings | View & Modify in Fund Screener
Download Visual | Modify in YCharts
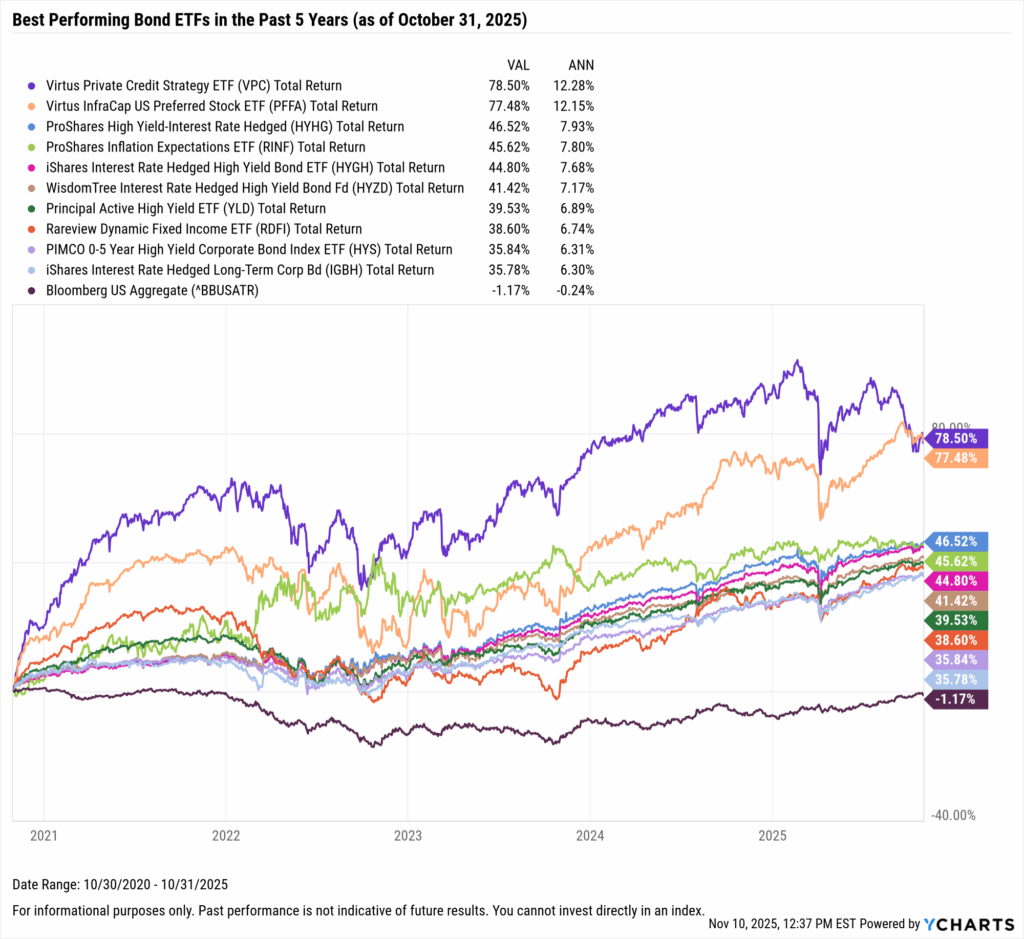
Best Performing Bond ETFs in the Last 5 Years
These are the top-performing ETFs on an annualized basis between November 1, 2020 and October 31, 2025.
| Symbol | Name | 5 Year Total Returns (Monthly) | Annualized 5 Year Total Returns (Monthly) | Yield to Maturity | Effective Duration | Effective Maturity | Net Expense Ratio | Share Class Assets Under Management | Peer Group Name |
|---|---|---|---|---|---|---|---|---|---|
| VPC | Virtus Private Credit Strategy ETF | 78.50% | 12.29% | 6.99% | N/A | 6.5062 | 0.75% | $50,201,056 | Specialty Fixed Income Funds |
| PFFA | Virtus InfraCap US Preferred Stock ETF | 77.48% | 12.16% | 8.58% | N/A | 16.9316 | 2.48% | $1,883,919,854 | Flexible Income Funds |
| HYHG | ProShares High Yield-Interest Rate Hedged | 46.52% | 7.94% | 6.38% | -0.07 | 5.4598 | 0.50% | $168,038,462 | High Yield Funds |
| RINF | ProShares Inflation Expectations ETF | 45.62% | 7.81% | 4.27% | 1.98 | 0.0134 | 0.30% | $19,128,965 | Inflation Protected Bond Funds |
| HYGH | iShares Interest Rate Hedged High Yield Bond ETF | 44.80% | 7.69% | 5.93% | 0.09 | 4.5086 | 0.52% | $437,579,541 | High Yield Funds |
| HYZD | WisdomTree Interest Rate Hedged High Yield Bond Fd | 41.42% | 7.18% | 5.43% | 0.17 | 4.9875 | 0.43% | $192,355,799 | High Yield Funds |
| YLD | Principal Active High Yield ETF | 39.53% | 6.89% | 5.87% | N/A | 5.4818 | 0.39% | $429,029,257 | High Yield Funds |
| RDFI | Rareview Dynamic Fixed Income ETF | 38.60% | 6.75% | 5.94% | N/A | 12.6059 | 4.46% | $58,157,195 | Multi-Sector Income Funds |
| HYS | PIMCO 0-5 Year High Yield Corporate Bond Index ETF | 35.84% | 6.32% | 6.18% | 2.02 | 2.9051 | 0.57% | $1,508,053,970 | High Yield Funds |
| IGBH | iShares Interest Rate Hedged Long-Term Corp Bd | 35.78% | 6.31% | 5.72% | 0.02 | 22.1640 | 0.14% | $129,152,782 | Corporate Debt Funds BBB-Rated |
Start a Free Trial to See Full Rankings | View & Modify in Fund Screener
Download Visual | Modify in YCharts
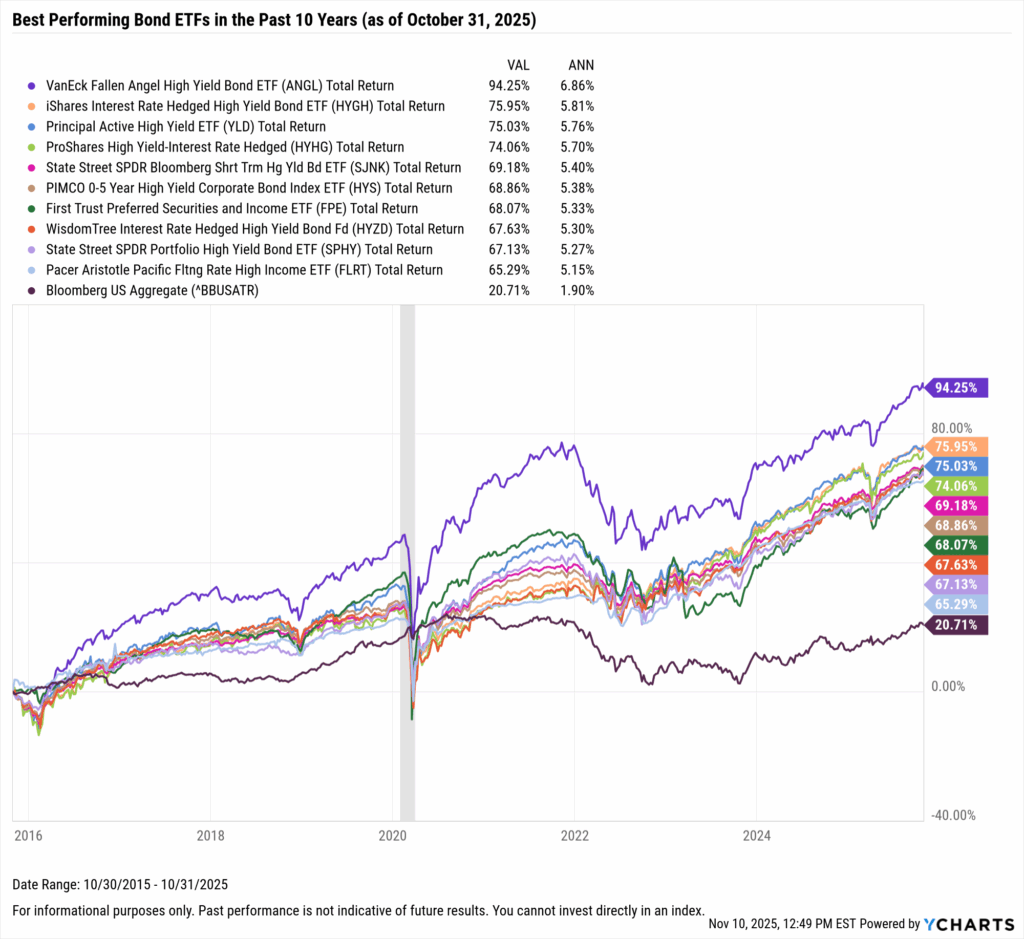
Best Performing Dividend ETFs in the Last 10 Years
These are the top-performing dividend ETFs on an annualized basis between November 1, 2015 and October 31, 2025.
| Symbol | Name | 10 Year Total Returns (Monthly) | Annualized 10 Year Total Returns (Monthly) | Yield to Maturity | Effective Duration | Effective Maturity | Net Expense Ratio | Share Class Assets Under Management | Peer Group Name |
|---|---|---|---|---|---|---|---|---|---|
| ANGL | VanEck Fallen Angel High Yield Bond ETF | 94.25% | 6.87% | 5.99% | 4.48 | 8.1411 | 0.25% | $3,068,984,909 | High Yield Funds |
| HYGH | iShares Interest Rate Hedged High Yield Bond ETF | 75.95% | 5.81% | 5.93% | 0.09 | 4.5086 | 0.52% | $437,579,541 | High Yield Funds |
| YLD | Principal Active High Yield ETF | 75.03% | 5.76% | 5.87% | N/A | 5.4818 | 0.39% | $429,029,257 | High Yield Funds |
| HYHG | ProShares High Yield-Interest Rate Hedged | 74.06% | 5.70% | 6.38% | -0.07 | 5.4598 | 0.50% | $168,038,462 | High Yield Funds |
| SJNK | State Street SPDR Bloomberg Shrt Trm Hg Yld Bd ETF | 69.18% | 5.40% | 5.33% | 1.95 | 2.4842 | 0.40% | $5,258,709,300 | Short High Yield Funds |
| HYS | PIMCO 0-5 Year High Yield Corporate Bond Index ETF | 68.86% | 5.38% | 6.18% | 2.02 | 2.9051 | 0.57% | $1,508,053,970 | High Yield Funds |
| FPE | First Trust Preferred Securities and Income ETF | 68.07% | 5.33% | 6.11% | 5.15 | 39.3911 | 0.85% | $6,279,326,743 | Flexible Income Funds |
| HYZD | WisdomTree Interest Rate Hedged High Yield Bond Fd | 67.63% | 5.30% | 5.43% | 0.17 | 4.9875 | 0.43% | $192,355,799 | High Yield Funds |
| SPHY | State Street SPDR Portfolio High Yield Bond ETF | 67.13% | 5.27% | 5.82% | 2.81 | 4.7043 | 0.05% | $9,983,567,101 | High Yield Funds |
| FLRT | Pacer Aristotle Pacific Fltng Rate High Income ETF | 65.29% | 5.15% | 7.04% | N/A | 6.8332 | 0.60% | $562,296,810 | Loan Participation Funds |
Start a Free Trial to See Full Rankings | View & Modify in Fund Screener
Download Visual | Modify in YCharts
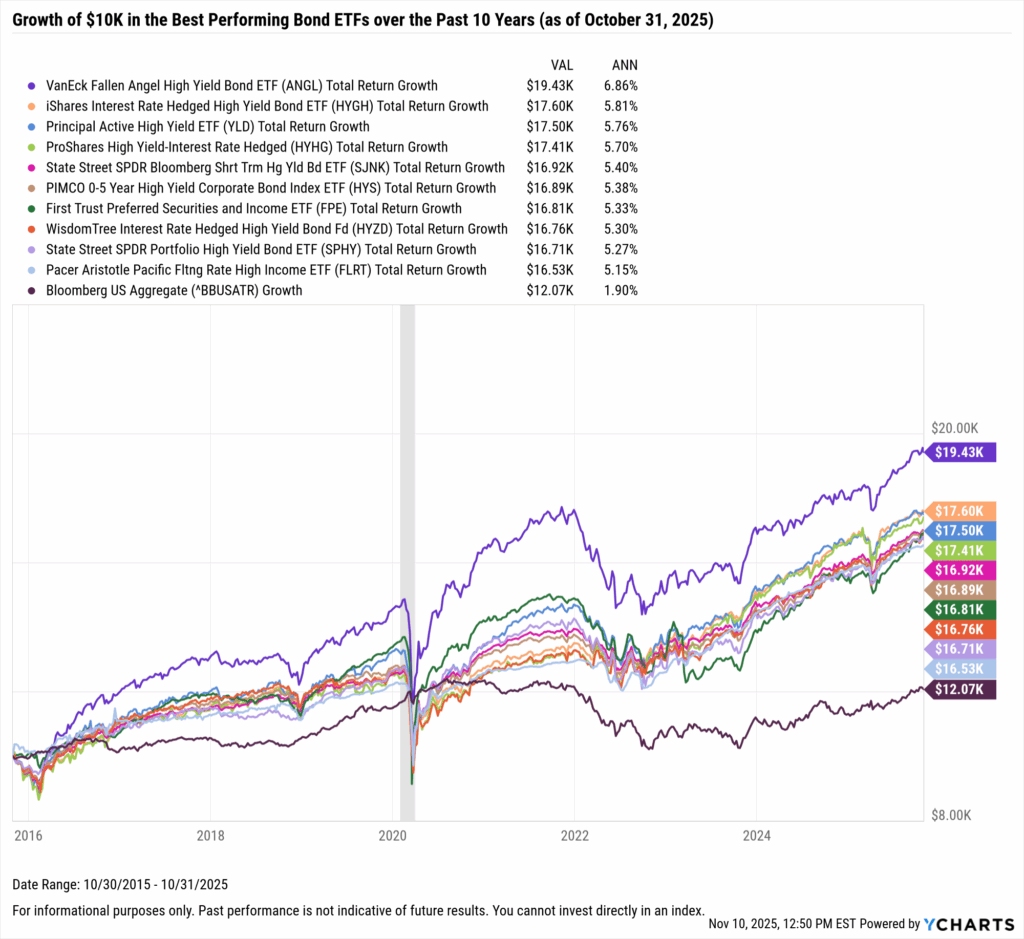
What Was the Growth of $10,000 in the Top Bond ETFs Over the Last 10 Years?
The best-performing bond ETF in the last ten years was the VanEck Fallen Angel High Yield Bond ETF (ANGL). A $10,000 investment into ANGL 10 years ago would be worth $19,430 today, netting a 6.9% annualized total return. Right behind it was the iShares Interest Rate Hedged High Yield Bond ETF (HYGH); investing $10,000 into HYGH back in 2015 would’ve turned into $17,600, a 5.8% annualized return assuming dividend reinvestment.
The ten best-performing bond ETFs over the last ten years successfully beat inflation during that timespan. By contrast, investing $10,000 into a benchmark bond index such as the Bloomberg US Aggregate index netted a total return of just 20% over the last ten years, or 1.9% on an annualized basis, which fell short of beating inflation over the last decade.
Download Visual | Modify in YCharts
Whenever you’re ready, here’s how YCharts can help you:
1. Interested in doing further ETF research with YCharts?
2. Want to test out YCharts for free?
Start a no-risk 7-Day Free Trial.
3. Sign up for a copy of our Fund Flows Report and Visual Deck to stay on top of mutual fund trends:
Sign up to recieve a copy of our monthly Fund Flows Report:Disclaimer
©2025 YCharts, Inc. All Rights Reserved. YCharts, Inc. (“YCharts”) is not registered with the U.S. Securities and Exchange Commission (or with the securities regulatory authority or body of any state or any other jurisdiction) as an investment adviser, broker-dealer or in any other capacity, and does not purport to provide investment advice or make investment recommendations. This report has been generated through application of the analytical tools and data provided through ycharts.com and is intended solely to assist you or your investment or other adviser(s) in conducting investment research. You should not construe this report as an offer to buy or sell, as a solicitation of an offer to buy or sell, or as a recommendation to buy, sell, hold or trade, any security or other financial instrument. For further information regarding your use of this report, please go to: ycharts.com/about/disclosure.
Next Article
YCharts Monthly Product Update: October 2025Read More →