Has the Market Gone Too Far? Reading the Signals Behind the Strength
- Do markets warrant continued pushes for new all-time highs, or is optimism running ahead of reality?
- Fear is beginning to creep back into headlines, but what signs of caution are truly worth watching?
- How can advisors position clients confidently amid record highs and rising uncertainty?
Interested in testing out YCharts for free?
Start 7-Day Free TrialHeadlines are filled with questions about whether markets have peaked. Concerns about recession, overextension, and the pace of growth dominate investor conversations as equities push higher.
Table of Contents
The S&P 500 is approaching a third consecutive year of 20 percent gains, an impressive run driven by resilient corporate earnings, steadying economic data, and rising investor optimism that has many advisors questioning how long the momentum can last.
That optimism extends beyond equities. Both growth-oriented and defensive assets have moved higher, highlighting how broad market sentiment has become:
- The S&P 500 has reached 32 new all-time highs in 2025, supported by earnings strength and expanding participation.
- Gold has risen over 50 percent to all-time highs this year, as investors continue to balance opportunity with caution.
- Alternatives like Bitcoin and Ethereum have also notched new all-time highs, both approaching 100 percent growth over the trailing twelve months.
The simultaneous climb of both risk and refuge assets underscores how unique this market cycle is. While equities remain strong, mixed signals within the current structure are prompting advisors to look deeper. Grounding client conversations in data can help reveal both the drivers of recent strength and the areas that warrant closer attention.
Momentum Is Broad, but Elevated
The strength of the market in 2025 has been strikingly widespread. What began as a narrow, tech-led rally last year has evolved into participation across nearly every sector and style. As of early mid-October, 150 S&P 500 companies are trading above their 20-, 50-, and 200-day moving averages, reflecting consistent momentum across timeframes.
This alignment shows momentum that has been sustained over time, buyers who continue to support higher prices, and that sentiment toward both individual companies and the broader market remains consistently positive.
Confidence has expanded beyond mega-cap leadership, with participation across every sector helping reinforce the uptrend. The rally is no longer being carried by a handful of names but by broad conviction across the market.
At the same time, the sheer number of companies trending higher suggests much of the market is already pricing in good news.
Valuations Steady as Earnings Expectations Rise
As participation has widened, the composition of market growth has shifted. Valuations have leveled off, while forward earnings expectations continue to rise. The S&P 500’s forward P/E ratio has eased to around 24, even as profit forecasts extend through 2026.
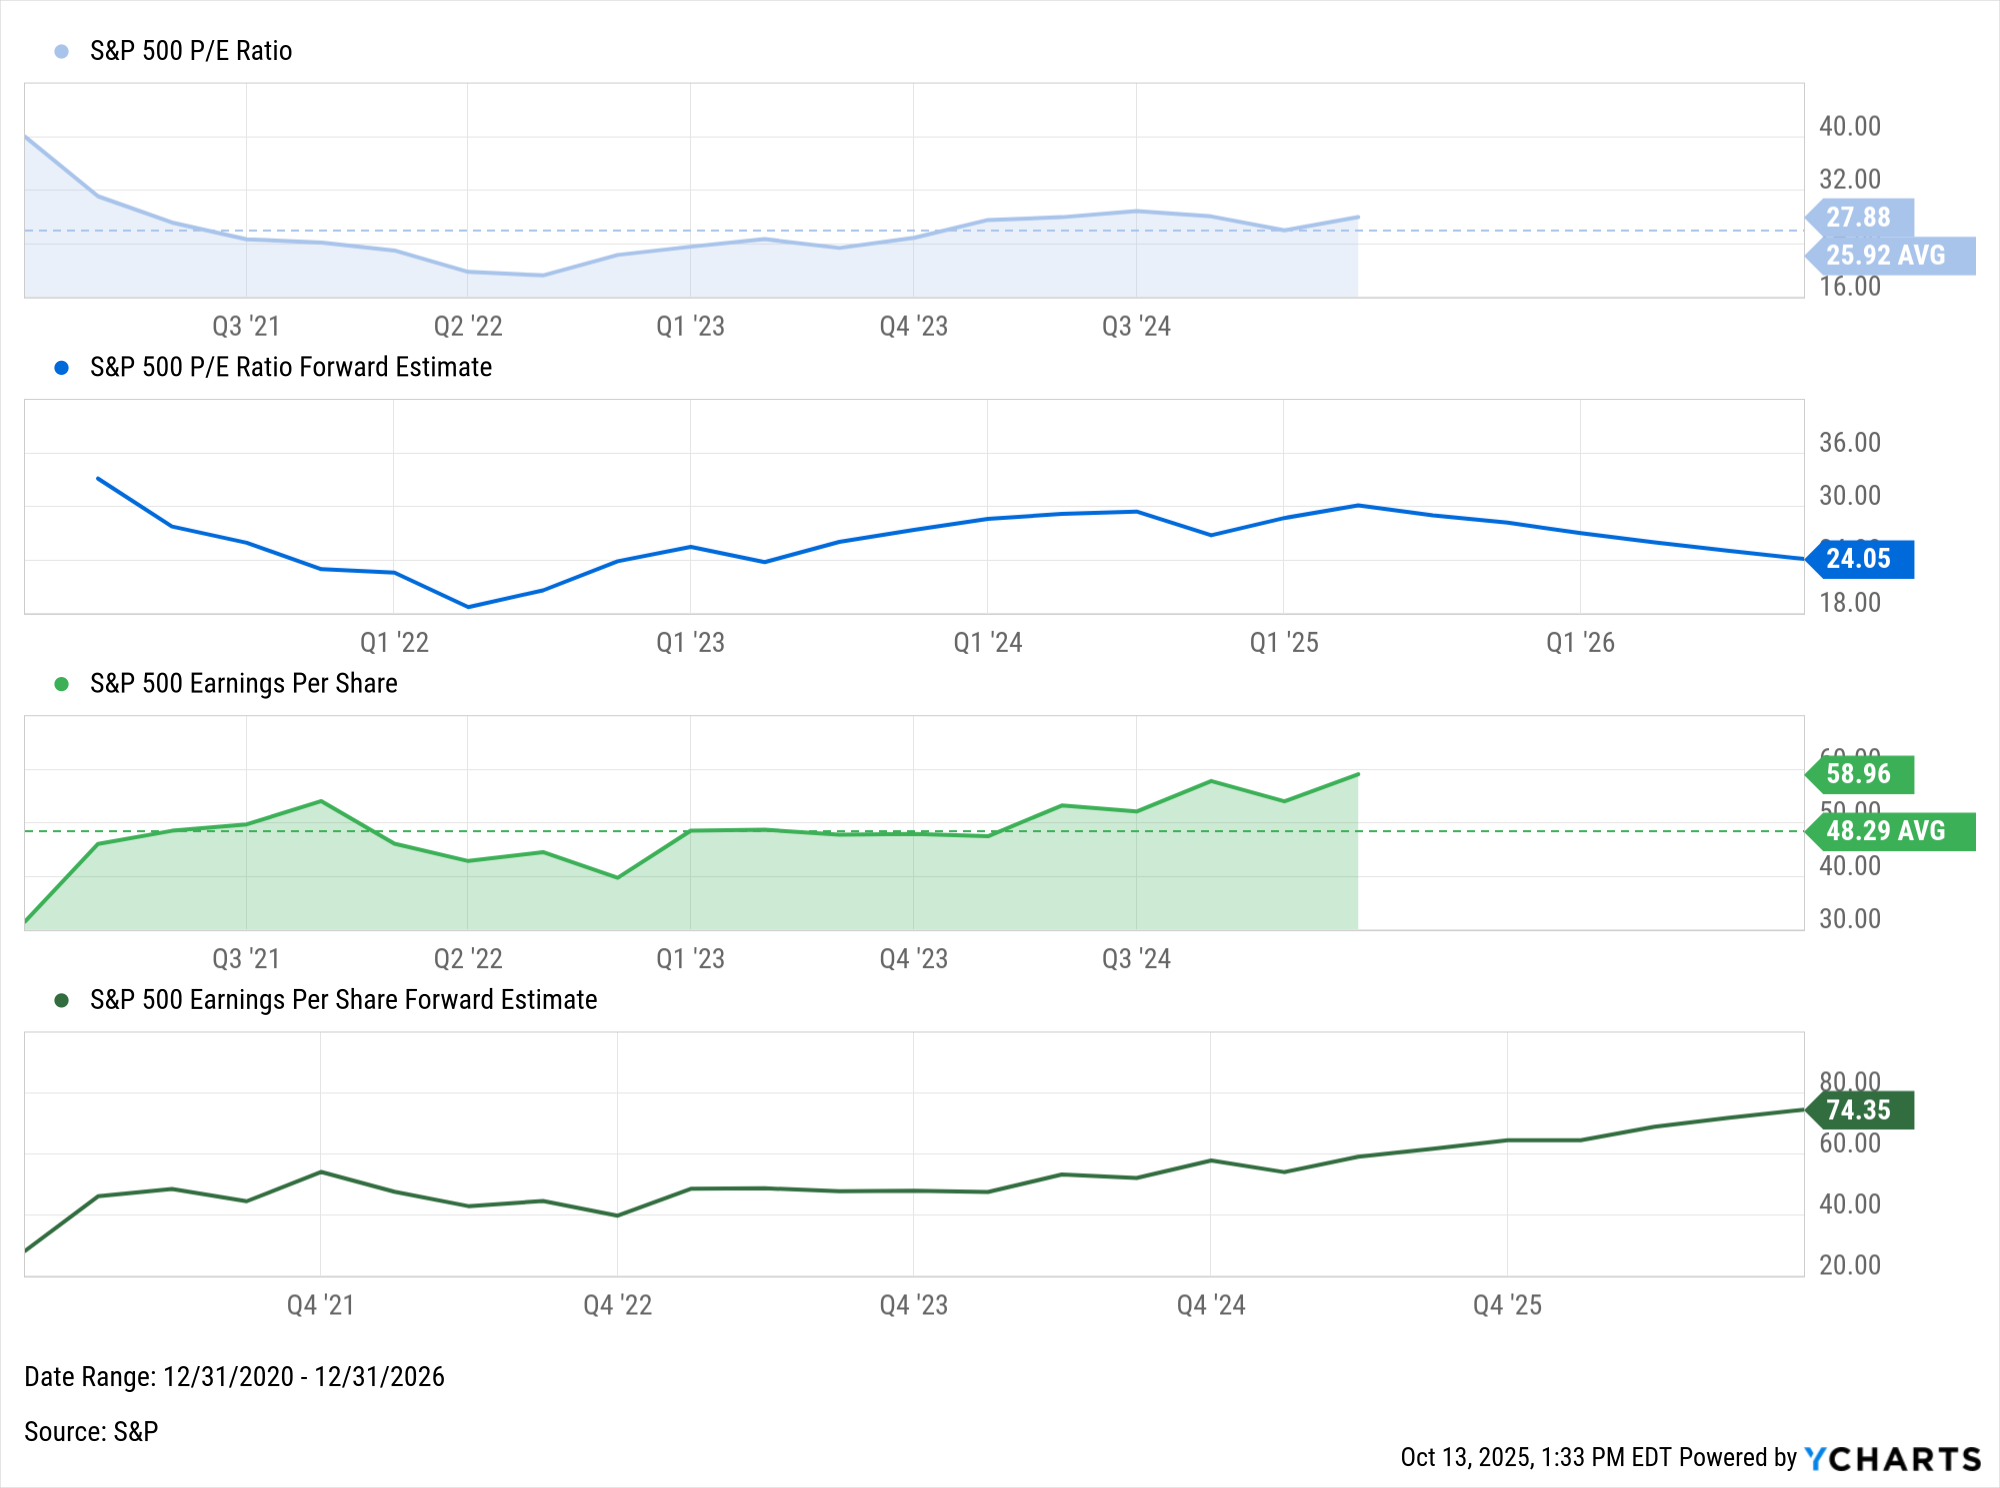
Explore in YCharts → Compare S&P 500 P/E ratio & earnings estimates
This trend suggests that recent gains are being supported more by improving fundamentals than by expanding multiples. Corporate earnings have proven resilient, and forward estimates point to continued growth in the quarters ahead.
The Magnificent 7 remain central to that equation. Together, they account for nearly one-third of the index’s total market cap, and their collective earnings power continues to shape overall outcomes.
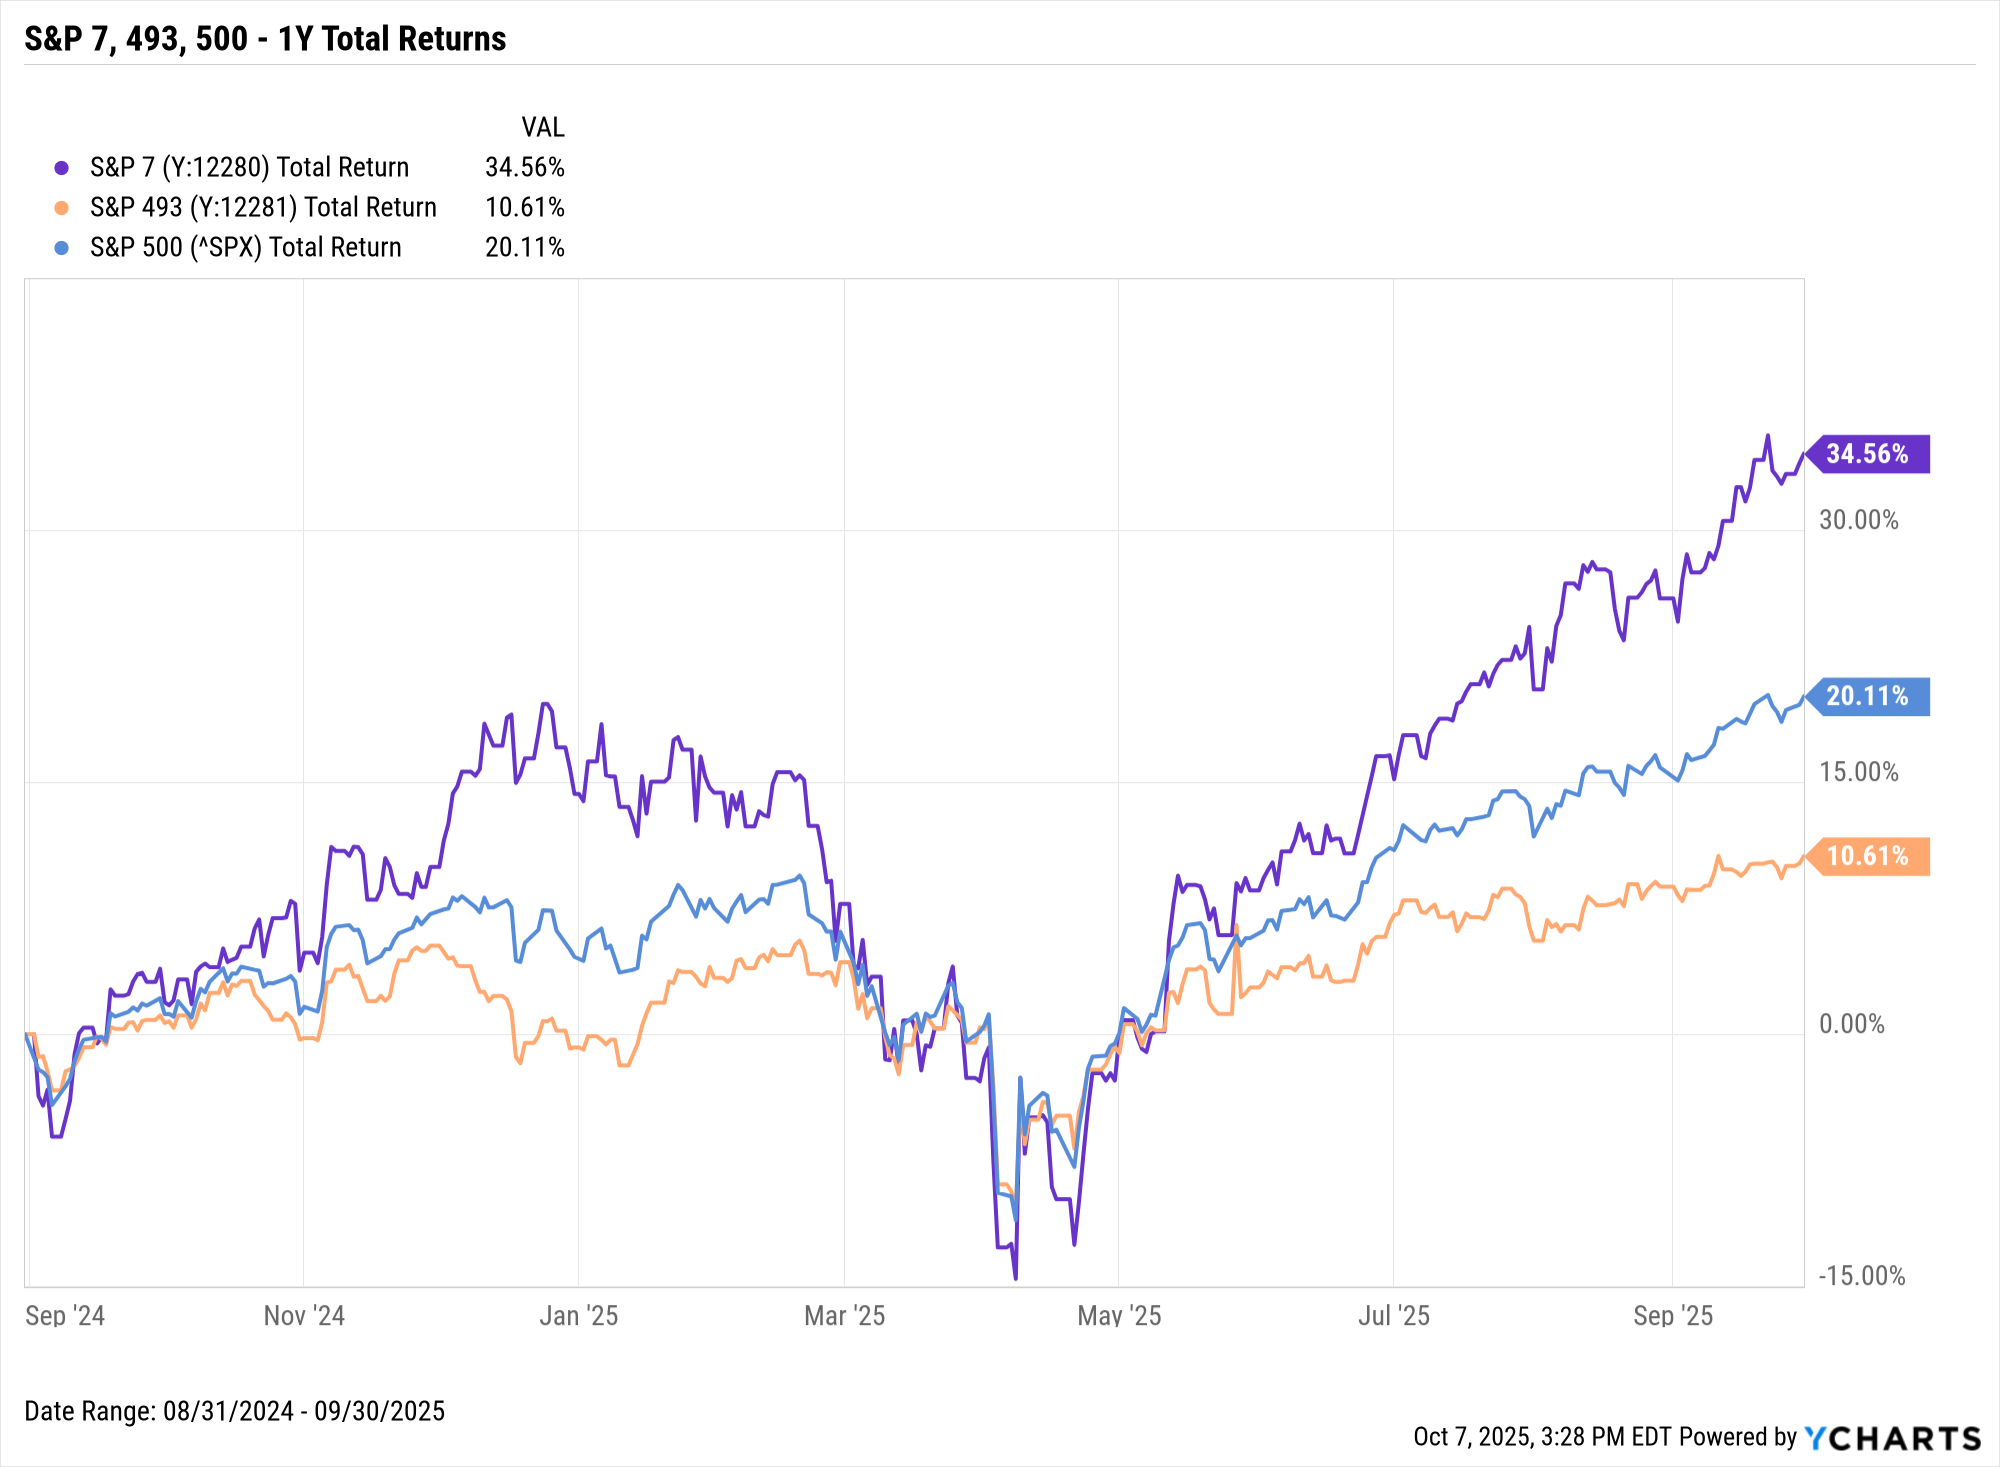
Explore in YCharts → Magnificent 7 dominates remaining 493
A Market Dependent on Delivery
Second-quarter results set a high bar for equities. It was one of the strongest reporting seasons in several years, reaffirming confidence in corporate profitability and helping sustain market momentum through the summer.
Key highlights through Q3:
- Earnings strength across sectors shows this rally is grounded in data.
- Over 80% of S&P 500 companies exceeded earnings expectations in Q2.
- 30 companies have posted year-to-date returns greater than 50%.
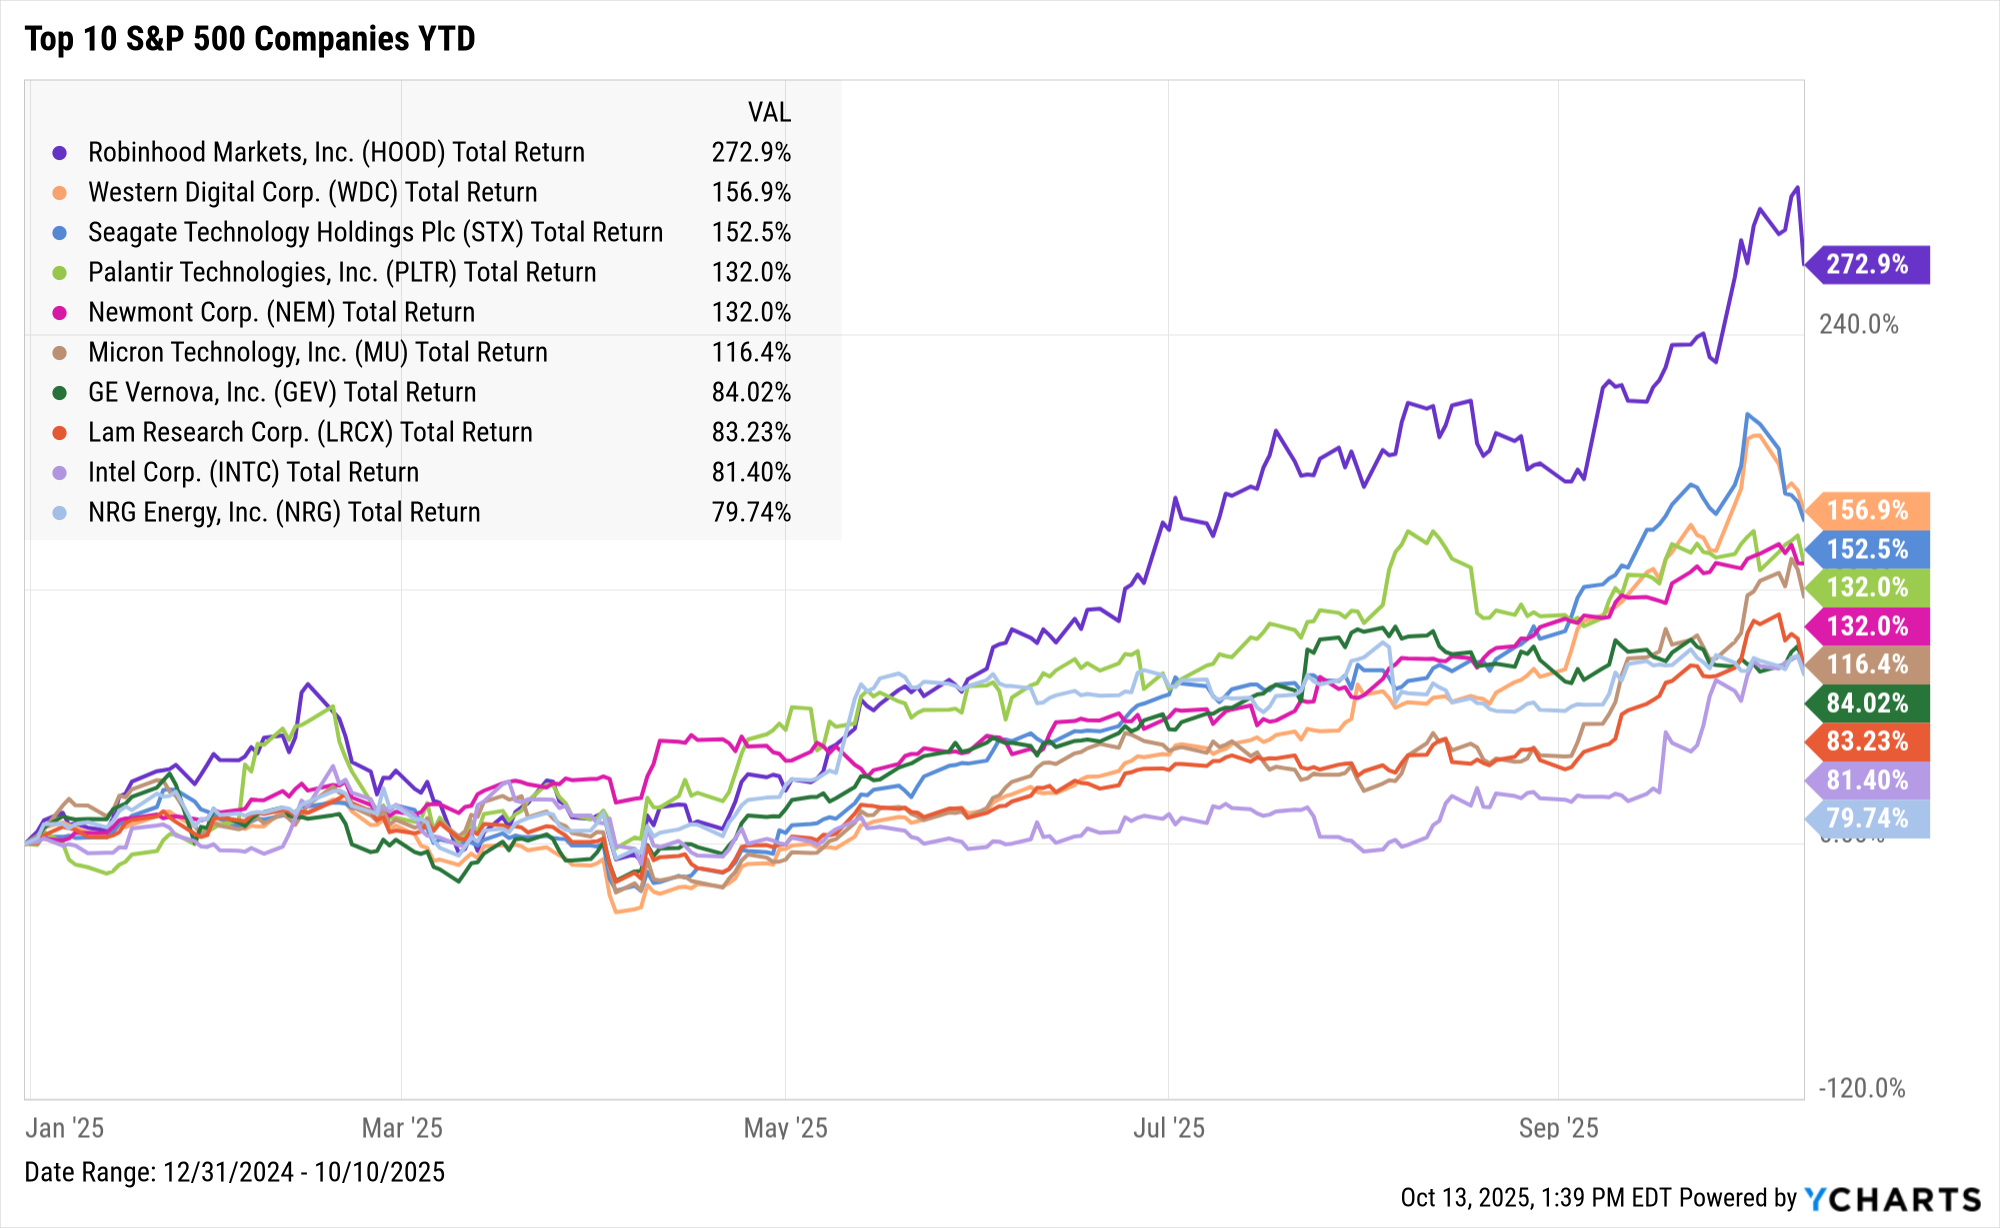
Explore in YCharts → Compare the hottest stocks of 2025
Even with that breadth, the market’s next stage could depend on continued earnings delivery. As Q3 reporting begins, investors are watching whether profit growth can continue at a pace strong enough to support current prices.
Strong results could reinforce the expansion narrative, while any softening in guidance may simply signal a move from acceleration to normalization.
Cautionary Signals Begin to Emerge
When worries of a market top begin to dominate headlines, it’s often because some indicators start to send quieter warning signs beneath the surface. The current cycle is no exception. While equity markets continue to climb, a few macro signals point to conditions that deserve closer attention.
Key cautionary signals:
- The yield curve has normalized after more than a year of inversion.
- Low volatility in the VIX reflects investor confidence but can mask complacency.
- Labor market indicators continue to soften month over month.
The first of these is the yield curve, which has shiftedd back into positive territory after more than a year of inversion. The 10-year Treasury now yields about 0.53 percent more than the two-year, signaling that short-term rates are falling as policy easing begins to take effect.
While this normalization marks progress, it also reflects lingering caution in the bond market. Investors appear to be positioning for slower growth ahead, even as equities continue to price in strength.
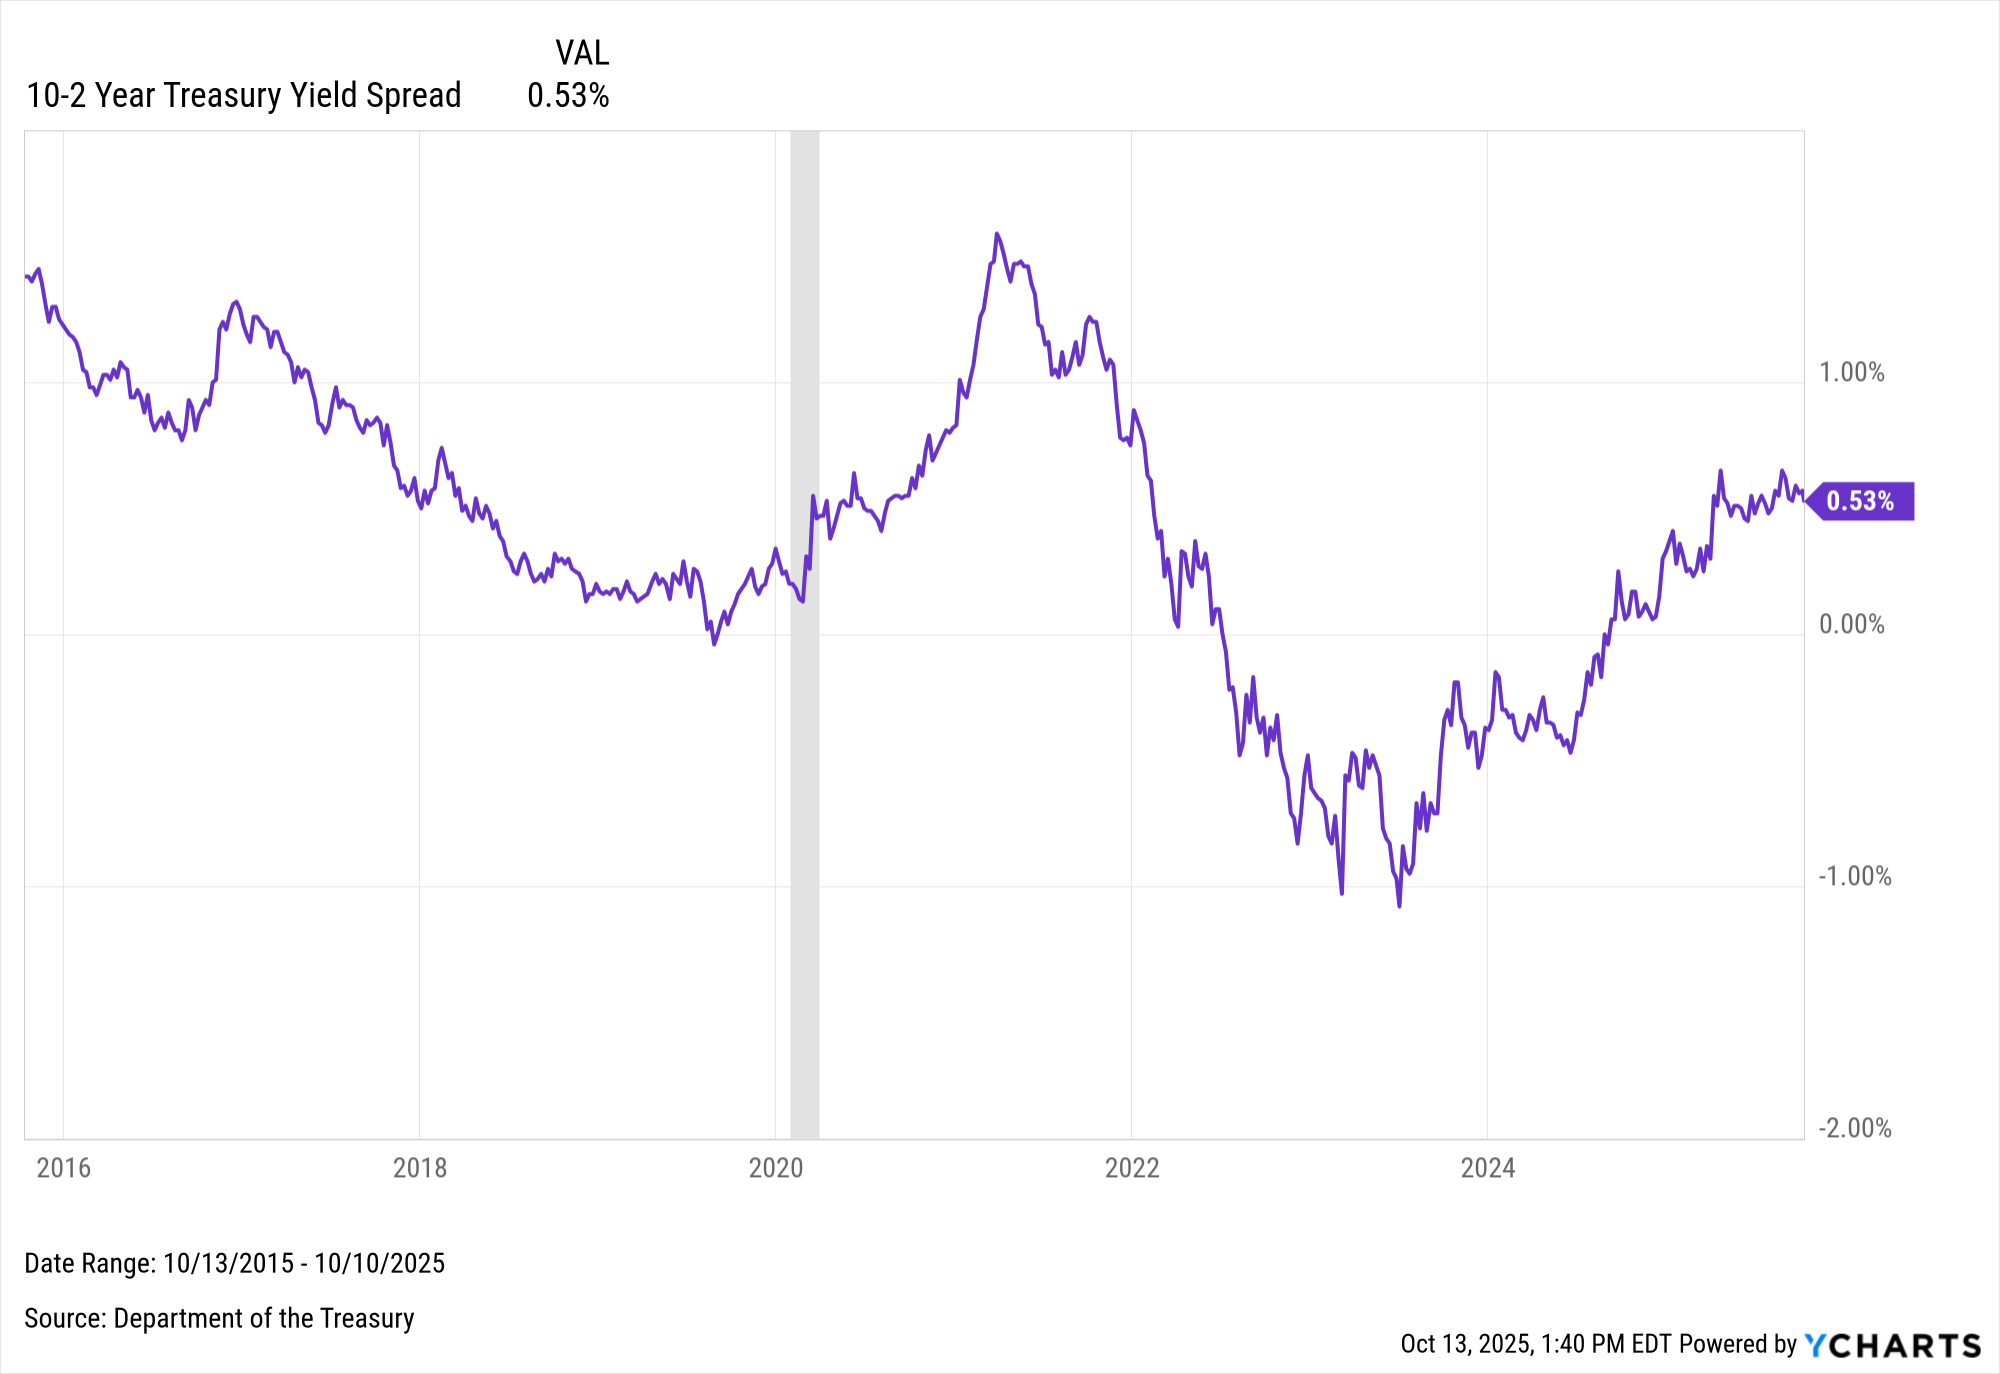
Explore in YCharts → Historical 10-2 yield spread
A second cautionary signal comes from volatility, or lack thereof. For more than three months, the VIX has hovered near 16, well below its long-term average of 20. On the surface, this calm reflected confidence in the market’s direction and the Fed’s ability to manage a soft landing.
Low volatility can also mean complacency. When investors grow comfortable, unexpected data shifts or earnings surprises can trigger sharper reactions than fundamentals alone would justify.
The calm broke on Friday, when the VIX increased by 25 percent amid renewed trade tensions which erased nearly $2 trillion from the market, underscoring how quickly sentiment can change.
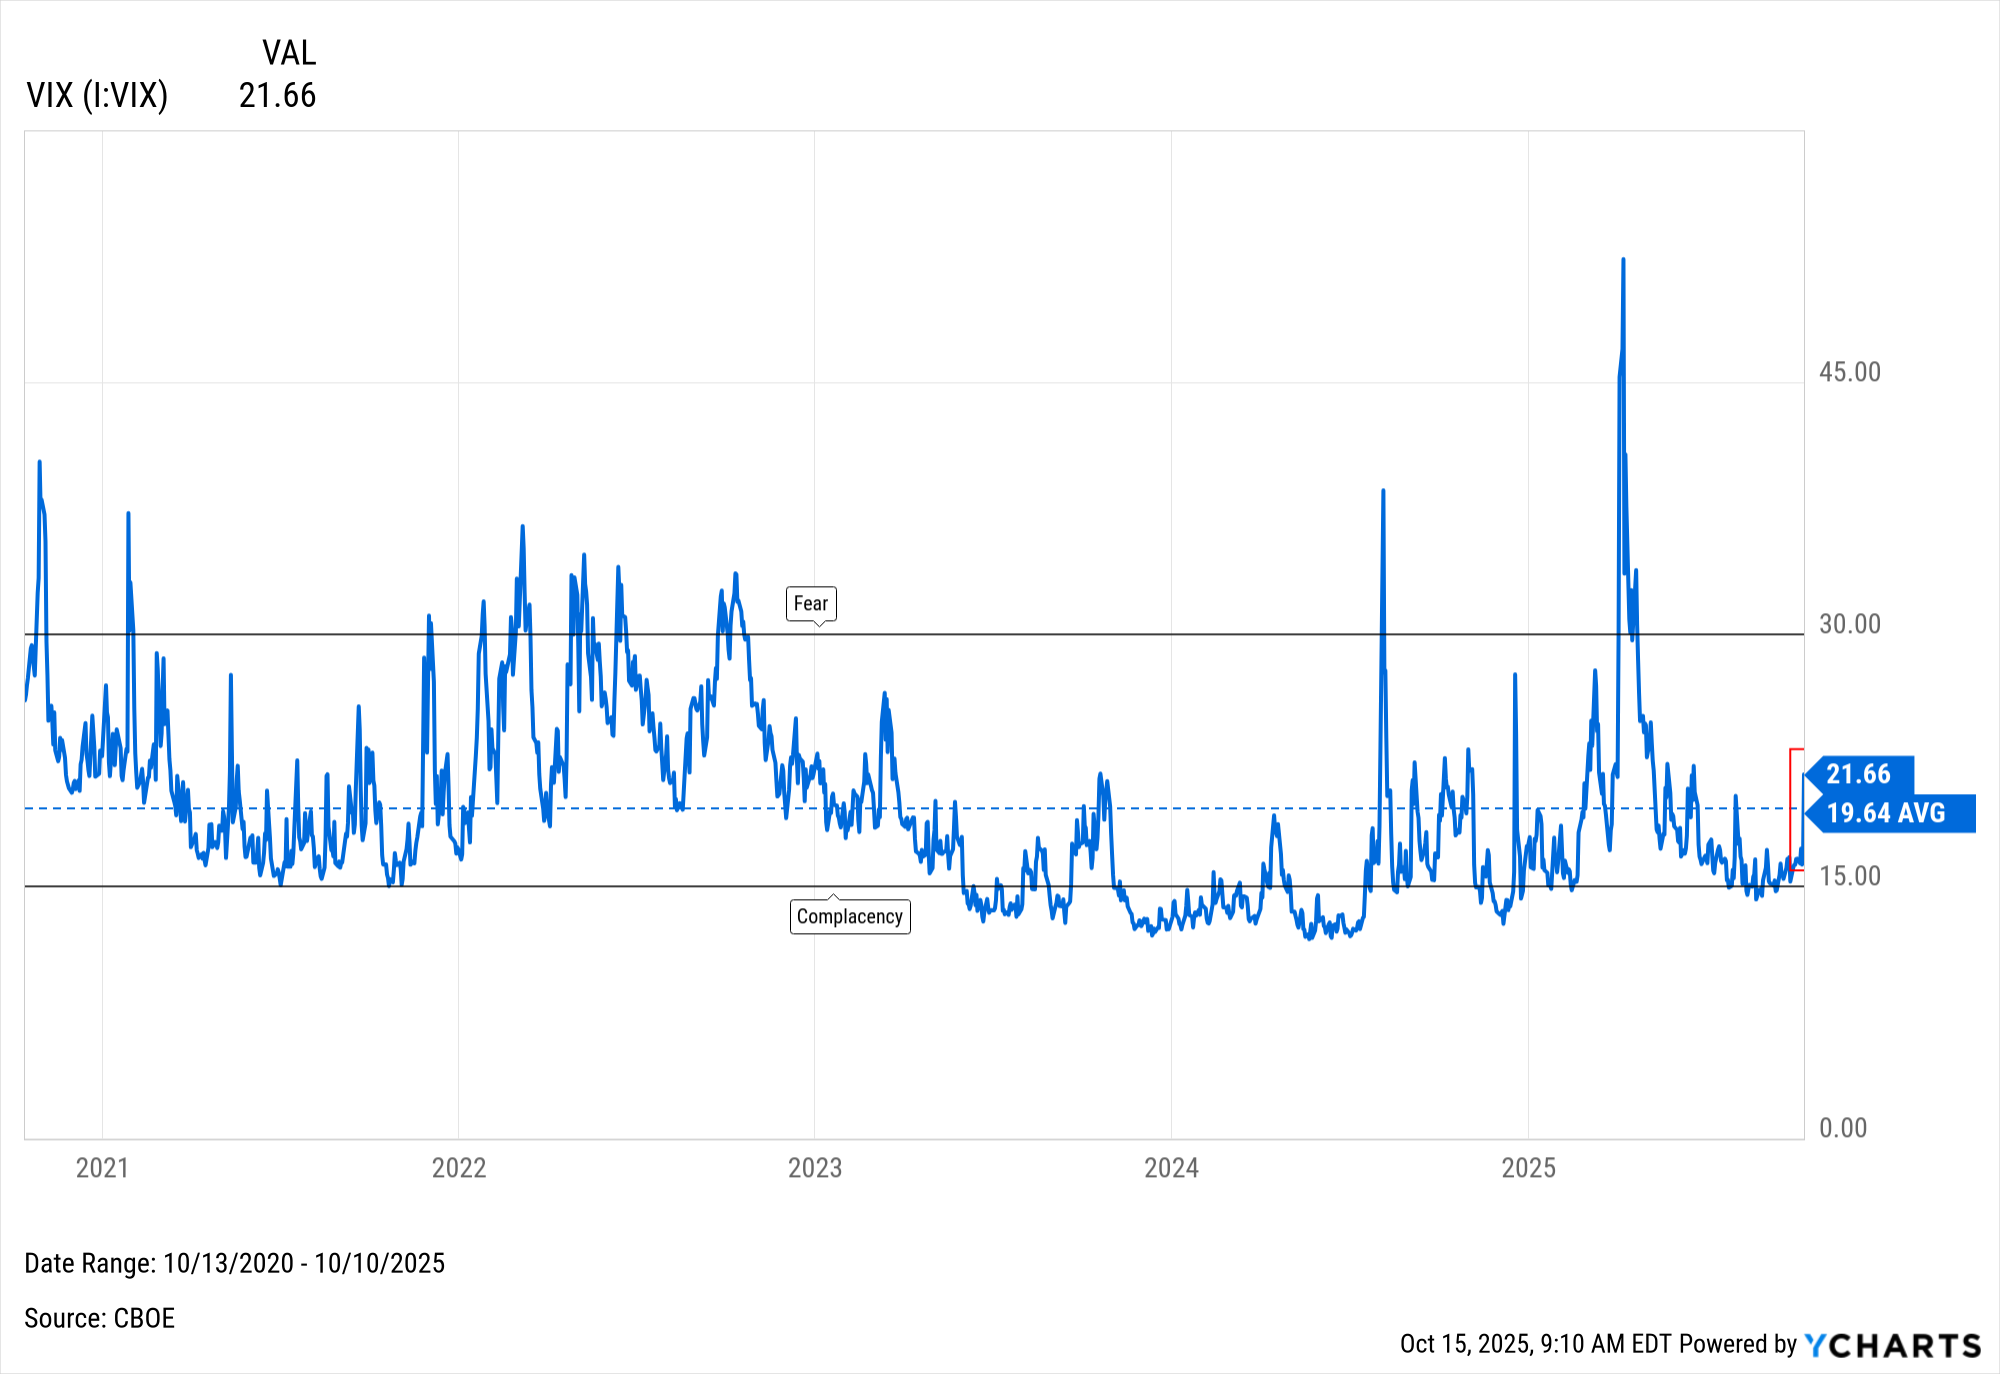
Explore in YCharts → Volatility indicating complacency or fear?
This sharp move captures the current market dynamic: genuine strength built on a fragile balance. Fixed income markets continue to signal moderation, while equities remain priced for near perfection.
Beneath this broad market succes, the labor market has shown continued signs of strain, with job growth slowing and claims edging higher. Consumer sentiment remains steady but cautious, showing how macro confidence can coexist with uncertainty.
Finding Balance in a Complex Market
Economic resilience, earnings strength, and policy support all remain in play, yet so do the undercurrents of caution that define these environments. Periods like this often test investor conviction, but the most valuable perspective is one that helps clients understand all of it, in context.
Key reminders for client conversations:
- Staying Invested. Time in the market is more powerful than timing the market. As shown in YCharts’ Top 10 Visuals deck, missing even a handful of the best market days would have drastically reduced long-term returns. This is a staggering consideration in a year where the S&P 500 has already reached 32 new all-time highs.
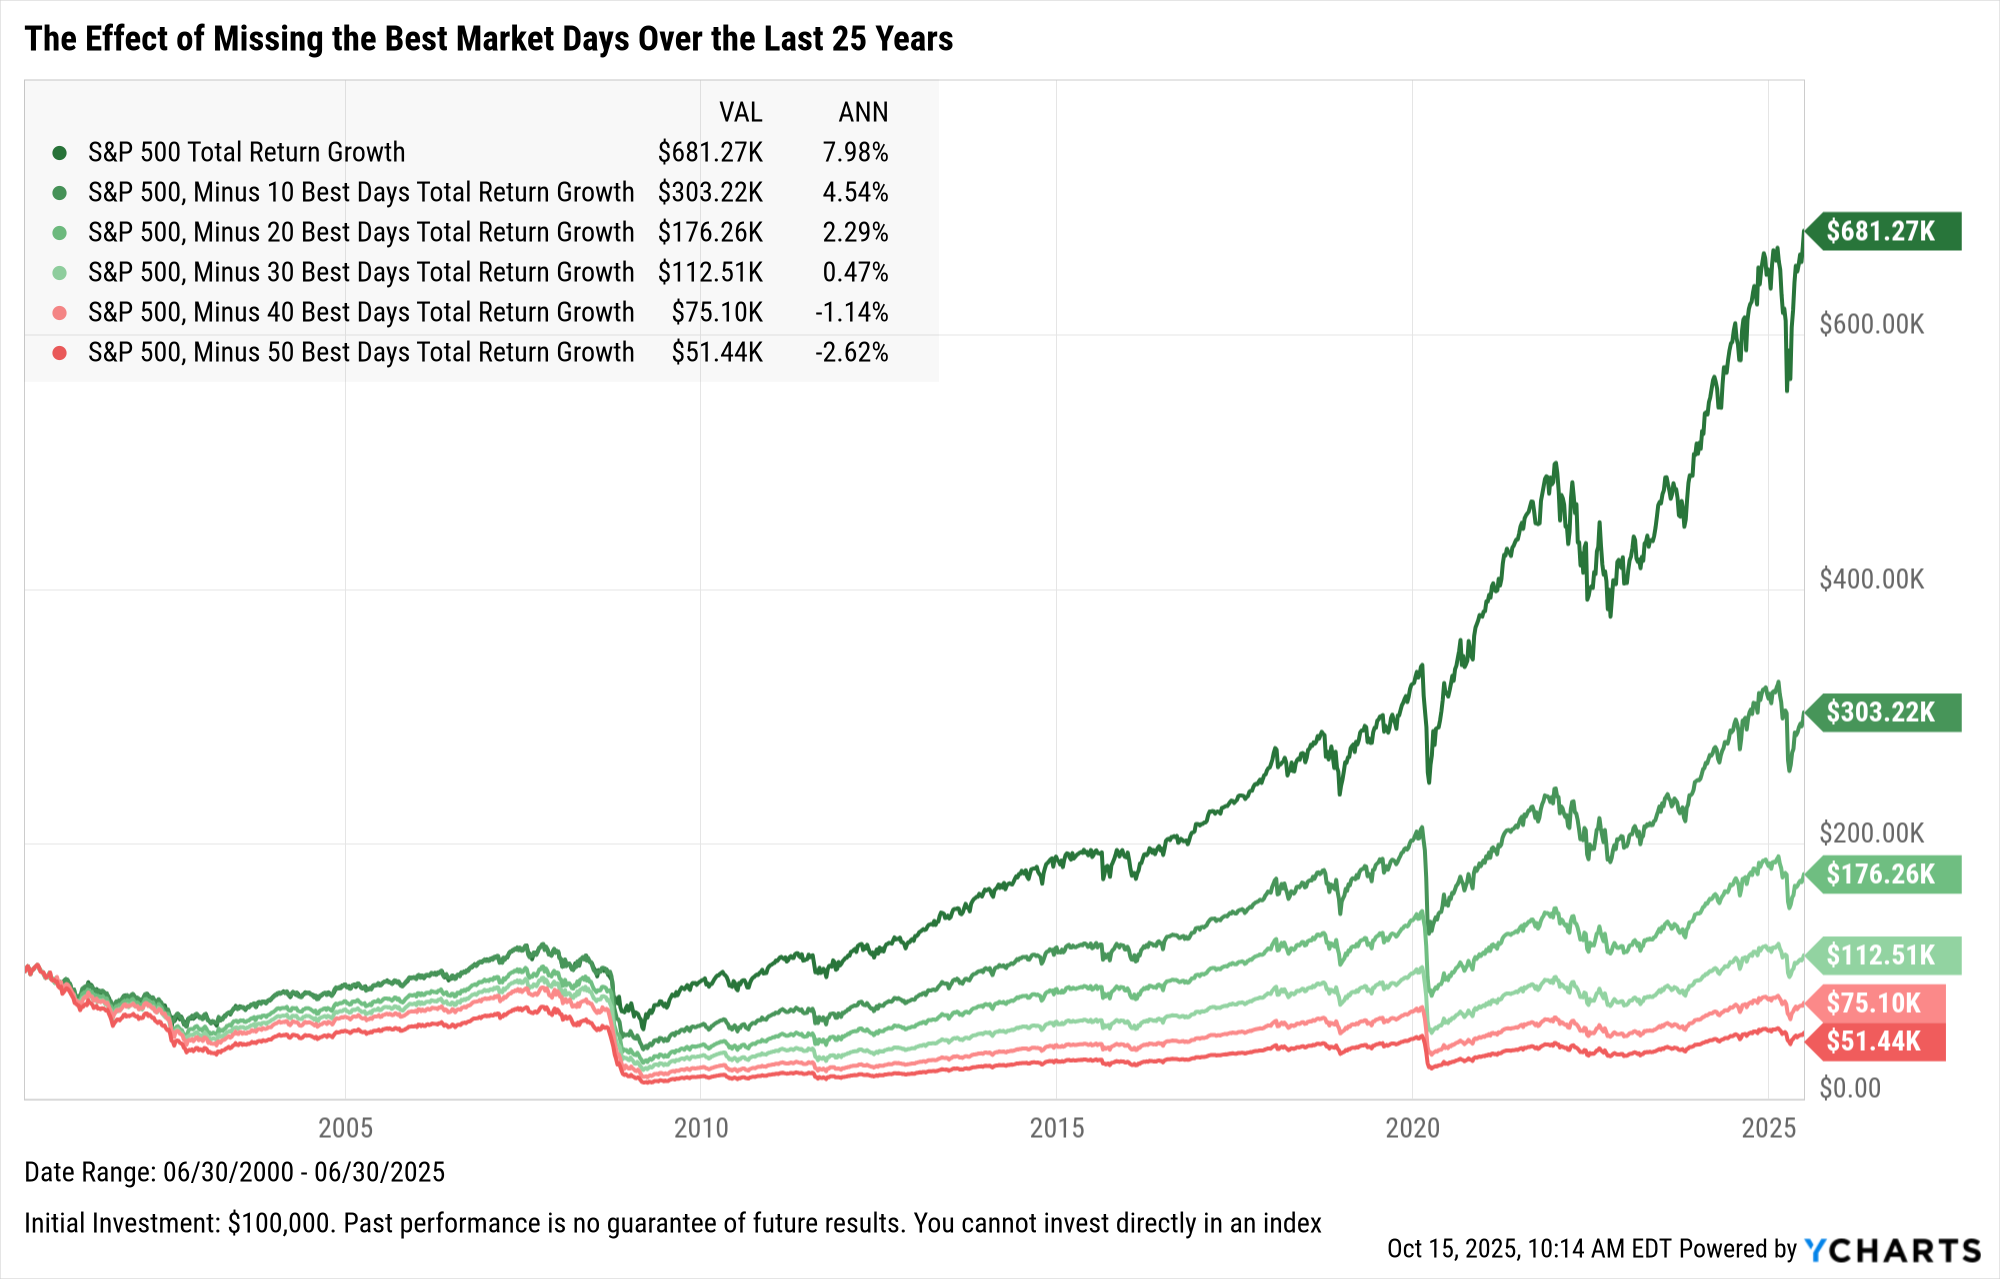
Explore in YCharts → The dangers of sitting on the sidelines
- Reframe Fear. There is more than one way to navigate uncertainty amid high levels of growth. Rather than stepping aside and waiting for clarity, these periods present opportunities to rebalance portfolios and reconnect with clients around long-term goals.
- Trust the Data. There has always been a reason to sell, yet history shows that markets recover from even the most difficult periods. Today’s valuations are elevated within reason, reminding us that growth often leads to further growth.
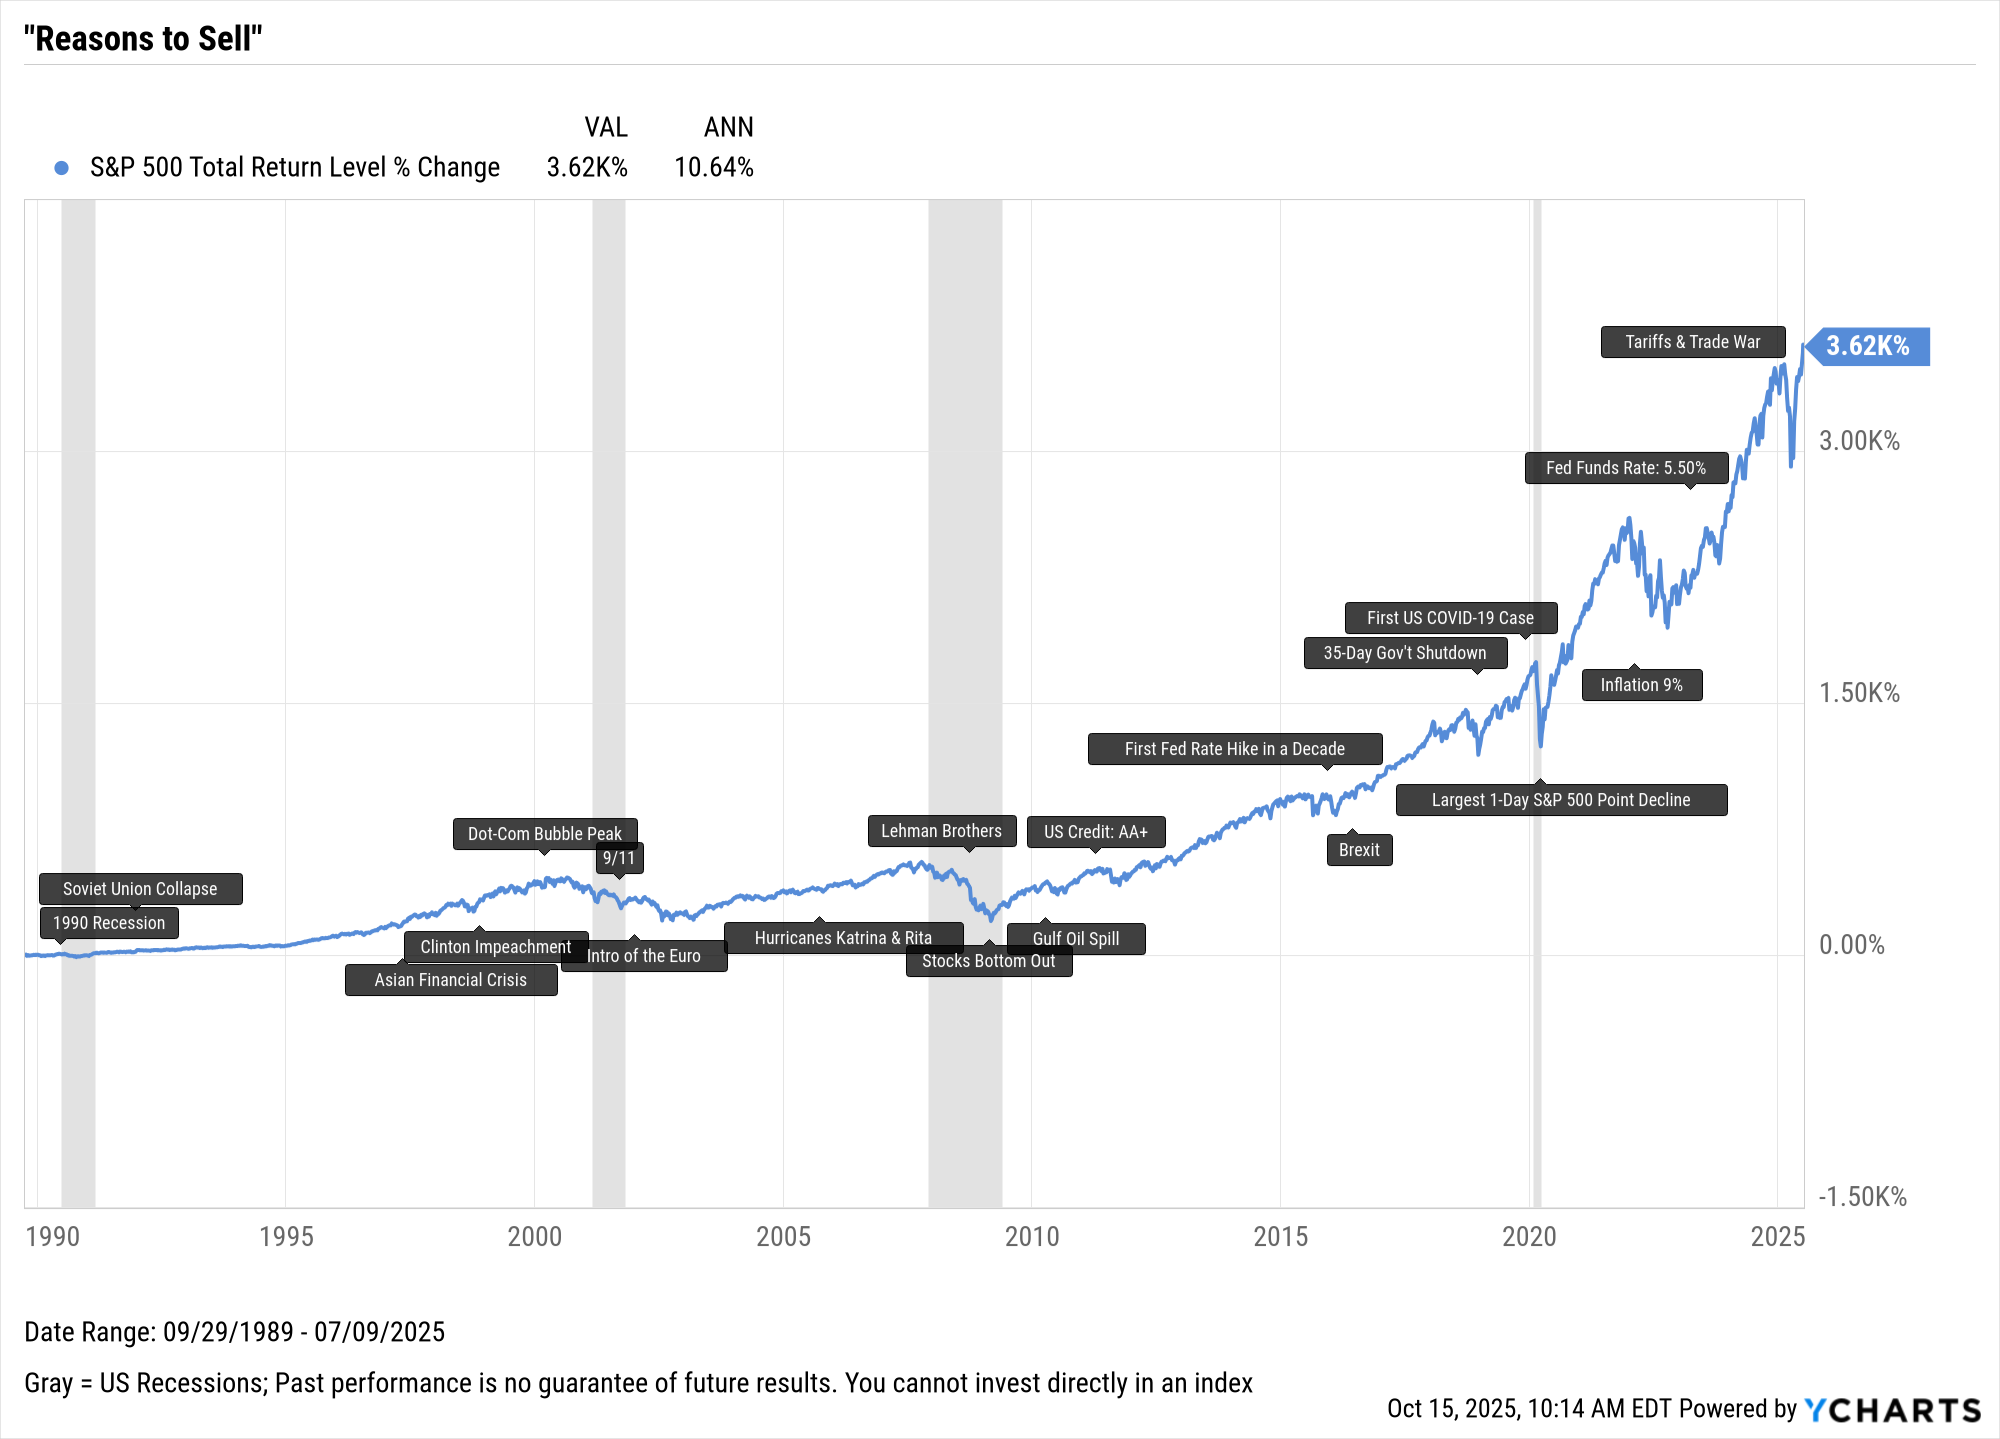
Explore in YCharts → Did you sell these events?
There is no denying that some legitimate warnings have crept into markets, but fear often grows louder than the data. It is important to acknowledge areas of uncertainty, but these indicators warrant attention rather than alarm.
The ability to reframe fear and guide clients with clarity during uncertain moments is what builds lasting trust. YCharts helps advisors interpret market trends with confidence, turning complex data into conversations that strengthen relationships and understanding.
Build these visuals in your own client reports → start a free trial today.
Ready to Move On From Your Investment Research and Analytics Platform?
Follow YCharts Social Media to Unlock More Content!
Disclaimer
©2025 YCharts, Inc. All Rights Reserved. YCharts, Inc. (“YCharts”) is not registered with the U.S. Securities and Exchange Commission (or with the securities regulatory authority or body of any state or any other jurisdiction) as an investment adviser, broker-dealer or in any other capacity, and does not purport to provide investment advice or make investment recommendations. This report has been generated through application of the analytical tools and data provided through ycharts.com and is intended solely to assist you or your investment or other adviser(s) in conducting investment research. You should not construe this report as an offer to buy or sell, as a solicitation of an offer to buy or sell, or as a recommendation to buy, sell, hold or trade, any security or other financial instrument. For further information regarding your use of this report, please go to: ycharts.com/about/disclosure.
Next Article
The Rare Earth Reckoning: Which US Companies Surged After China's October RestrictionsRead More →