2025 Capital Gains Watchlist: The Biggest Estimated Distributions by Peer Group
Capital gains season is officially underway. December often brings one of the toughest client-facing challenges of the year: helping investors understand, and when possible, mitigate surprise distributions.
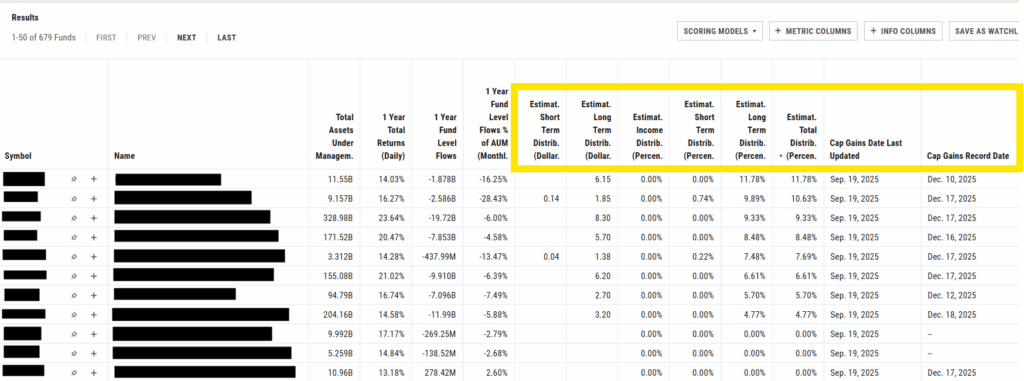
This is where CapGainsValet becomes invaluable inside YCharts. CapGainsValet aggregates capital gains estimates across thousands of mutual funds, normalizes them as a percentage of NAV, and surfaces the most tax-sensitive holdings in seconds. You can quickly screen for high-distribution funds, identify which clients hold them, and prepare tax-efficient alternatives or year-end talking points before distributions hit accounts.
Add Cap Gains Valet to your YCharts account to streamline tax-planning conversations and eliminate last-minute surprises.Using YCharts Fund Screener and Comp Tables, we analyzed thousands of mutual funds to identify the highest estimated capital gains distributions heading into year-end. Our goal is to provide you with a clear snapshot of the funds with the largest potential tax impact, organized by peer group and distribution percentile.
These rankings break down capital gains exposure in two layers:
- Funds in the first percentile (the biggest estimated distributions as a % of NAV)
- High-level peer-group statistics, including the largest payer and the median
Because these tables were built entirely through YCharts tools, you can recreate and customize each list based on your firm’s needs, including filters such as 1-year outflows, trailing performance, or minimum AUM thresholds.
View a Sample CapGainsValet Screen
Note: Some funds appear multiple times across tables due to NAV differences among share classes. Varying inception dates can create discrepancies in distribution percentages.
Table of Contents
Funds in the First Percentile of Total Distributions
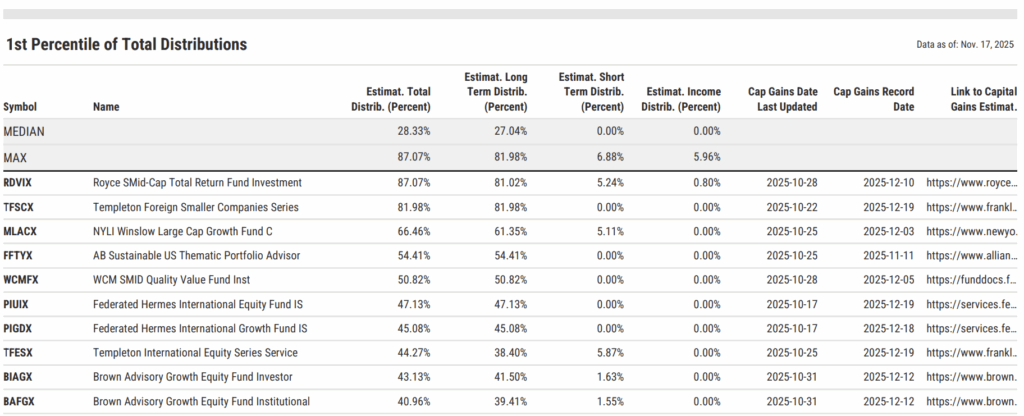
To start, here’s a look at the funds in the top 1% (92 funds) of estimated capital gains distributions, those with the largest projected tax impact relative to their NAV.
- Biggest: Royce SMid-Cap Total Return Fund Investment (RDVIX) – 87.07%
- Median: 28.33%
View the full list in Fund Screener
Large-Cap Mutual Funds Capital Gains
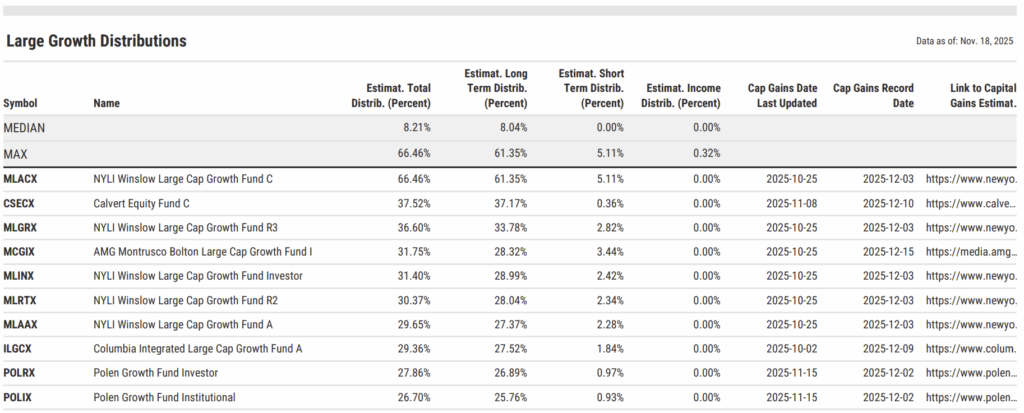
Large Growth
- Biggest: NYLI Winslow Large Cap Growth Fund C (MLACX) – 66.46%
- Median: 8.21%
View the full list in a Comp Table
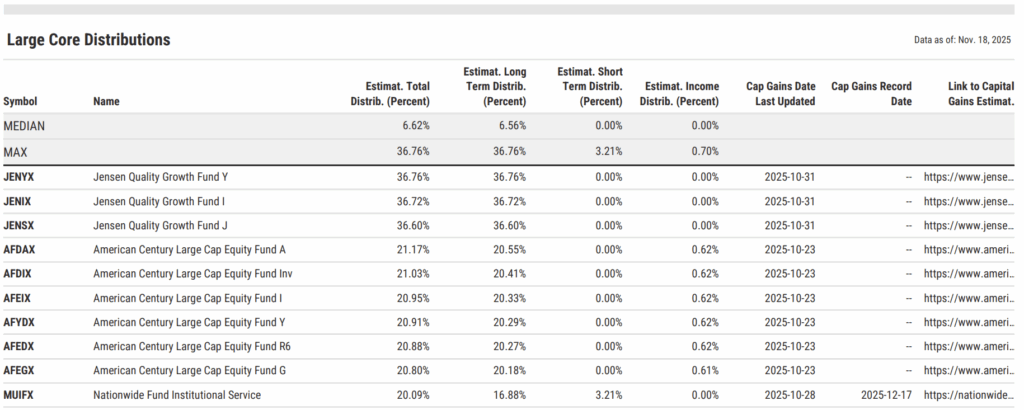
Large Core
- Biggest: Jensen Quality Growth Fund Y (JENYX) – 36.76%
- Median: 6.62%
View the full list in a Comp Table
Large Value
- Biggest: ClearBridge Large Cap Value Fund I (SAIFX) – 12.73%
- Median: 4.82%
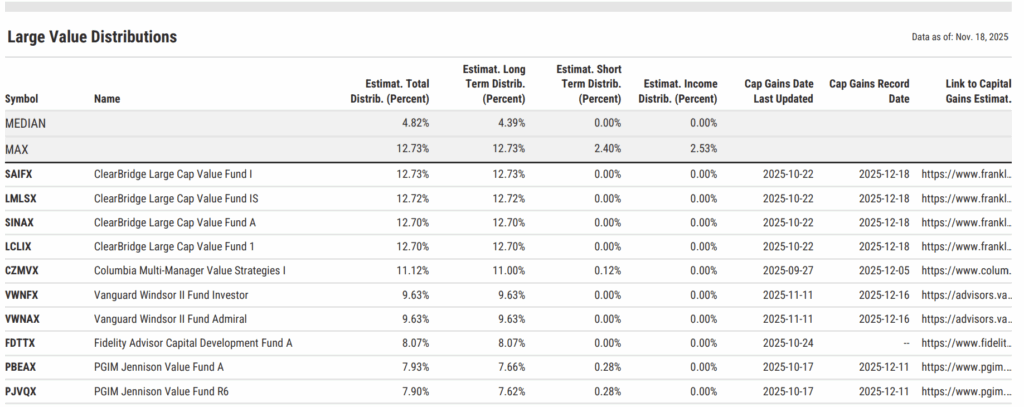
View the full list in a Comp Table
Multi-Cap Mutual Funds Capital Gains
Multi Growth
- Biggest: Brown Advisory Growth Equity Fund Investor (BIAGX) – 43.13%
- Median: 5.75%
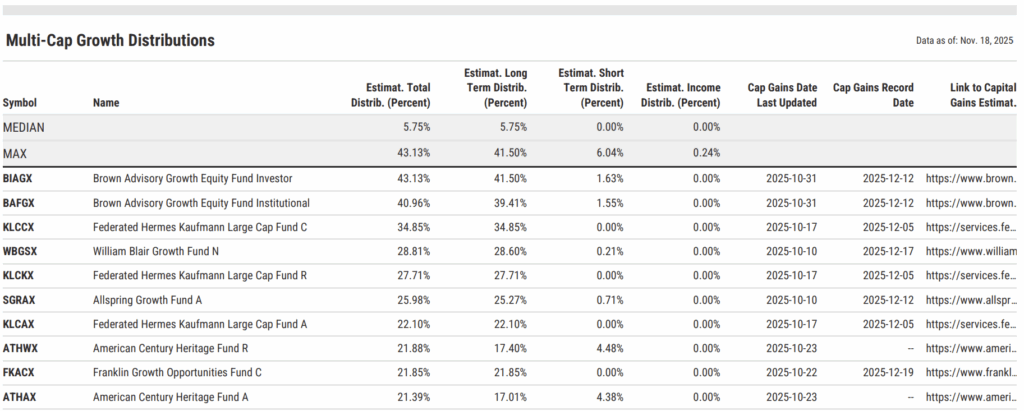
View the full list in a Comp Table
Multi Core
- Biggest: AB Sustainable US Thematic Portfolio Advisor (FFTYX) – 54.41%
- Median: 3.89%
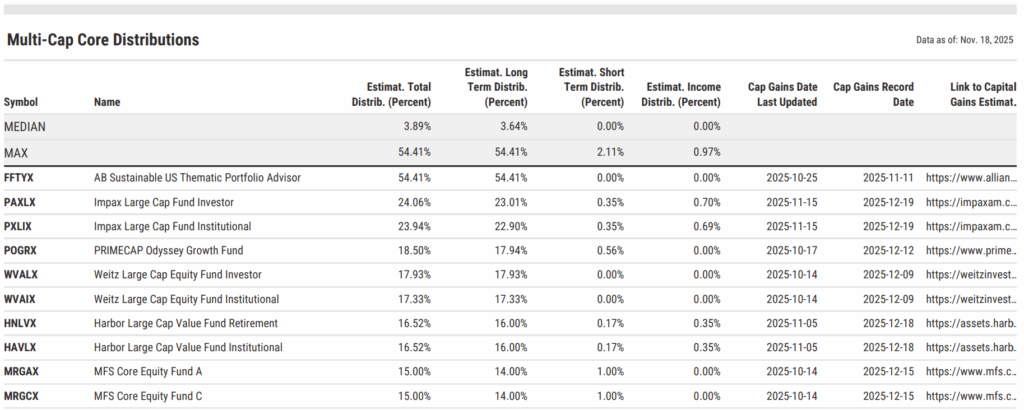
View the full list in a Comp Table
Multi Value
- Biggest: Columbia Integrated Large Cap Value Fund A (ILVBX) – 32.09%
- Median: 6.46%
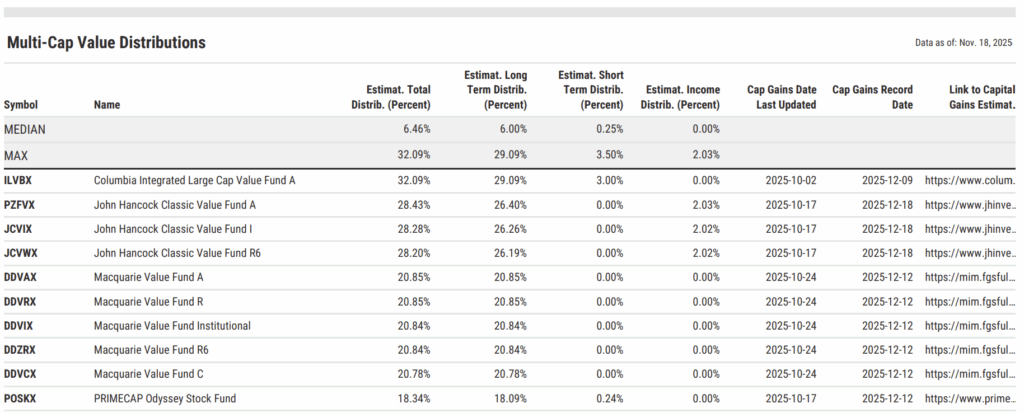
View the full list in a Comp Table
Equity Income
- Biggest: John Hancock Equity Income Fund A (JHEIX) – 35.57%
- Median: 6.41%
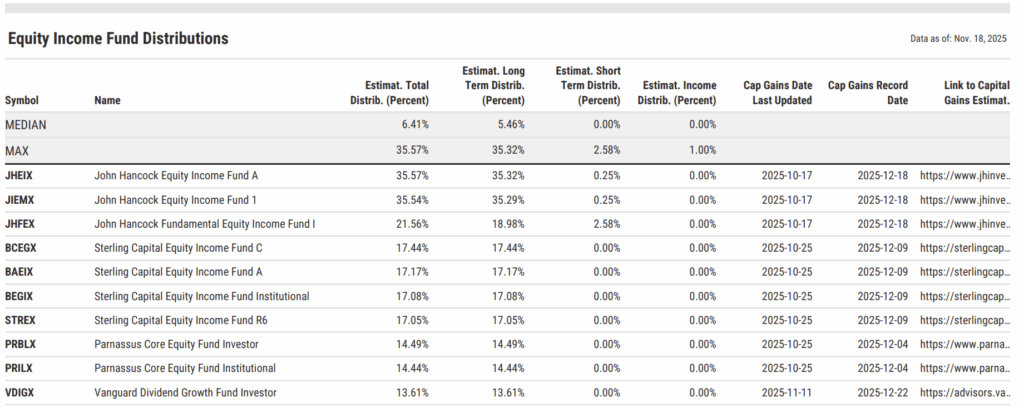
View the full list in a Comp Table
Mid-Cap Mutual Funds Capital Gains
Mid Growth
- Biggest: BNY Mellon Small/Mid Cap Growth Fund C (DBMCX) – 40.72%
- Median: 9.02%
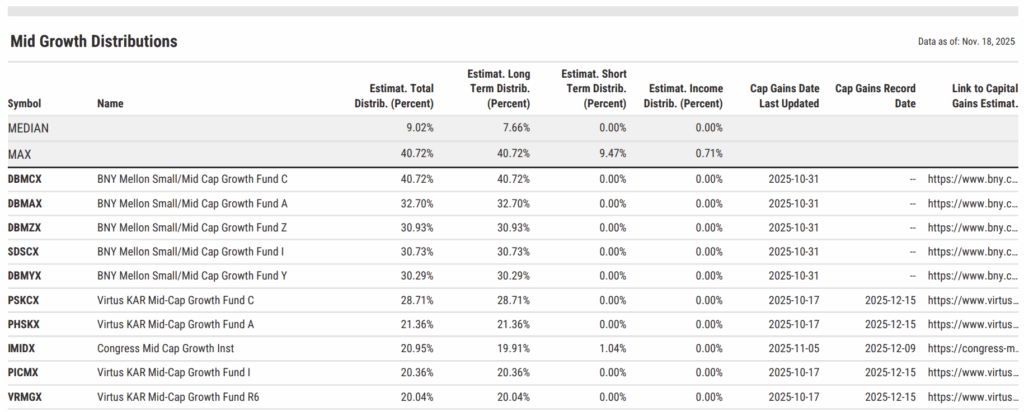
View the full list in a Comp Table
Mid Core
- Biggest: Natixis Vaughan Nelson Mid Cap Fund Y (VNVYX) – 20.89%
- Median: 5.10%
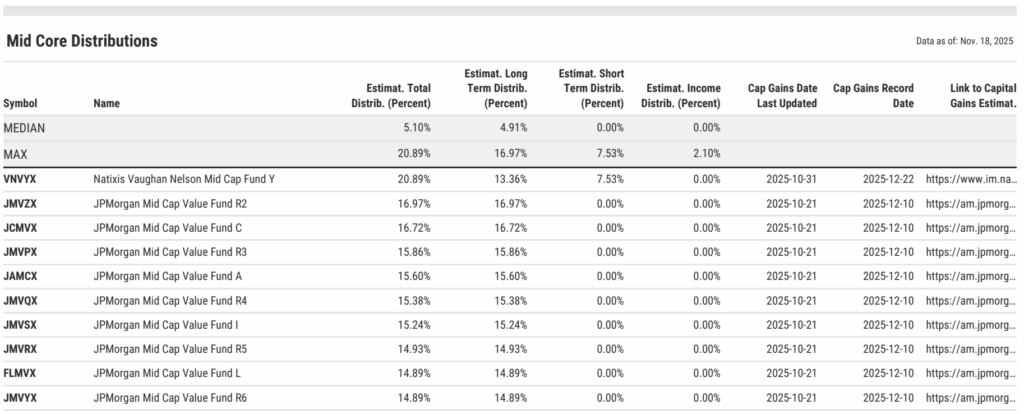
View the full list in a Comp Table
Mid Value
- Biggest: Transamerica Mid Cap Value Opportunities I (MVTIX) – 14.21%
- Median: 6.54%
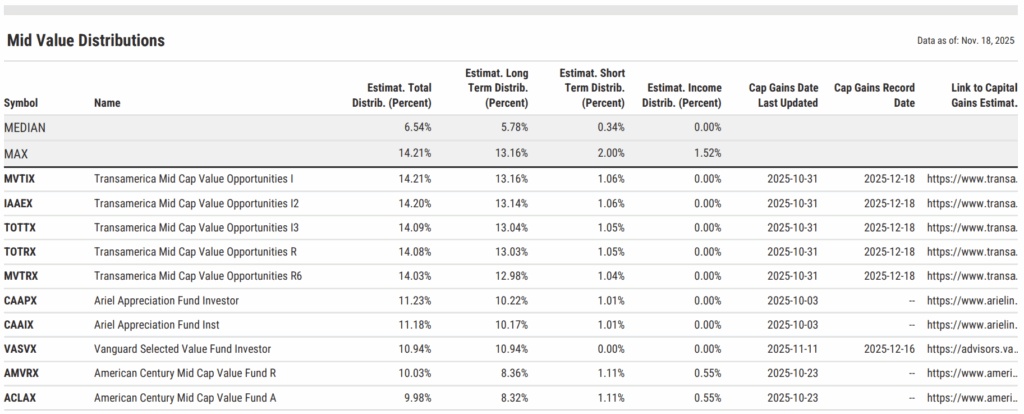
View the full list in a Comp Table
Small-Cap Mutual Funds Capital Gains
Small Growth
- Biggest: ClearBridge Small Cap Growth Fund R (LMPOX) – 28.38%
- Median: 5.16%
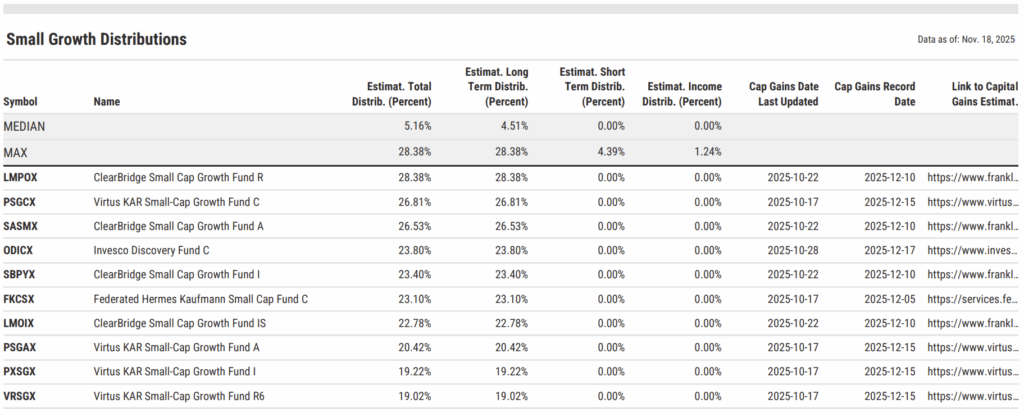
View the full list in a Comp Table
Small Core
- Biggest: Royce SMid-Cap Total Return Fund Investment (RDVIX) – 87.07%
- Median: 5.20%
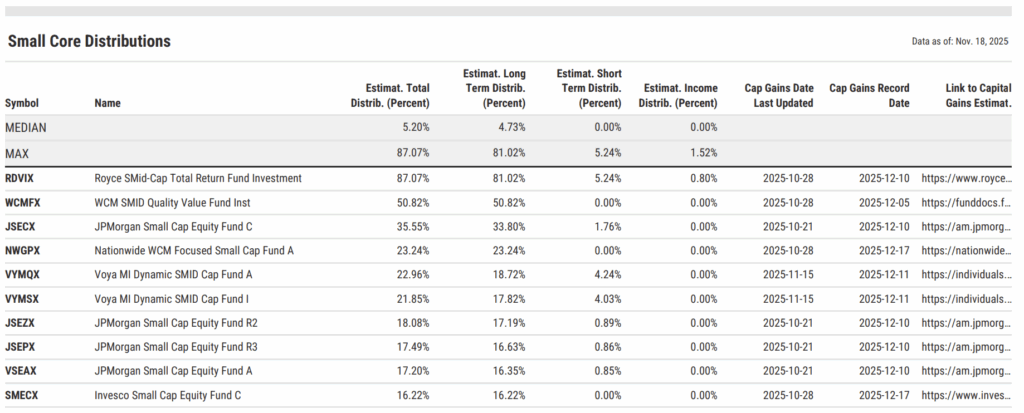
View the full list in a Comp Table
Small Value
- Biggest: Northern Small Cap Value Fund (NOSGX) – 30.41%
- Median: 4.04%
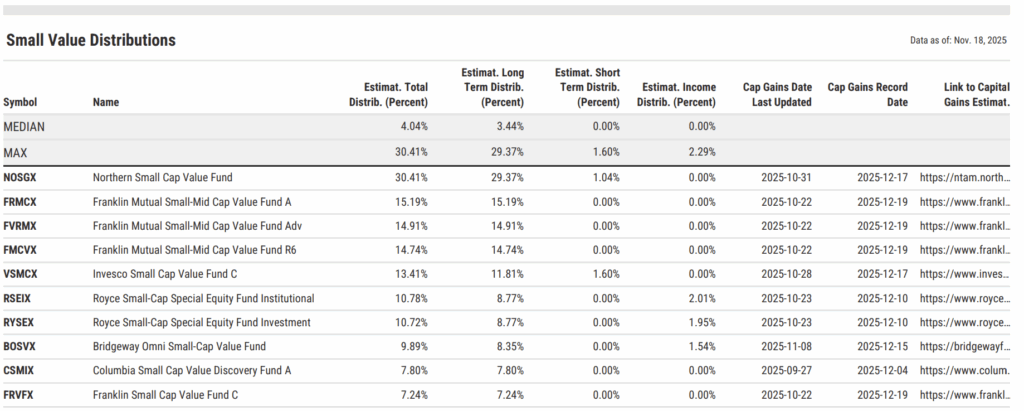
View the full list in a Comp Table
International Mutual Funds Capital Gains
International Large-Cap Core
- Biggest: Morgan Stanley Inst Intl Equity Portfolio I (MSIQX) – 29.54%
- Median: 2.23%
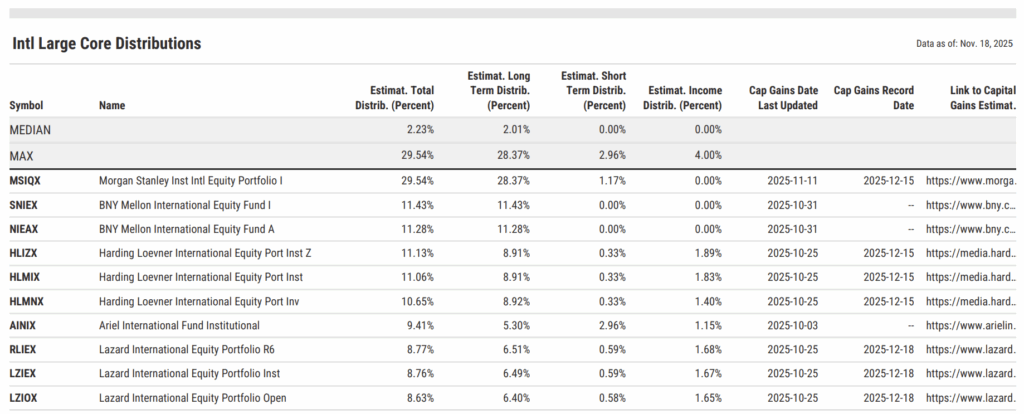
View the full list in a Comp Table
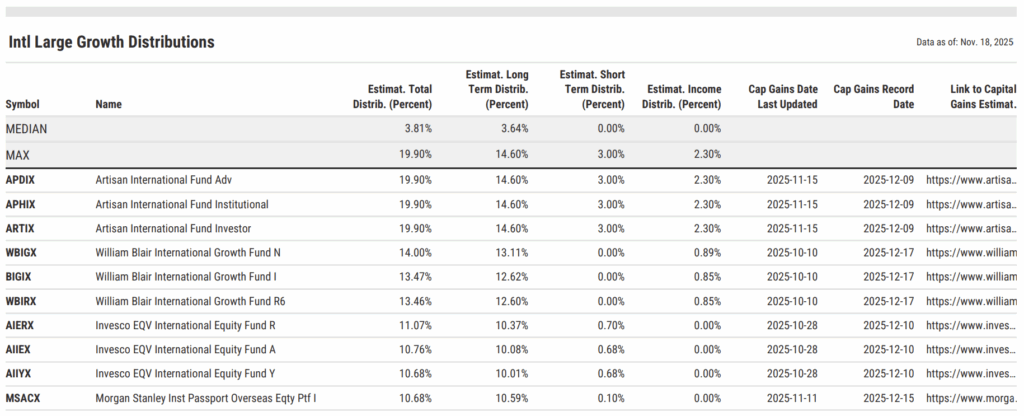
International Large-Cap Growth
- Biggest: Artisan International Fund Adv (APDIX) – 19.9%
- Median: 3.81%
View the full list in a Comp Table
Final Thoughts
Capital gains season is always a stressful period for advisors and clients alike. But with CapGainsValet in YCharts, and early visibility into potential exposures, you can reduce unwelcome surprises, proactively manage client communications, and position tax-efficient alternatives well before distributions hit accounts.
Every list above was built in minutes using YCharts Fund Screener and Comp Tables. With CapGainsValet added to your account, you can take this work a step further by analyzing exposure at the household or portfolio level, perfect for year-end planning and client meetings.
Whenever you’re ready, there are 3 ways YCharts can help you:
1. Want to test out YCharts for free?
Start a no-risk 7-Day Free Trial.
2. Get the Cap Gains Valet dataset added to your YCharts account:
Reach Out to Add CapGainsValet Metrics to Your Account3. Sign up for a copy of our Fund Flows Report: to keep tabs on flows into ETFs and Mutual Funds:
Sign up for our free monthly Fund Flow Report:Disclaimer
©2025 YCharts, Inc. All Rights Reserved. YCharts, Inc. (“YCharts”) is not registered with the U.S. Securities and Exchange Commission (or with the securities regulatory authority or body of any state or any other jurisdiction) as an investment adviser, broker-dealer or in any other capacity, and does not purport to provide investment advice or make investment recommendations. This report has been generated through application of the analytical tools and data provided through ycharts.com and is intended solely to assist you or your investment or other adviser(s) in conducting investment research. You should not construe this report as an offer to buy or sell, as a solicitation of an offer to buy or sell, or as a recommendation to buy, sell, hold or trade, any security or other financial instrument. For further information regarding your use of this report, please go to: ycharts.com/about/disclosure
Next Article
What Young Investors Don't Know About Financial AdvisorsRead More →