What Happens After A Fed Rate Cut?
After five consecutive pauses, the Fed looks ready to cut rates again.
The Federal Reserve held the Fed Funds Rate at 4.25%-4.50% throughout 2025, but CME FedWatch shows an over 90% chance of a 25 basis-point cut on September 17. It would be the first rate cut of 2025, and fourth since rates began falling from 5.50% last September. This period of 5.50% rates, dubbed “higher for longer,” spanned almost exactly 12 months.
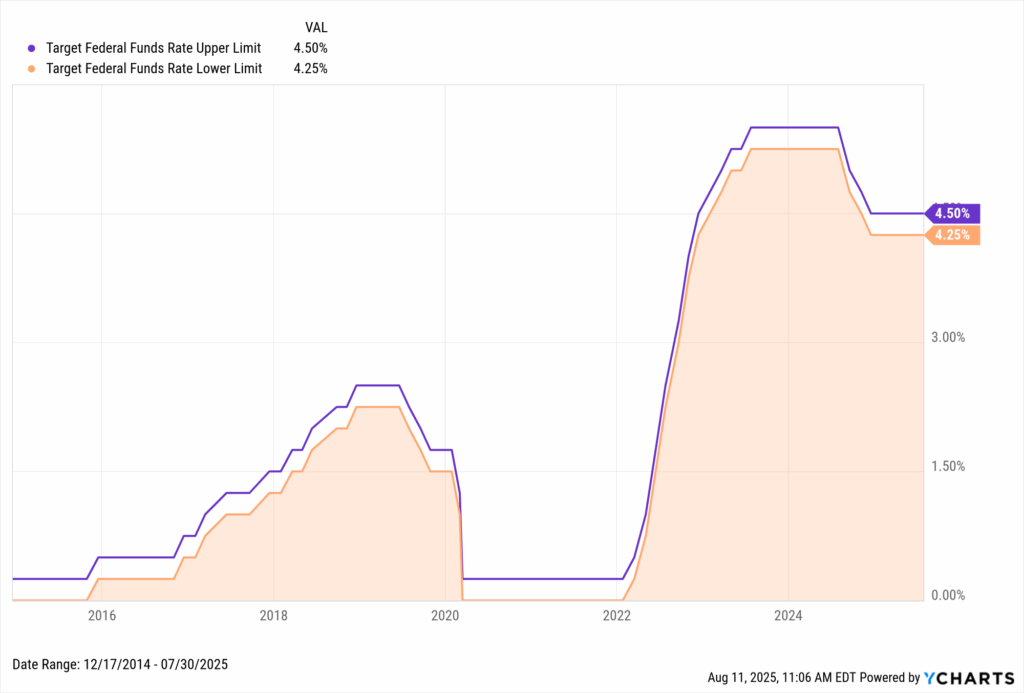
Download Visual | Modify in YCharts
On the surface, the Fed Funds Rate may seem like just one interest rate out of the many in our complex financial world. While its main purpose is to set short-term borrowing costs for banks, it also influences rates on consumer products such as, savings accounts, mortgages, and credit cards.
Effects of changes to the Fed Funds Rate also spill over into financial markets. There’s even an old investing mantra that goes, “Don’t Fight the Fed,” meaning it would be wise to align your investment choices with the actions of the Fed.
With that in mind, how powerful are the Fed’s decisions regarding monetary policy? What effects do those decisions cast, and how do financial markets and sectors of the economy react to changes in the Fed Funds Rate? What might the end of the hawkish cycle–and beginning of a dovish era–mean for investors?
What is the Federal Reserve and the Fed Funds Rate?
The Federal Reserve was created in 1913 under President Woodrow Wilson through the Federal Reserve Act. Known as “the Fed” for short, the central bank of the United States serves several purposes, ranging from promoting stability in the financial system to regulating financial institutions and their activities. One of the Fed’s primary functions is setting U.S. monetary policy to achieve its “dual mandate” set by Congress: maximum employment and long-term price stability in the United States.
Monetary policy is set by a body within the Federal Reserve called the Federal Open Market Committee (FOMC). The FOMC usually meets eight times a year to review economic and financial conditions and vote on changes to monetary policy. Policy is typically implemented through changes to the Fed Funds Rate, the benchmark rate at which financial institutions lend to each other.
If the FOMC deems that macroeconomic events warrant an increase to the Fed Funds Rate, such as inflation outpacing the Fed’s long-term target of 2%, the committee will raise the Fed Funds Rate to prevent the economy from overheating. If the economy appears to be stalling, the FOMC may attempt to spur economic growth by lowering its target rate.
Whether the FOMC votes to raise the Fed Funds Rate, lower it, or keep it unchanged, each decision produces winners and losers throughout the economy. So which assets are most impacted by changes to the Fed Funds Rate?
How Bonds Are Affected by Fed Rate Cuts
Short-term Treasury Bills and the yields they can offer are most directly affected by the Fed’s monetary policy, as stated by the Fed.
Though any fixed-income instrument is subject to the ebbs and flows of the open market, short-term treasuries have historically moved in near lockstep with the Fed Funds Rate. This relationship is strongest for T-Bills, denoted in 1-Month, 3-Month, 6-Month, and 1-Year durations.
Longer-term treasuries, like the 10-Year Note and 30-Year Bond, don’t typically follow the Fed Funds Rate as closely, though they have trended along its general direction over the last 30 years. This is because the Fed does not directly target long-term interest rates, and the maturities on these instruments are denoted years or even decades out in time.
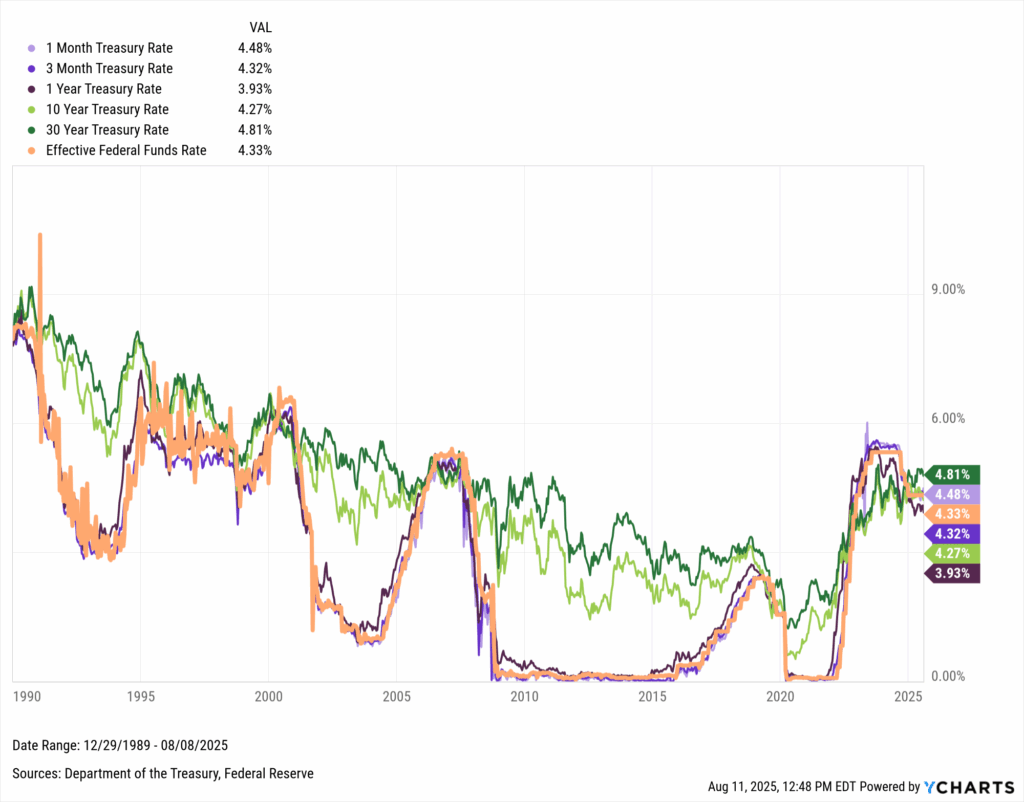
Download Visual | Modify in YCharts
Bond prices typically rise when rates fall. In a declining rate environment, new bonds come to market with lower coupons, making older issues with higher payouts more attractive and more valuable. Additional cuts could amplify this advantage, pushing existing bond prices higher as their yields outshine new, lower-rate offerings.
How Consumers Are Impacted by Fed Rate Cuts
Mortgage Rates
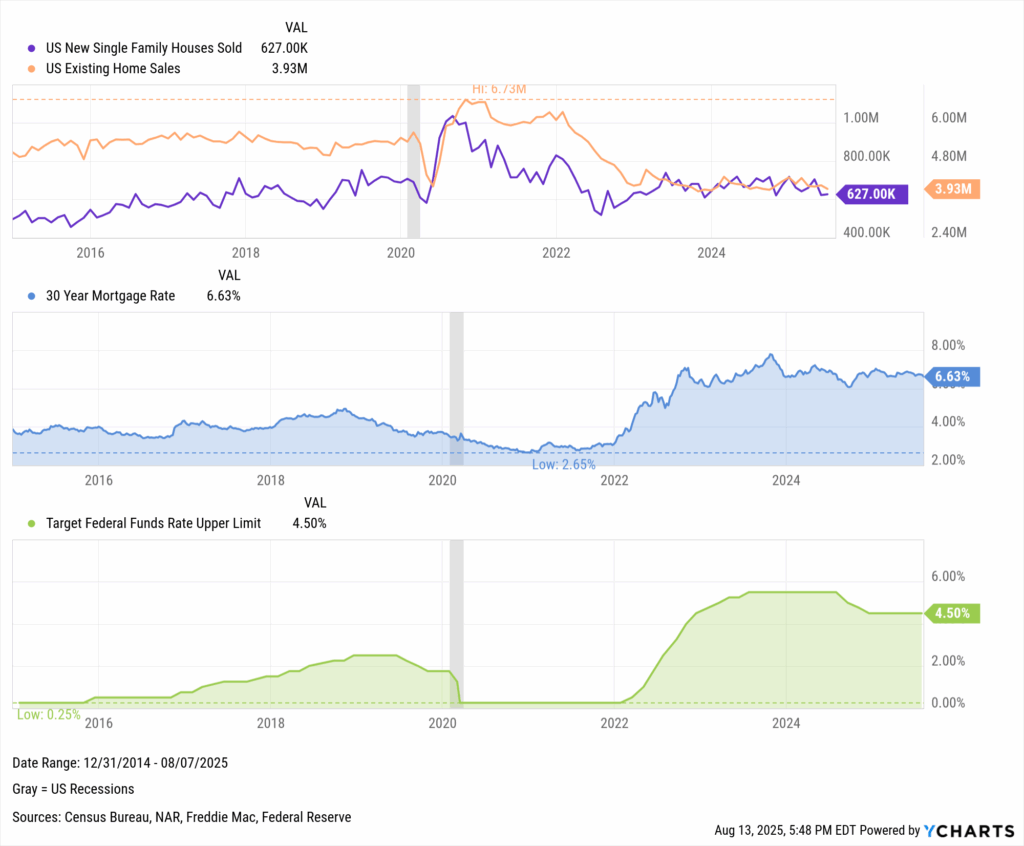
Mortgage costs are among the most closely watched consumer impacts of Fed policy.
The prevailing 30-Year Mortgage Rate and its 15-Year counterpart tend to follow the 10-Year Treasury Rate more so than the Fed Funds Rate. Mortgages are backed by bonds and securities, which align more with an instrument like the 10-year treasury. The Fed doesn’t directly target long-term instruments, but since rates of most shapes and sizes experience a ripple effect from the Fed’s actions, mortgage rates tend to do the same.
The 30-year rate peaked at 7.80% in October 2023, up from just 2.65% in January 2021. Late-2024 cuts pulled rates down from those highs, with 2025 holding steady during the Fed’s pause.
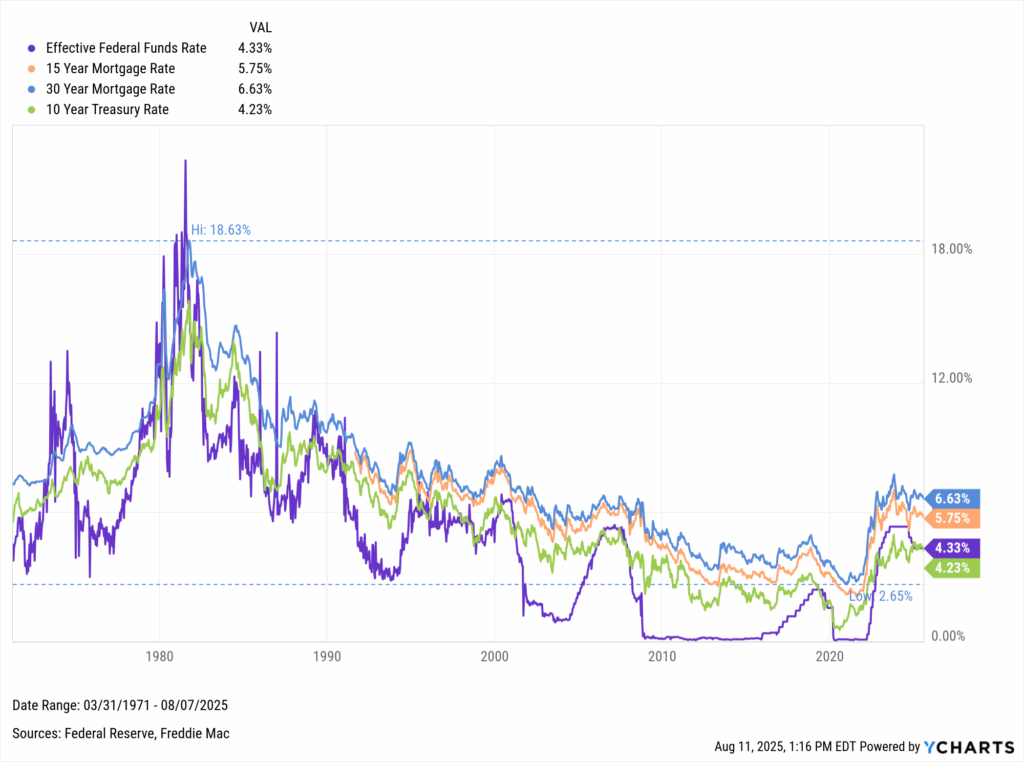
Download Visual | Modify in YCharts
So far, easing hasn’t broken the housing market’s “lock-in effect” where owners hesitate to swap low-rate mortgages for higher ones. Additional cuts could shift that dynamic, creating better conditions for buyers and potentially spurring more transactions.
Download Visual | Modify in YCharts
Prime Loan Rate
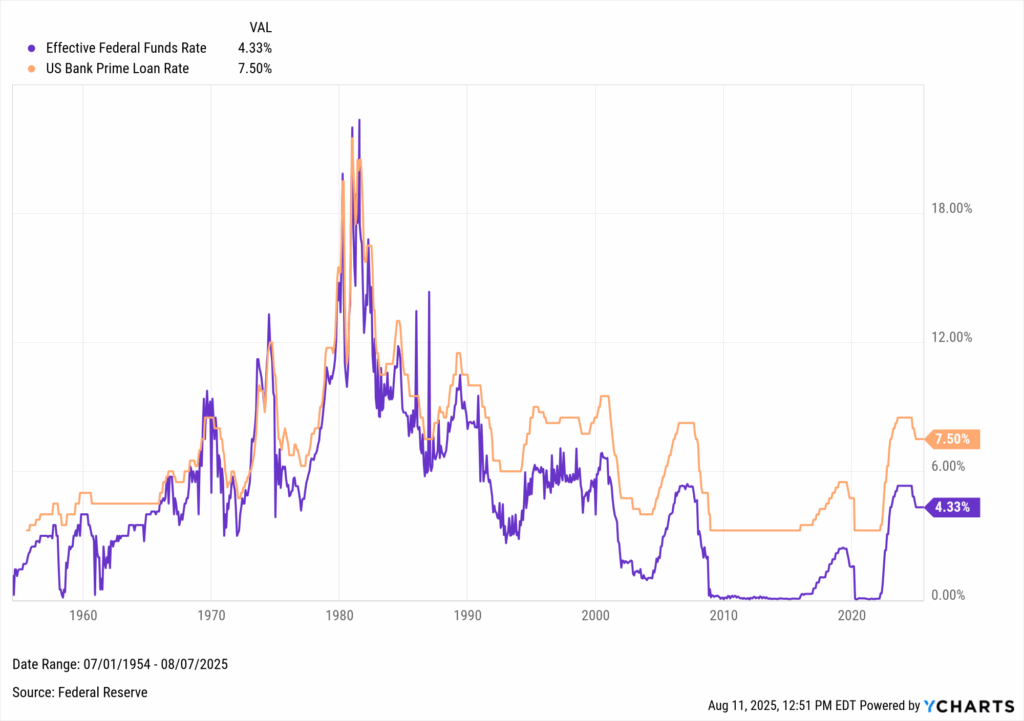
The Prime Loan Rate (Fed Funds Rate + roughly three percentage points) is the benchmark for banks lending to their best customers. It moves almost in lockstep with Fed policy.
The US Bank Prime Loan Rate is strongly correlated with the Fed Funds Rate. As seen in the chart below, the three Fed rate cuts toward the end of 2024 have brought the current Prime Loan Rate to 7.5%, one percentage point below its highest level in over 20 years. Any further Fed rate cuts are likely to lower the Prime Loan Rate by a proportional amount, leading to lower borrowing costs and thereby stimulating economic activity.
Download Visual | Modify in YCharts
Credit Card Interest
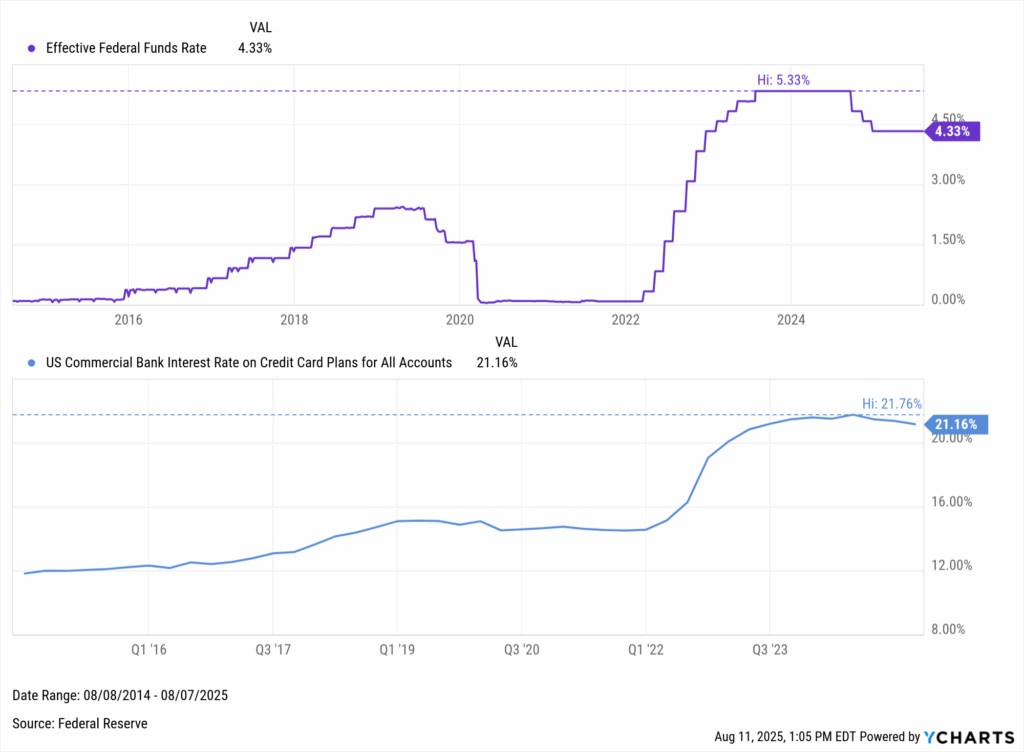
Changes to the Fed Funds Rate can also influence credit card interest rates, known as Annual Percentage Rate (APR).
The link to Fed policy is somewhat inconsistent. APR barely moved lower when the Fed cut to 0% in 2020, yet surged alongside recent hikes, hitting 21.76% in Q3 2024.
APRs held steady in early 2024 as the Fed paused at 5.5%, but recent cuts have nudged rates down, offering modest relief to borrowers and supporting consumer spending.
Download Visual | Modify in YCharts
Savings Accounts & CDs
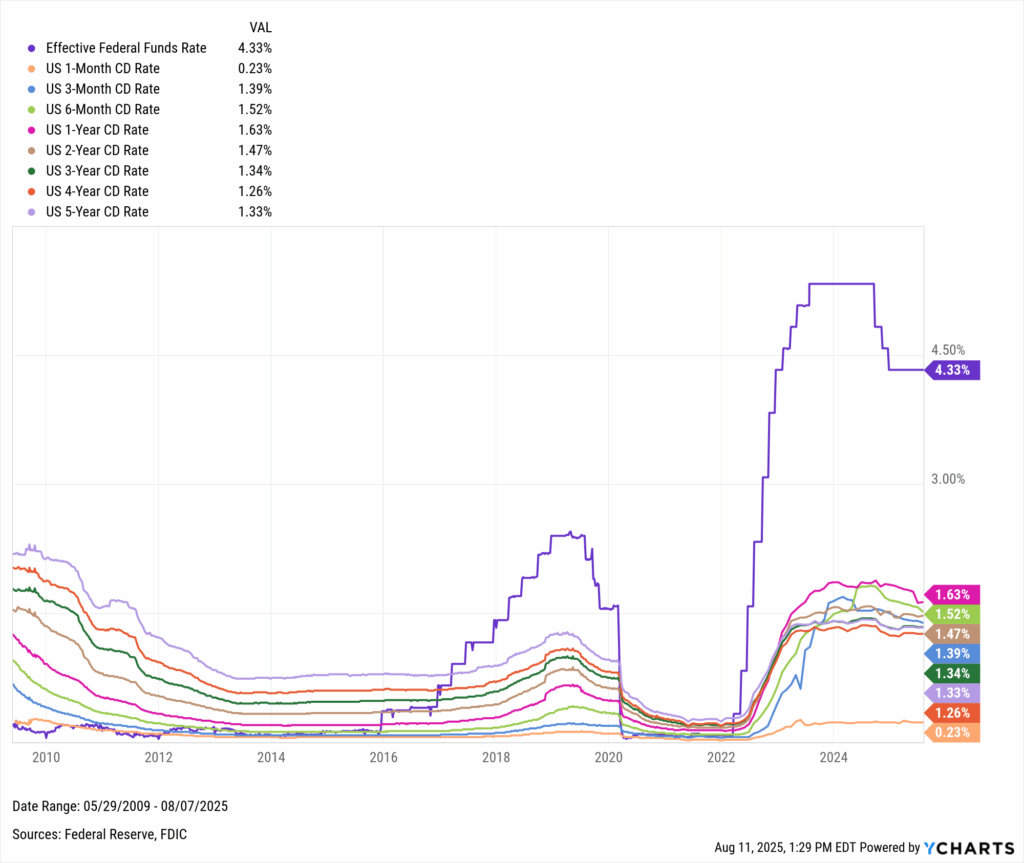
Rate cuts tend to hurt savers. When the Fed hikes, banks compete for deposits with higher yields on savings accounts and certificates of deposits (CDs). When rates fall, that incentive fades.
CD yields surged in the 2022–2023 hike cycle but have slipped since recent cuts. Further easing would likely push them lower, prompting savers to seek alternative investments with stronger return potential, especially those with longer time horizons or higher risk tolerance.
Download Visual | Modify in YCharts
How Stocks Are Affected by Fed Rate Cuts
Lower rates reduce borrowing costs, freeing capital for business expansion and fueling consumer spending, both of which are tailwinds for corporate earnings.
Equity markets have historically welcomed cuts. Since the Fed Funds Rate began falling from its 1981 peak, the S&P 500 has delivered a 9.27% annualized return, with many rallies kicking off in low-rate environments.
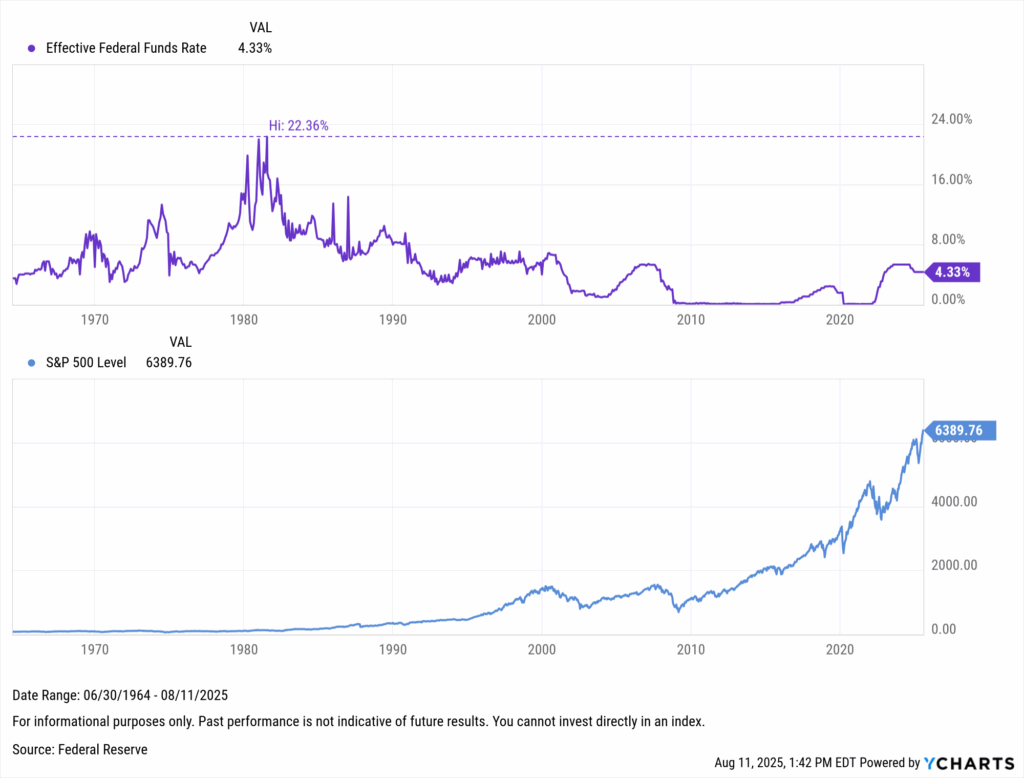
Download Visual | Modify in YCharts
A pause in rate hikes could help maintain or even boost current market momentum, offering opportunities for investors to capitalize on equities, and providing companies with more attractive financing options. The S&P 500 popped 1.7% the day after the half-point rate cut announcement on September 18th, 2024, supporting a positive narrative on the impact of rate cuts for equities. The longer-term impact for equities may be tied to whether the Federal Reserve can navigate a soft-landing for the economy, which has tended to benefit all asset classes, especially equities.
Economic Indicators and Rate Cuts
Given that the Fed’s objective is to achieve a dual mandate of maximum employment and long-term price stability, FOMC officials factor a wide breadth of economic indicators into rate decisions.
Inflation
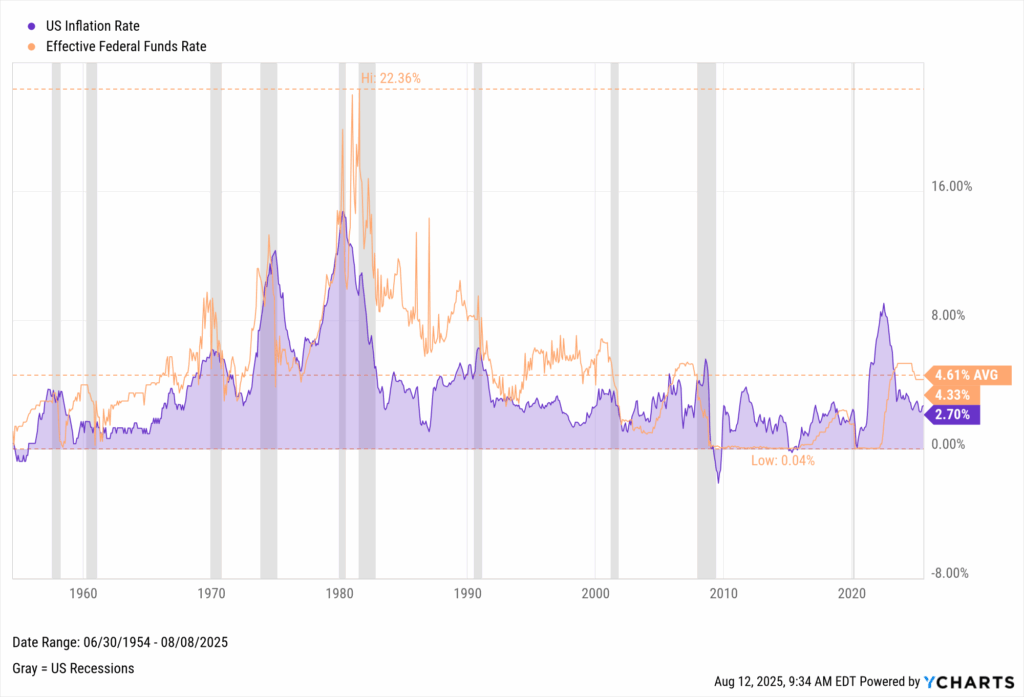
Changes to the Fed Funds Rate can be viewed as reactionary measures to maintain price stability. When inflation rises to far above the Fed’s 2% target, the Fed often takes action in the form of rate hikes to combat inflation. Conversely, when inflation falls back toward 2%, the Fed historically issues rate cuts as the institution deems that inflation has been sufficiently brought under control. We recently explored the Fed’s approach to managing inflation with a goal of long-term price stability and its impact on asset prices.
The following long-term chart comparing the Fed Funds Rate to inflation shows that the former often follows the latter’s lead, indicating the Fed’s use of the rate as a tool to help reel in inflation:
Download Visual | Modify in YCharts
We dove deeper into the Fed’s approach to managing inflation with a goal of long-term price stability and its impact on asset prices.
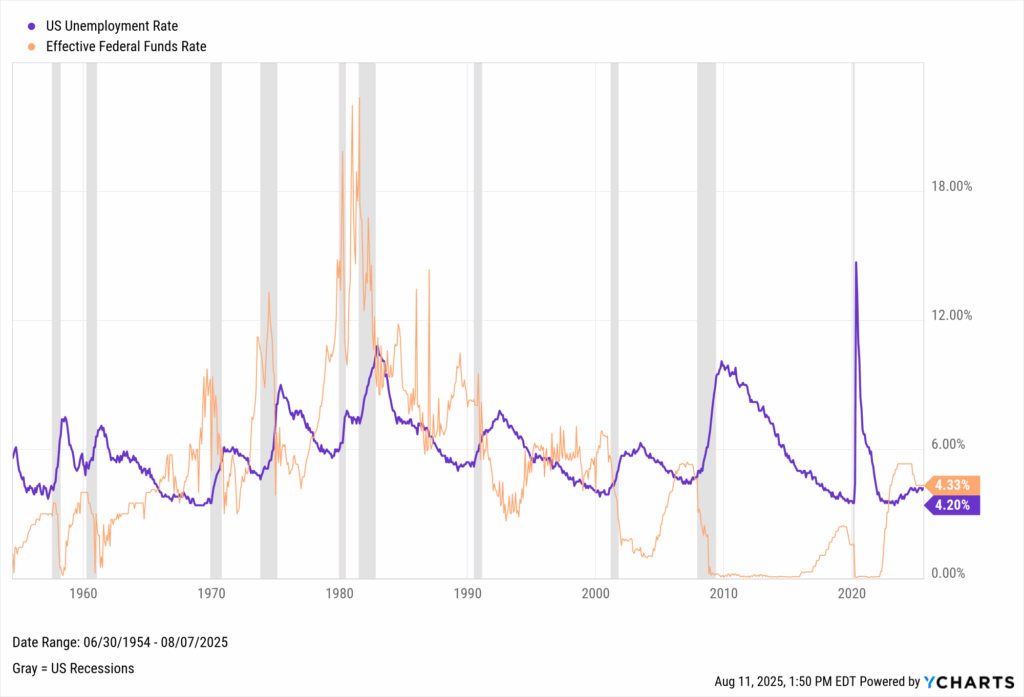
Employment
Regarding the second part of the Fed’s dual mandate, shifts in employment indicator patterns often lag behind Fed Funds Rate movements. Unemployment tends to rise following rate hike cycles, then falls some time after rates are cut:
Download Visual | Modify in YCharts
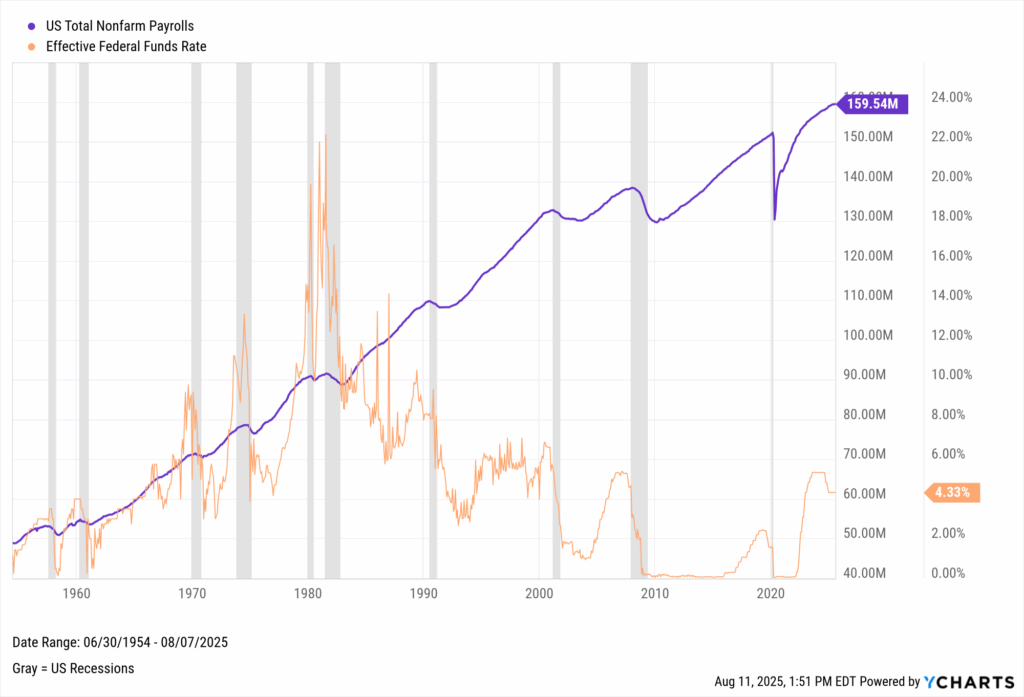
Total payrolls have often taken a dip following rate hike cycles, but job gains surge for prolonged periods in lower-rate environments:
Download Visual | Modify in YCharts
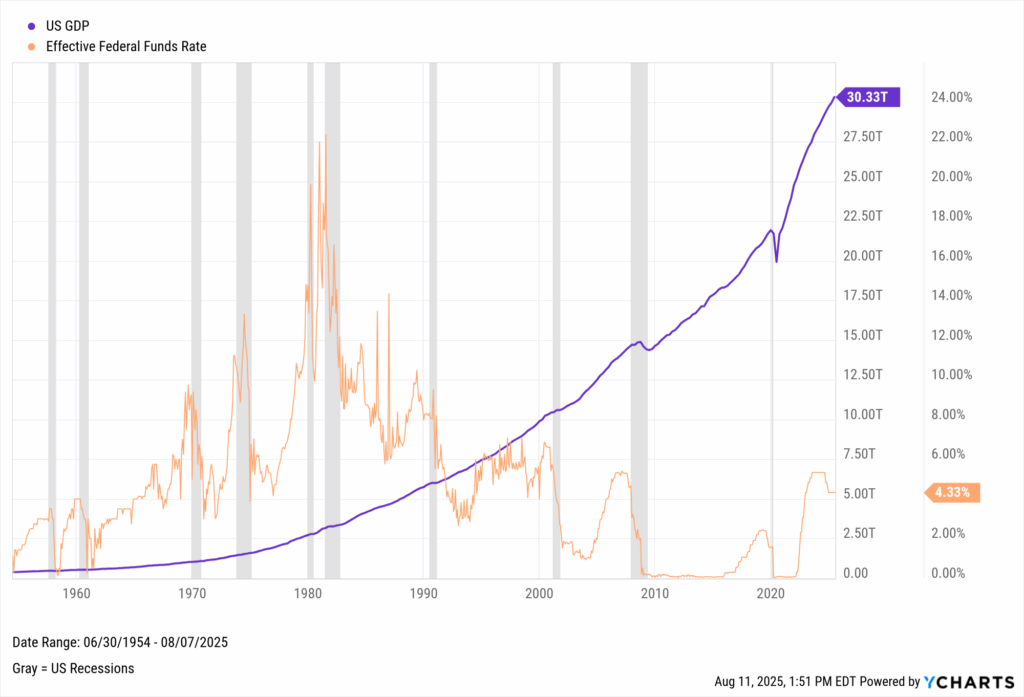
GDP
Though lower rate environments have accelerated U.S. GDP growth, American economic output has, for the most part, been able to withstand the Fed’s actions over time. The most noticeable GDP contractions have occurred during recessionary periods; intuitively, this makes sense as two consecutive quarters of negative GDP growth is often cited as an element of a recessionary period (though not the sole determinant). Even though concerns over a forthcoming recession still loom, historical GDP figures show that the economy has a proven ability to thrive longer-term even when downturns occur.
Download Visual | Modify in YCharts
What Happened to Stocks in the Two Recent Rate Cut Cycles?
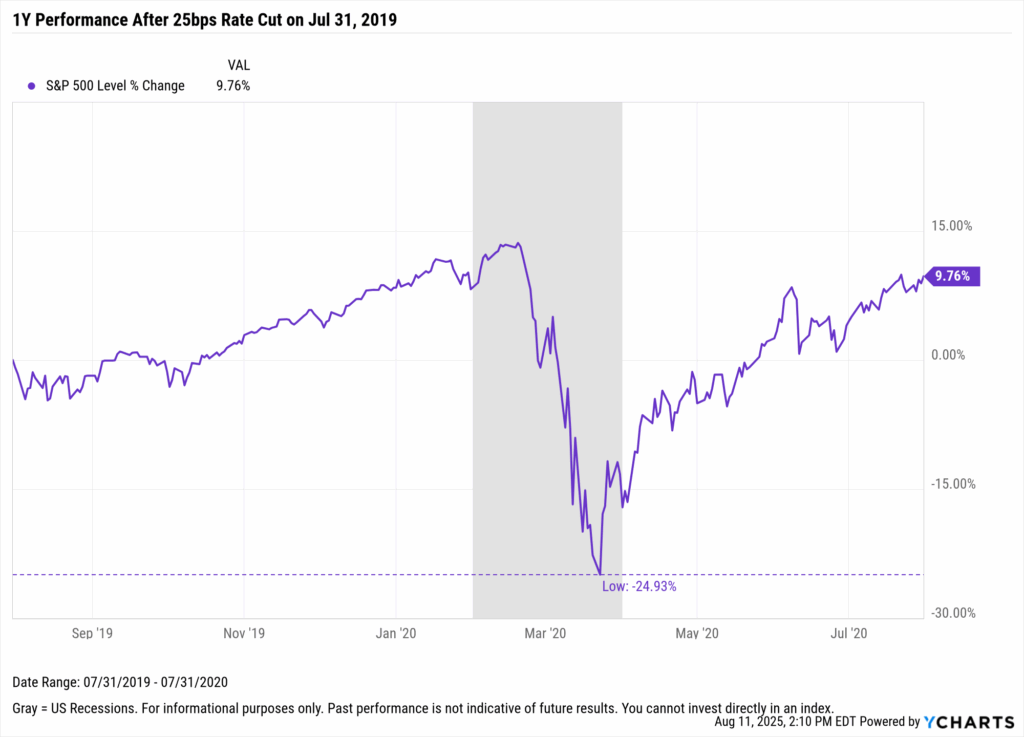
Both of the last two easing cycles saw major market shocks within a year of the first cut, yet stocks still posted strong gains.
In the one year following the 2019 cycle’s first rate cut on July 31, the S&P 500 sank nearly 25% at its lowest point during the COVID selloff but ultimately finished up 9.8%.
Download Visual | Modify in YCharts
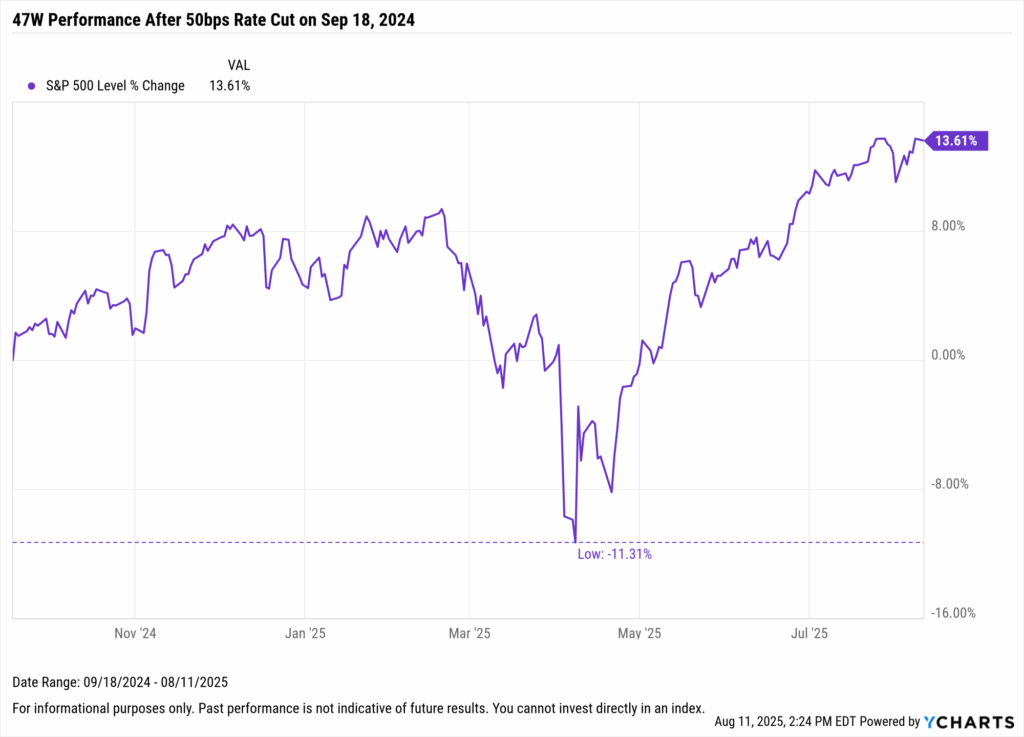
Fast forward to September 18, 2024, where the Fed opened the next rate cut cycle with a 50 basis-point cut followed by two more that year. Stocks climbed early, dipped on tariff threats, then closed the near one-year period ending August 11th, 2025 with a 13.6% gain, supported by a stable Fed stance and no further hikes.
Download Visual | Modify in YCharts
The Bottom Line
The Fed marked the end of an aggressive rate hike cycle at its September 18th, 2024 FOMC meeting by cutting its benchmark Fed Funds Rate as prices show signs of stabilization within the Fed’s target range. Further rate cuts could cause a variety of effects throughout financial markets. Some areas of the economy felt head-on impacts from the Fed Funds Rate, while others experienced lighter effects. It pays to know the impacts of the Fed Funds Rate so you don’t find yourself “Fighting the Fed.”
Whenever you’re ready, there are 3 ways YCharts can help you:
1. Looking to better communicate the importance of economic events to clients?
Send us an email at hello@ycharts.com or call (866) 965-7552. You’ll be directly in touch with one of our Chicago-based team members.
2. Want to test out YCharts for free?
Start a no-risk 7-Day Free Trial.
3. Sign up to receive a copy of our latest research, “Which Asset Classes Perform Best As Inflation is Driven Lower.”
Disclaimer
©2025 YCharts, Inc. All Rights Reserved. YCharts, Inc. (“YCharts”) is not registered with the U.S. Securities and Exchange Commission (or with the securities regulatory authority or body of any state or any other jurisdiction) as an investment adviser, broker-dealer or in any other capacity, and does not purport to provide investment advice or make investment recommendations. This report has been generated through application of the analytical tools and data provided through ycharts.com and is intended solely to assist you or your investment or other adviser(s) in conducting investment research. You should not construe this report as an offer to buy or sell, as a solicitation of an offer to buy or sell, or as a recommendation to buy, sell, hold or trade, any security or other financial instrument. For further information regarding your use of this report, please go to: ycharts.com/about/disclosure
Next Article
These are the Fastest Growing Value ETFs in 2024Read More →