
Fundamental Charts
Don’t just tell. Show.

Tell a compelling story with stunning visuals
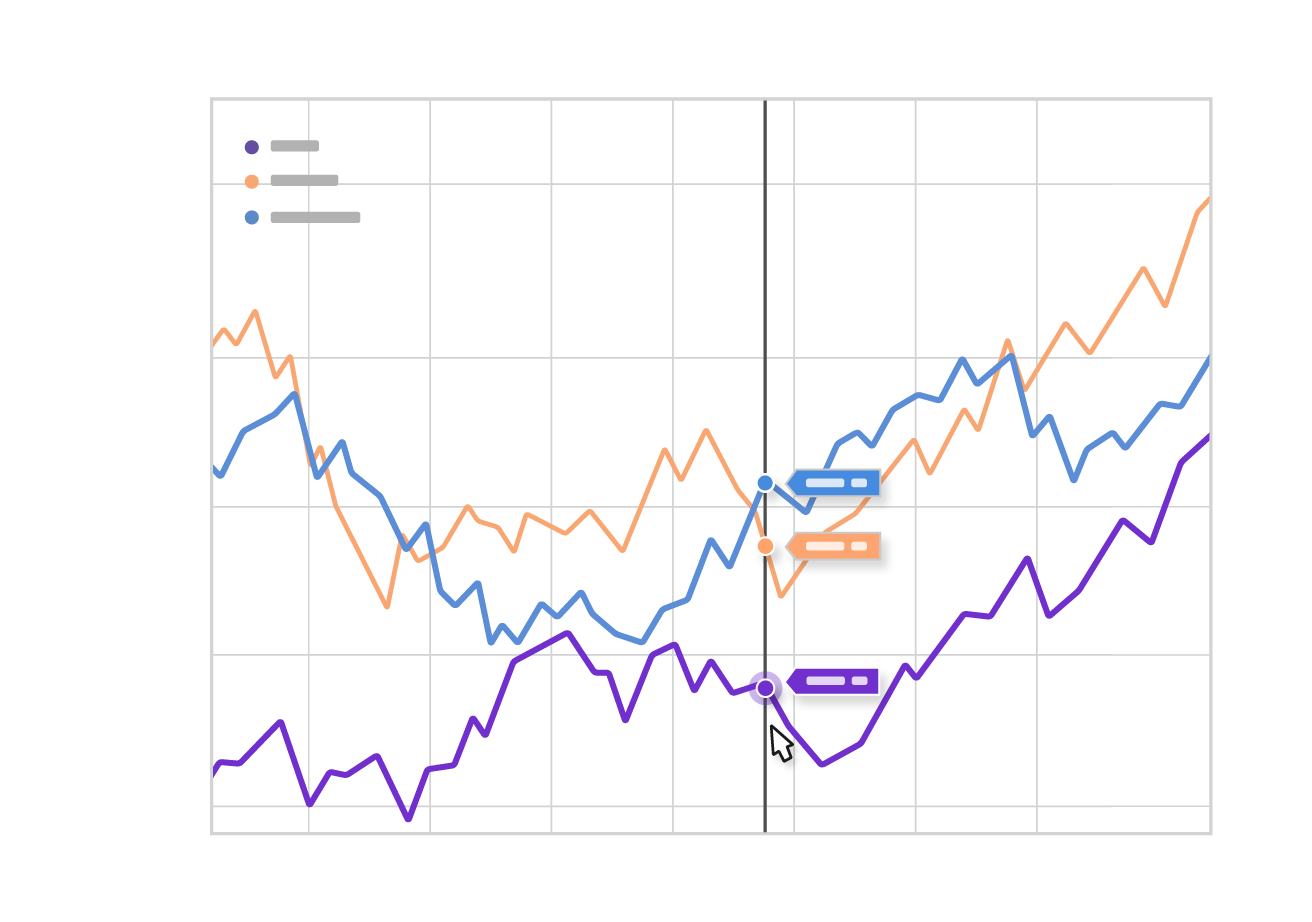
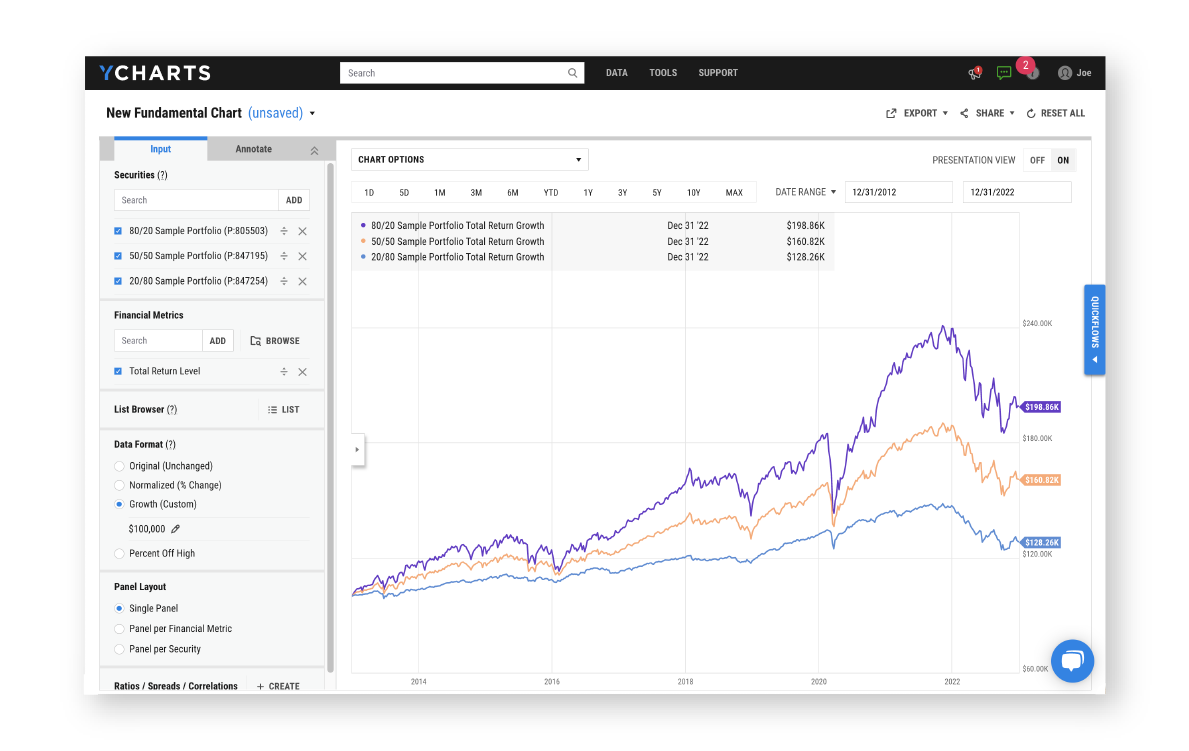
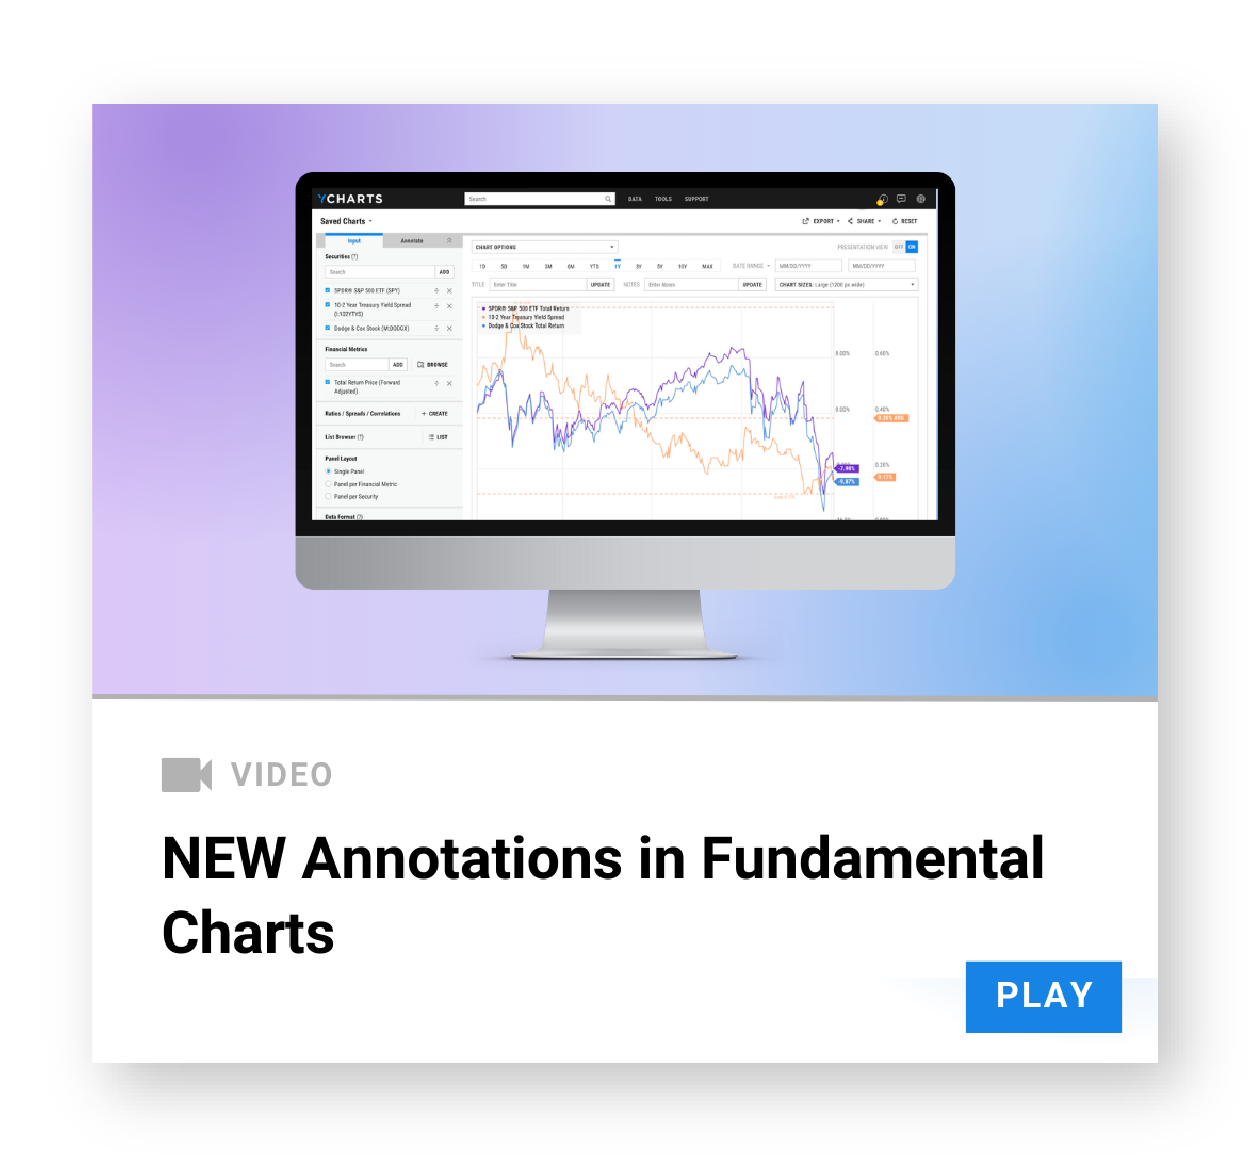
While most stock charting software is limited to showing static values, Fundamental Charts can illustrate percent change, percent off high or the growth of a custom dollar amount for any security or Model Portfolio to show the practical impacts for clients. YCharts enables the comparison of multiple securities based on virtually any performance metric or valuation ratio, along with on-chart annotation features to drive home the “why” behind a security’s performance.
Quality and quantity of data
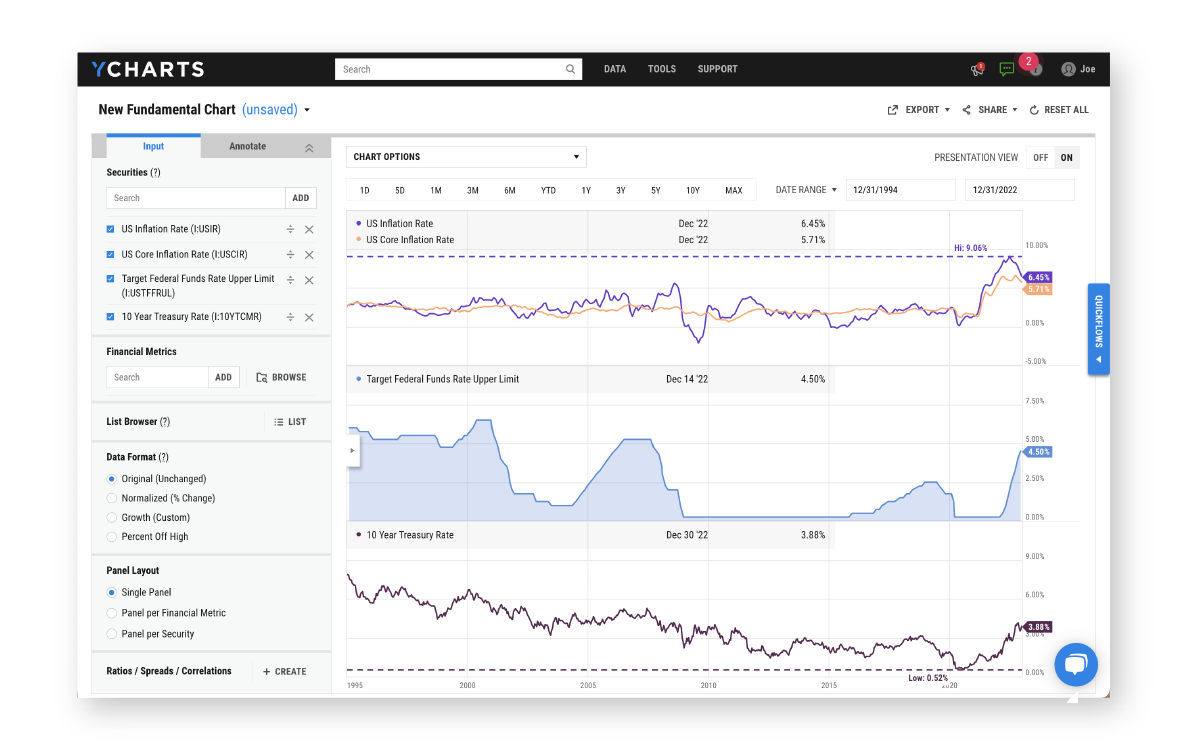
Not only is YCharts’ data reliable and up-to-date, but there’s tons of it. Go beyond price with a library of over 4,000 metrics and line items that cover nearly 100,000 securities and 500,000+ economic indicators such as labor statistics, GDP, and more. Securities and economic indicators alike can be added to Fundamental Charts, providing additional layers of insight into security performance and broader economic outlooks.
Brandable, shareable, versatile
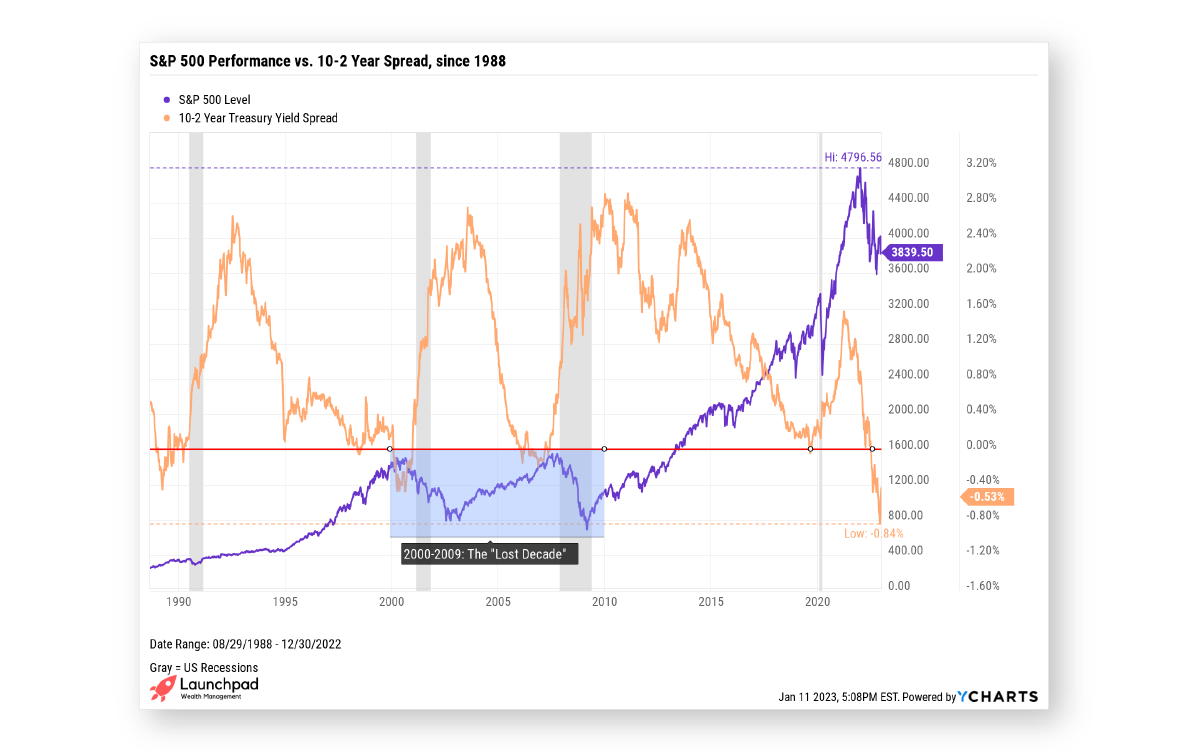
Share your thoughts with clients and colleagues quickly and easily. You can save charts as printable images, embed them in emails or blogs, and even share directly to Twitter or with your team. Fundamental Charts are brandable with your firm’s logo and custom color scheme so you can own your research and create a consistent experience for clients and prospects.
Learn how Fundamental Charts Can Enhance Client Communication
![]()