Monthly Canada Market Wrap: June 2022
Welcome back to the Canadian Monthly Market Wrap from YCharts! Here, we break down the most important market trends for Canada-based advisors and their clients every month. As always, feel free to download and share any visuals with clients and colleagues, or on social media.
Looking for the US Market Wrap? Click here.
Canada Market Summary for June 2022
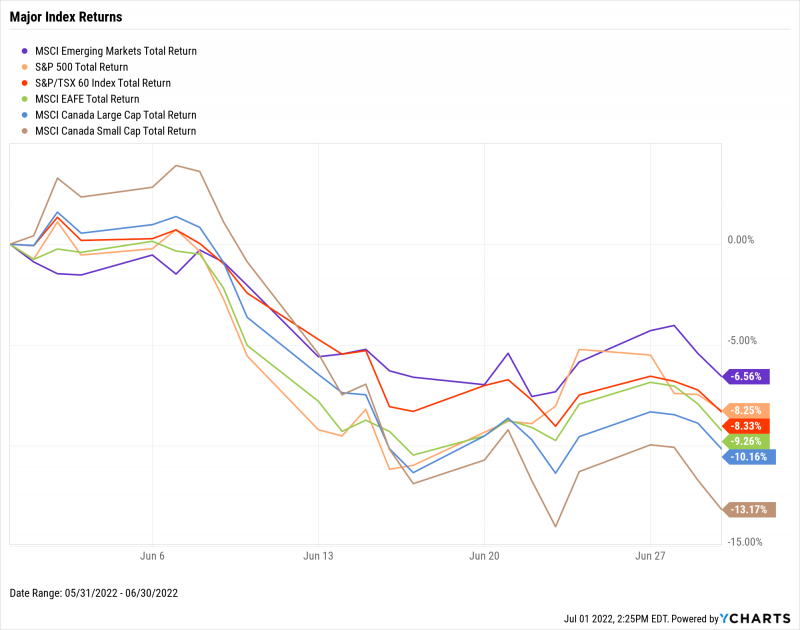
Canadian equities suffered a rough June, with the S&P/TSX 60 tumbling 8.3%. Both Canadian Small and Large Caps fell by double-digits, 13.2% and 10.2% respectively. The TSX’s 8.3% decline was matched in the United States by its counterpart, the S&P 500, as well.
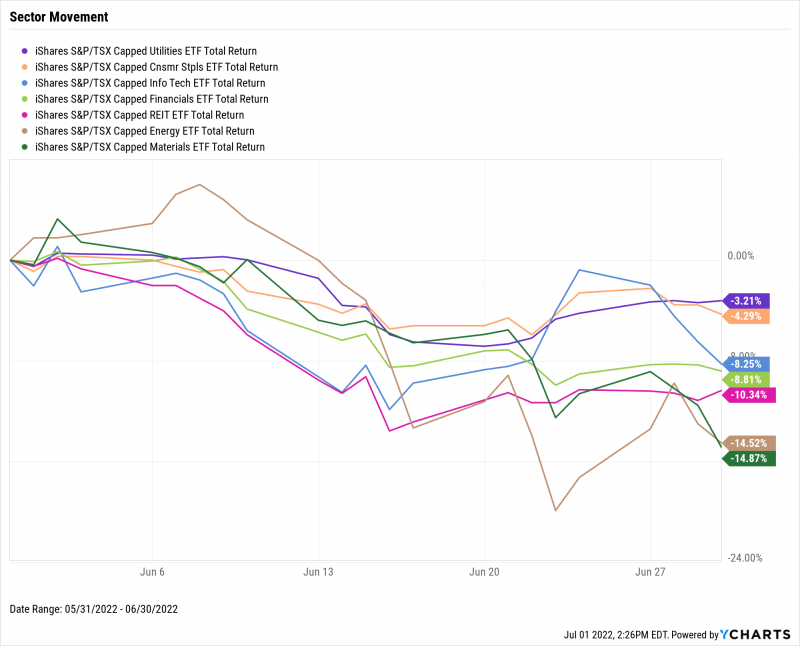
As a result, not a single sector was positive in June. The Materials sector dropped nearly 15%, while Energy came in just behind, down 14.5%. Utilities and Consumer Staples, sectors that are typically less sensitive to cyclical economic growth, were the only two that didn’t suffer declines of 8% or more.
Inflation in Canada surpassed 7% for the first time since March 1983, coming in at 7.73% for May 2022. May’s inflation print also marked the eleventh consecutive monthly increase. The price of gold in CAD was practically unchanged as well. However, recent month’s unemployment and production data was strong—the Canadian unemployment rate fell to another all-time low of 5.1%, and the Canada Ivey PMI jumped from 66.3 to 72, a rebound of 8.6%.
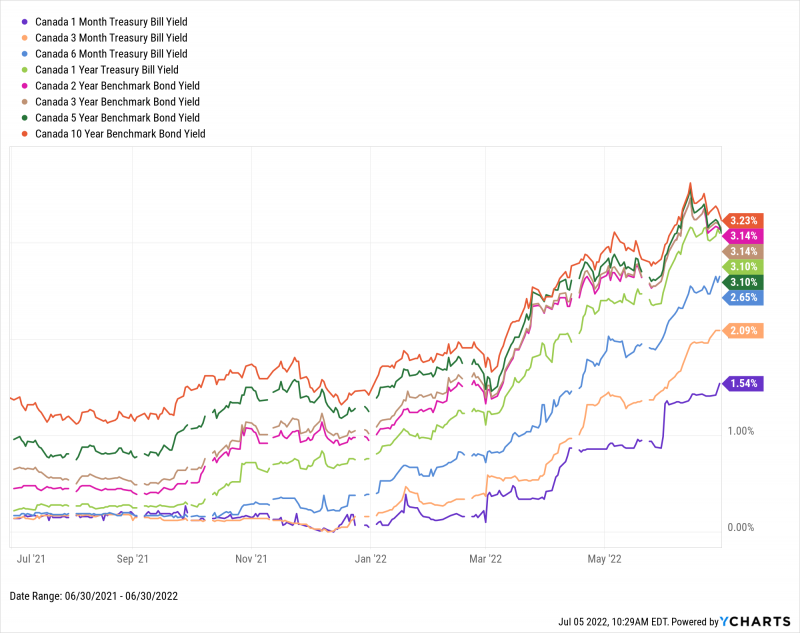
Short-term interest rates surged in June following the Bank of Canada raising its benchmark interest rate to 1.5% at the start of the month. Yield on the 1-Month Treasury Bill increased 55 points to 1.54%, and the 3-Month Treasury Bill surpassed 2% for the first time since October 2008. Longer-term bonds saw a boost in rates as well, but flattening occurred on that end of the Canadian yield curve toward the end of June. As of month’s end, the 1-Year Treasury Bill and 5-Year Benchmark Bond yields were 3.10%, while the 2-Year and 3-Year Benchmark Bond yields were 3.14%.
Jump to Fixed Income Performance
Equity Performance
Major Indexes
Download Visual | Modify in YCharts
Canadian Sector Movement
Download Visual | Modify in YCharts
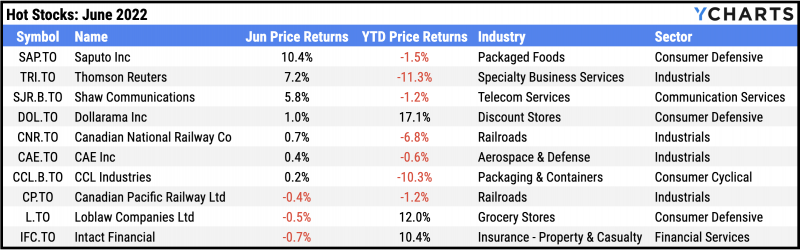
Hot Stocks: Top 10 TSX 60 Performers of June 2022
Saputo Inc (SAP.TO): 10.4% gain in June
Thomson Reuters (TRI.TO): 7.2%
Shaw Communications (SJR.B.TO): 5.8%
Dollarama Inc (DOL.TO): 1.0%
Canadian National Railway Co (CNR.TO): 0.7%
CAE Inc (CAE.TO): 0.4%
CCL Industries (CCL.B.TO): 0.2%
Canadian Pacific Railway Ltd (CP.TO): -0.4%
Loblaw Companies Ltd (L.TO): -0.5%
Intact Financial (IFC.TO): -0.7%
Download Visual | Modify in YCharts
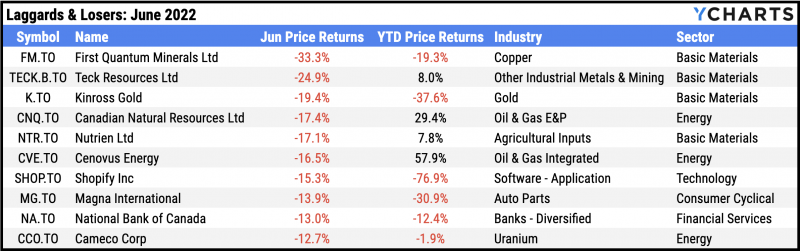
Laggards & Losers: 10 Worst TSX 60 Performers of June 2022
First Quantum Minerals Ltd (FM.TO): -33.3% decline in June
Teck Resources Ltd (TECK.B.TO): -24.9%
Kinross Gold (K.TO): -19.4%
Canadian Natural Resources Ltd (CNQ.TO): -17.4%
Nutrien Ltd (NTR.TO): -17.1%
Cenovus Energy (CVE.TO): -16.5%
Shopify Inc (SHOP.TO): -15.3%
Magna International (MG.TO): -13.9%
National Bank of Canada (NA.TO): -13.0%
Cameco Corp (CCO.TO): -12.7%
Download Visual | Modify in YCharts
Economic Data
Employment
The Canadian unemployment rate reached an all-time low of 5.1% in May, and the Canada Ivey Employment index rose 2.8 points to 67.9, its second-highest level since December 2017. As for temporary employment, a loss of 95,000 Canadian part-time workers was recorded in May.
Production and Sales
Following a nearly 8-point decline in April, the Canada Ivey PMI rebounded from 66.3 to 72.0 in May, nearing its all-time high of 74.20 set in March. In addition, Canada Real GDP increased 0.34% in April, marking the third straight month of Canadian economic growth.
Housing
Canadian housing prices continued to increase, with the Canada New Housing Price Index rising 0.32% in May.
Consumers and Inflation
Canadian Inflation clocked in at 7.73% in May, rising nearly one full percentage point MoM and reaching the highest level since February 1983. May’s print also marks the eleventh consecutive inflation increase. Canada’s Consumer Price Index marched upward with inflation, rising 1.07% in May.
Gold
The price of gold was $2,357.40 CAD per ounce as of June 24th, about unchanged month-over-month. Despite the tepid price movement in gold, the iShares S&P/TSX Global Gold ETF (XGD.TO) tumbled 11.2% in June and is now down 10.2% year to date.
Oil
Per-barrel oil prices rebounded in the last week of June to $111.44 USD for WTI and $119.69 USD for Brent, continuing a rise that has pushed prices up 48% and 55% year-to-date, respectively. The surges in oil prices sent both Canadian gas prices and Retail Sales among Canadian Gasoline Stations to all-time highs, with the latter up 40% from a year ago.
Cryptocurrencies
June encapsulated another harsh selloff in major cryptocurrencies. The price of Bitcoin fell below $20,000 USD intra month, settling at $20,108 USD at the end of June, which represents a monthly decline of 38.2%. Ethereum plunged 47% in June and also dipped below $1,000 USD for the first time since the start of 2021, finishing the month at $1,099 USD. Binance Coin ended June at $219.37 USD, with its monthly decline of 31.9% being the least voluminous of these three major cryptocurrencies. Year to date, Bitcoin is down 57.4%, Binance Coin is 57.7% lower, and Ethereum is 70.4% in the red.
Featured Market & Advisor News
Canadian banks face higher scrutiny as they expand in U.S. (BNN)
New on YCharts: ESG Data for Stocks, ETFs & Mutual Funds (YCharts)
Job vacancies grow in April to just over one million, wages rise in tight market (Advisor’s Edge)
Schwab Integration, Others Streamline Portfolio Workflows (YCharts)
Inflation not holding back Canadians from spending as retail sales jump (Financial Post)
What Happens After A Fed Rate Hike? (YCharts)
Fixed Income Performance
Canadian Treasury Yield Curve
Canada 1 Month Treasury Bill Yield: 1.54%
Canada 3 Month Treasury Bill Yield: 2.09%
Canada 6 Month Treasury Bill Yield: 2.65%
Canada 1 Year Treasury Bill Yield: 3.10%
Canada 2 Year Benchmark Bond Yield: 3.14%
Canada 3 Year Benchmark Bond Yield: 3.14%
Canada 5 Year Benchmark Bond Yield: 3.10%
Canada 10 Year Benchmark Bond Yield: 3.23%
Download Visual | Modify in YCharts
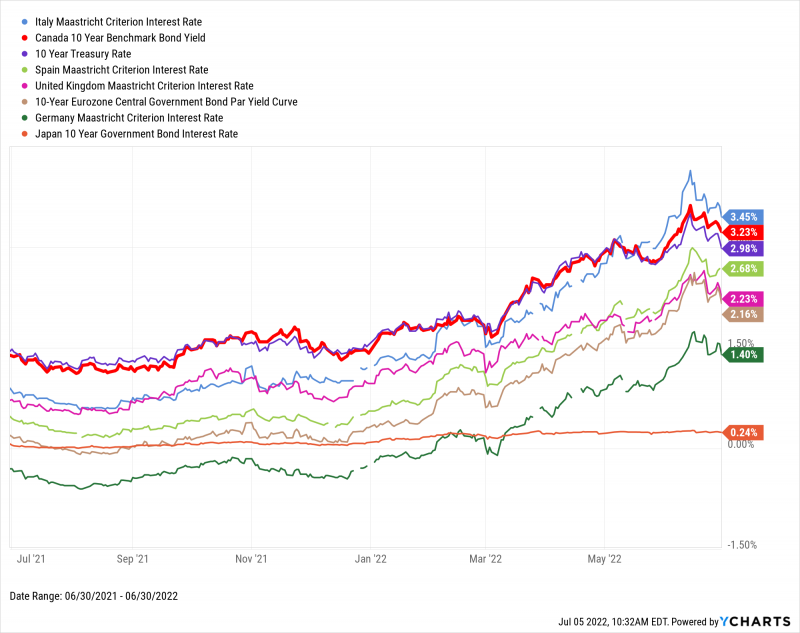
Global Bonds
Italy Long Term Bond Interest Rate: 3.45%
Canada 10 Year Benchmark Bond Yield: 3.23%
10 Year Treasury Rate: 2.98%
United Kingdom Long Term Bond Interest Rate: 2.23%
Spain Long Term Bond Interest Rate: 2.68%
10-Year Eurozone Central Government Bond Par Yield: 2.16%
Germany Long Term Bond Interest Rate: 1.40%
Japan 10 Year Government Bond Interest Rate: 0.24%
Download Visual | Modify in YCharts
Have a great July! 📈
Next Article
The Best Performing Mutual Funds in Each Category and How to Find ThemRead More →