
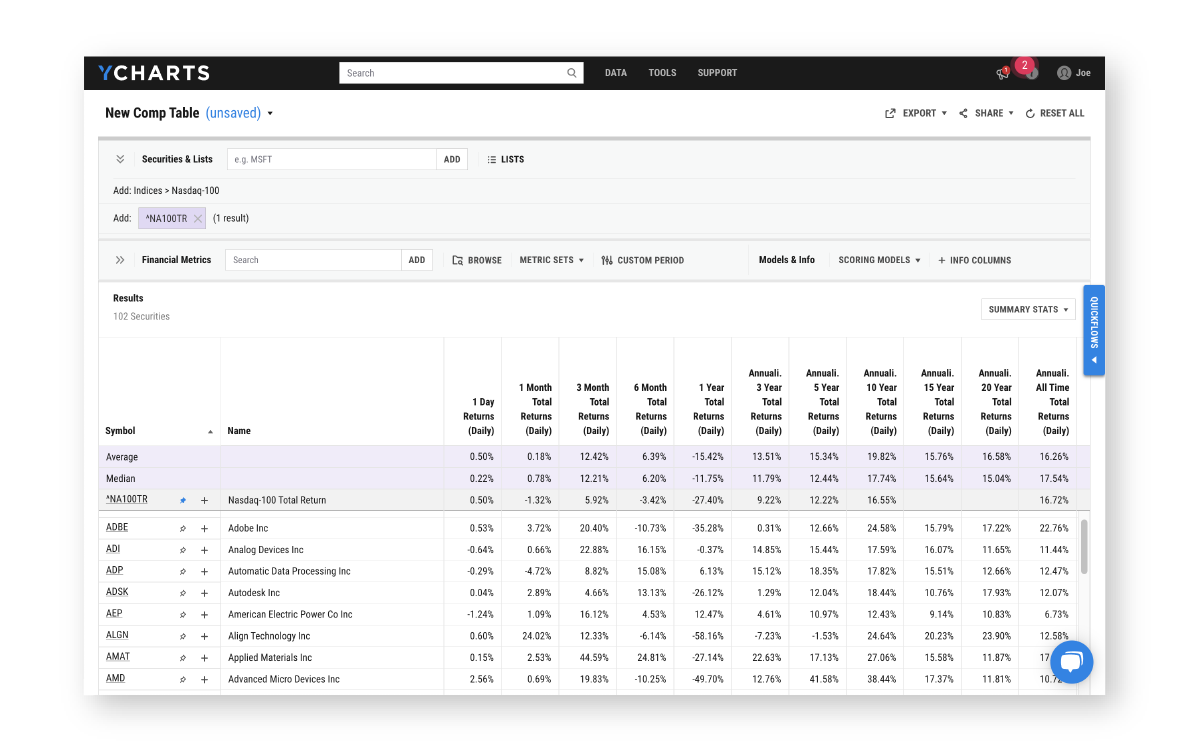
Comp Tables
Compare portfolios, funds, stocks, and more.

Analyze portfolio holdings & securities head-to-head
Utilize over 4,000 financial metrics including tax cost ratio, max drawdown, beta, ESG scores, and more to power better, more insightful analysis with Comp Tables. Implement your strategies derived from this stock and mutual fund comparison tool by using custom Scoring Models with user-defined metrics and weights to objectively rank holdings and securities.
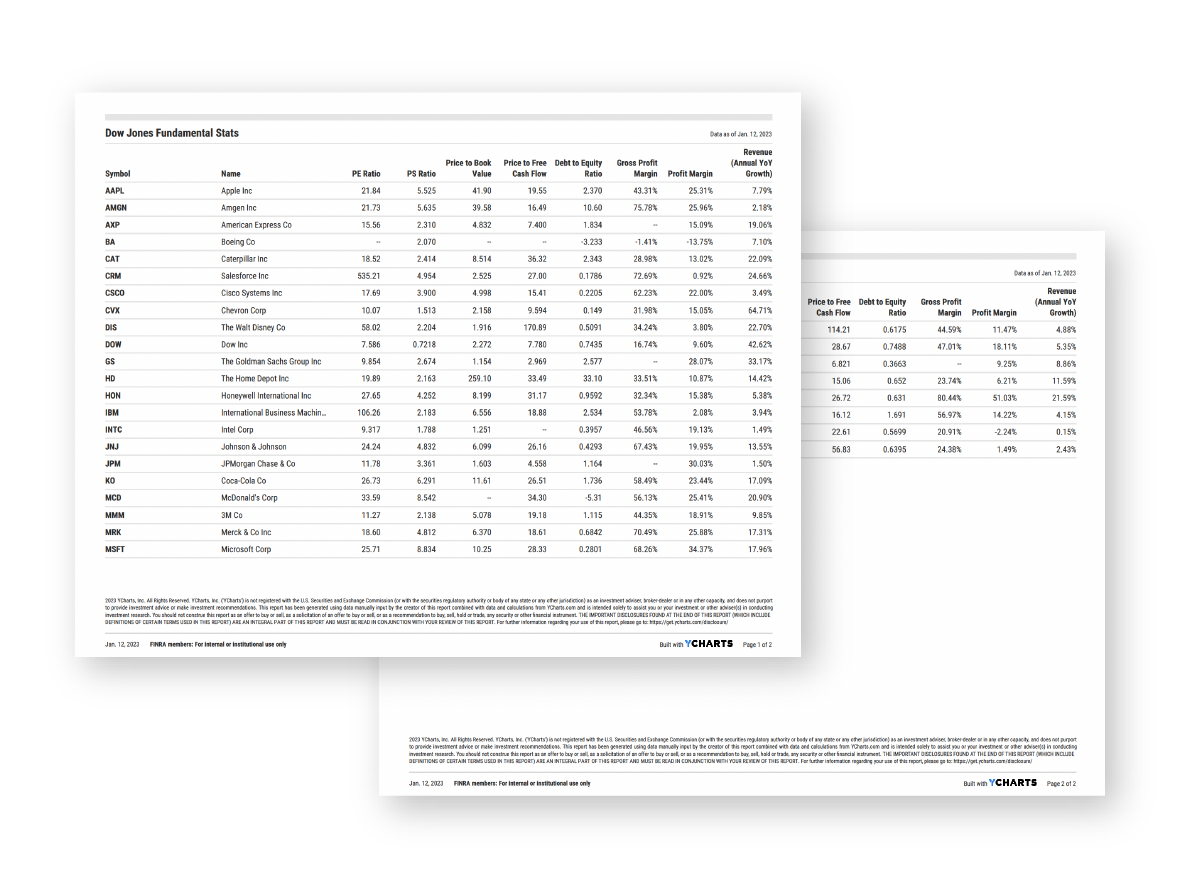
Align your team with shared research & collateral
Shared data views built in Comp Tables are exportable as client-friendly PDF reports for comparing securities, evaluating firm strategies, or auditing a holdings list. Additionally, pull in shared watchlists to take a deeper dive into security performance when meeting internally or with clients.
See Comp Tables in Action


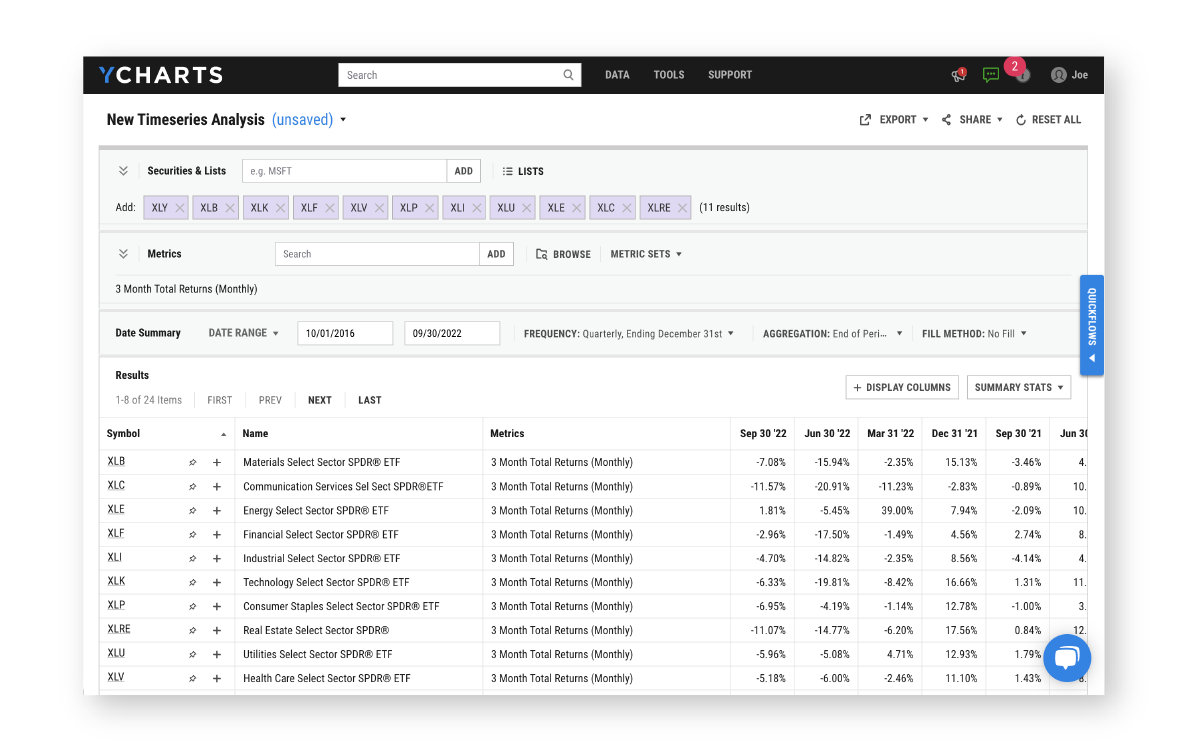
Compile large, historical data sets
Analyze how a financial metric or economic figure has changed over time, compile data at a period interval (e.g. period average, end-of-period) and frequency of your choosing, and export in highly usable and intuitive formats including Excel and PDF reports with Timeseries Analysis.
![]()