Dashboard
Your home base for market, portfolio, and economic data.

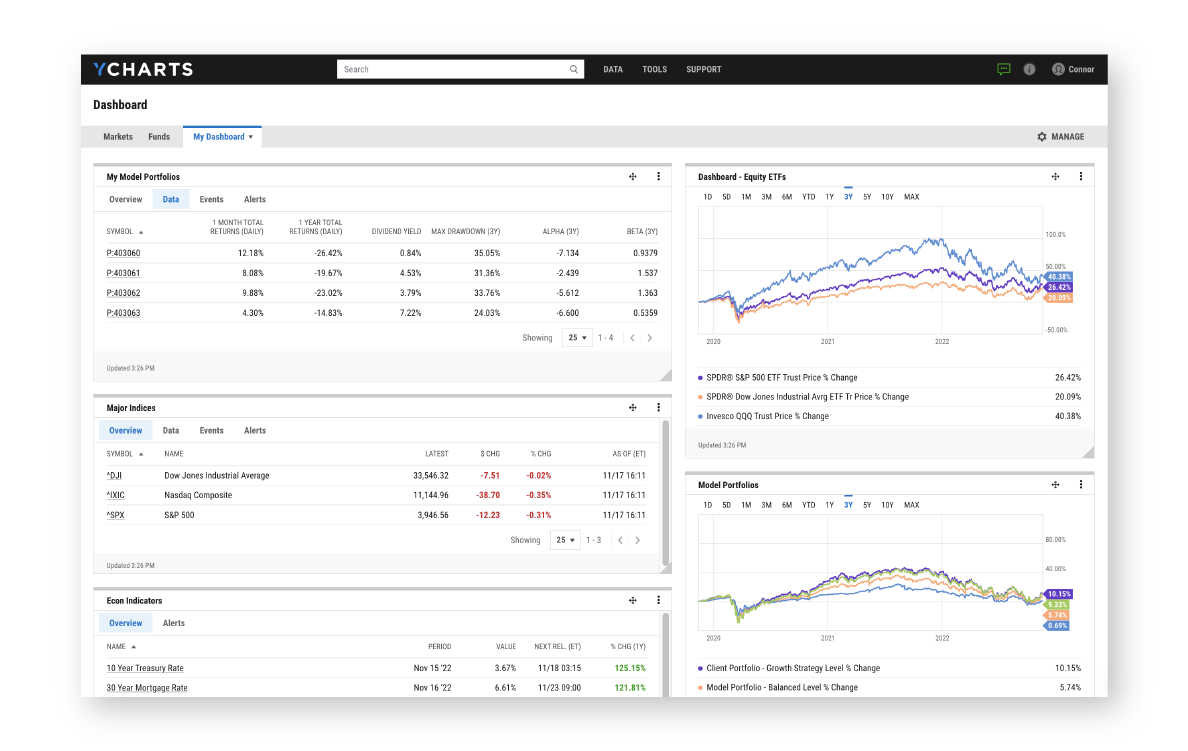
Monitor your portfolios, top holdings, and more
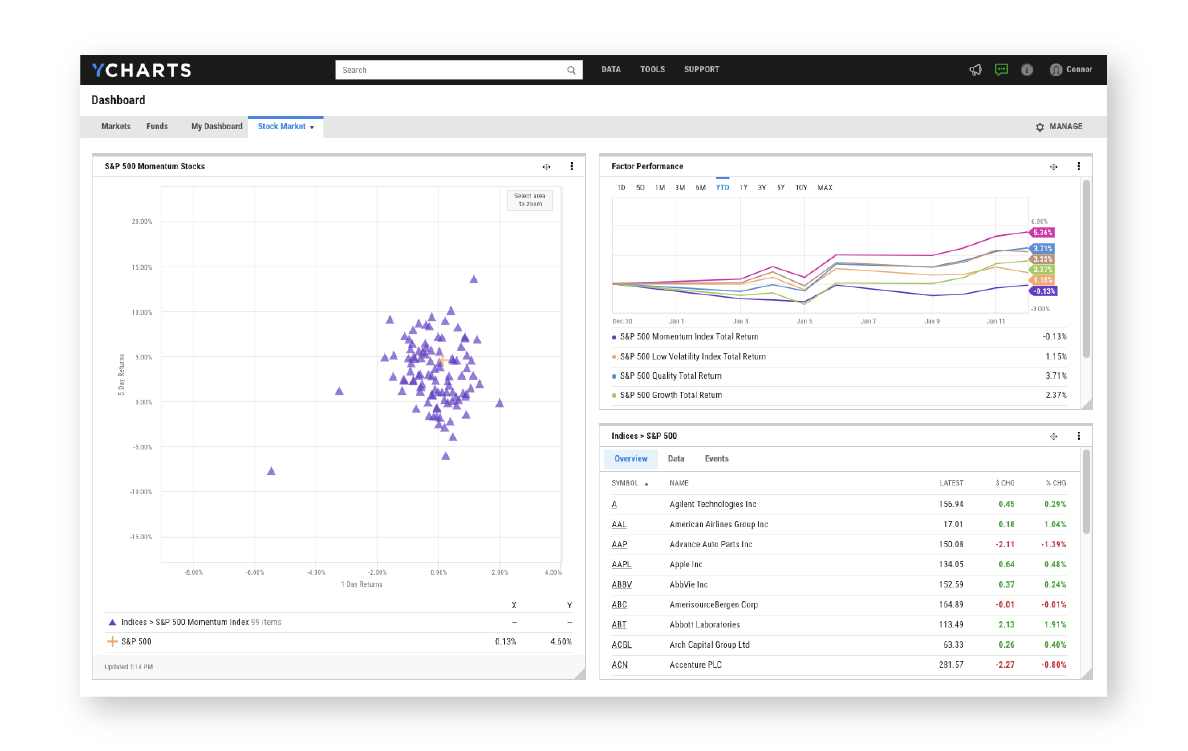
Customize your view of market, portfolio, security, and economic data to keep vital information at your fingertips. Live market data populates every Watchlist, Chart, and Scatter Plot that you personalize and add.

Share Dashboards, Watchlists, and visuals to align your team
Add your firm’s model portfolios, holdings, and research lists to a shared Dashboard to increase alignment. Increase the flow of information regardless of physical location, equipping everyone on your team for success.

See how you can leverage the YCharts Dashboard
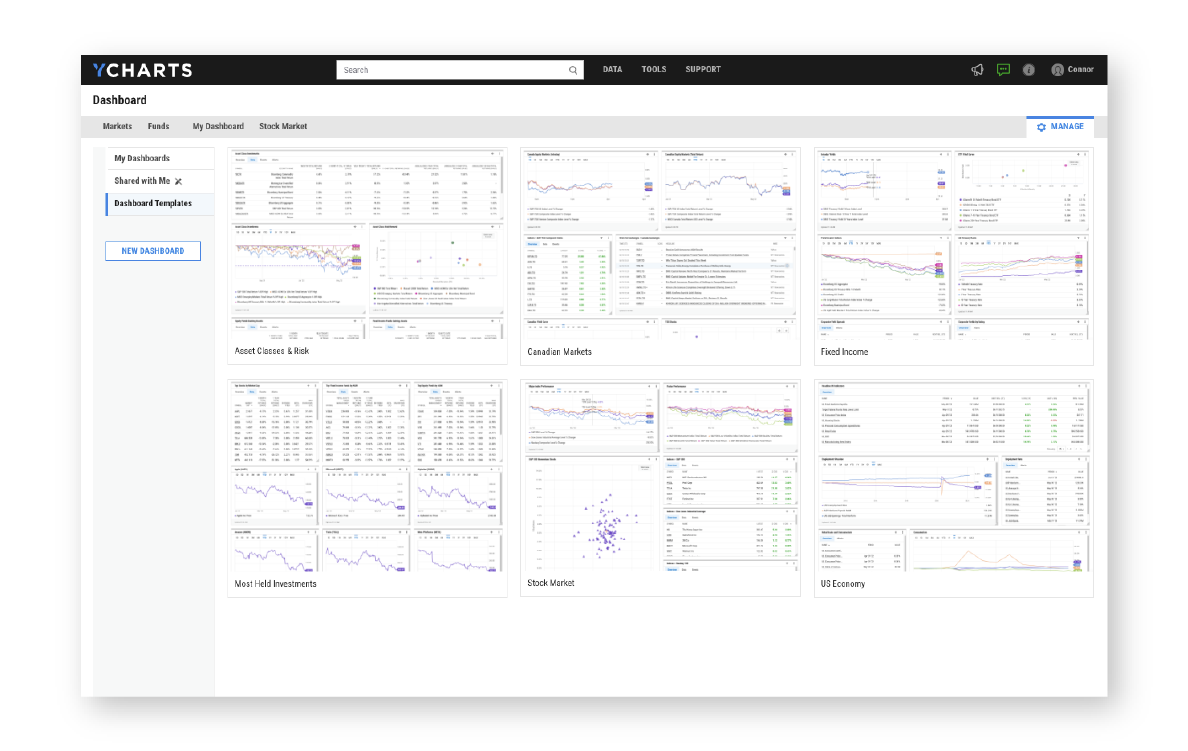
Leverage pre-built Dashboard templates
Focusing on key categories like US stocks, fixed income, economic data, asset classes, and more, Dashboard templates are jumping off points for reaching more insights in less time. It’s the only finance dashboard you’ll need.


