Portfolios
Build, analyze, and manage strategies & benchmarks with an intuitive portfolio analysis tool.
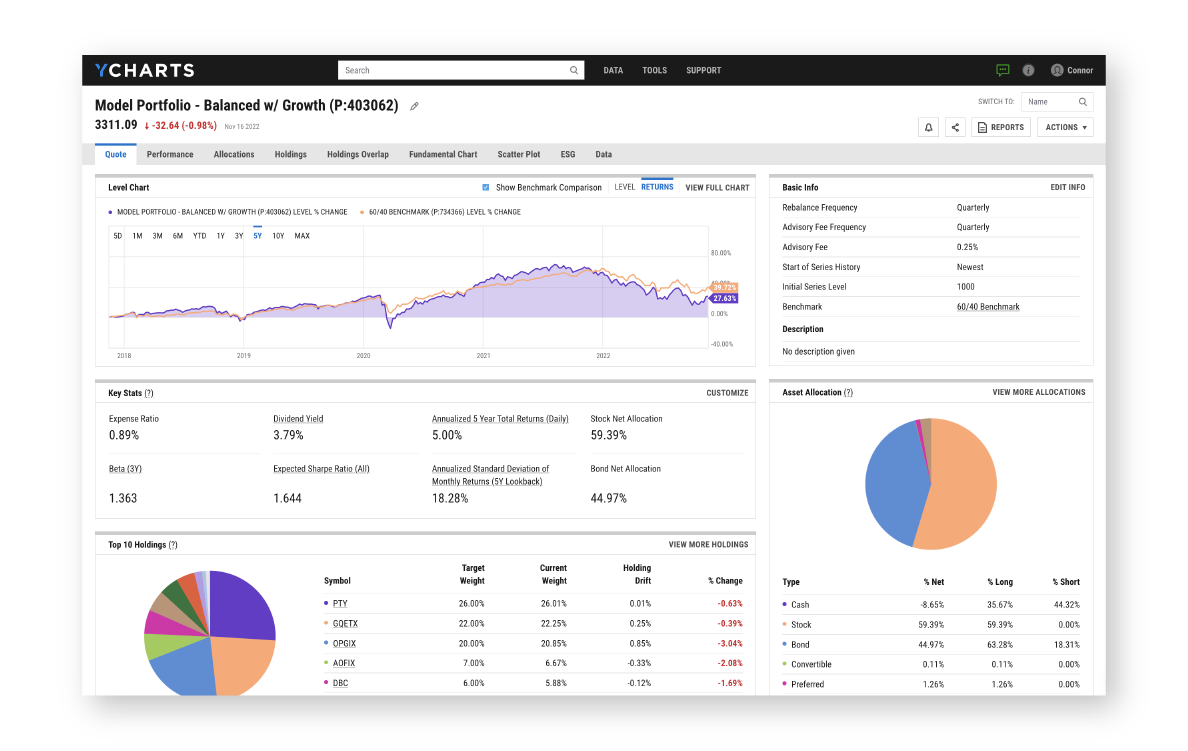
Visualize key portfolio metrics
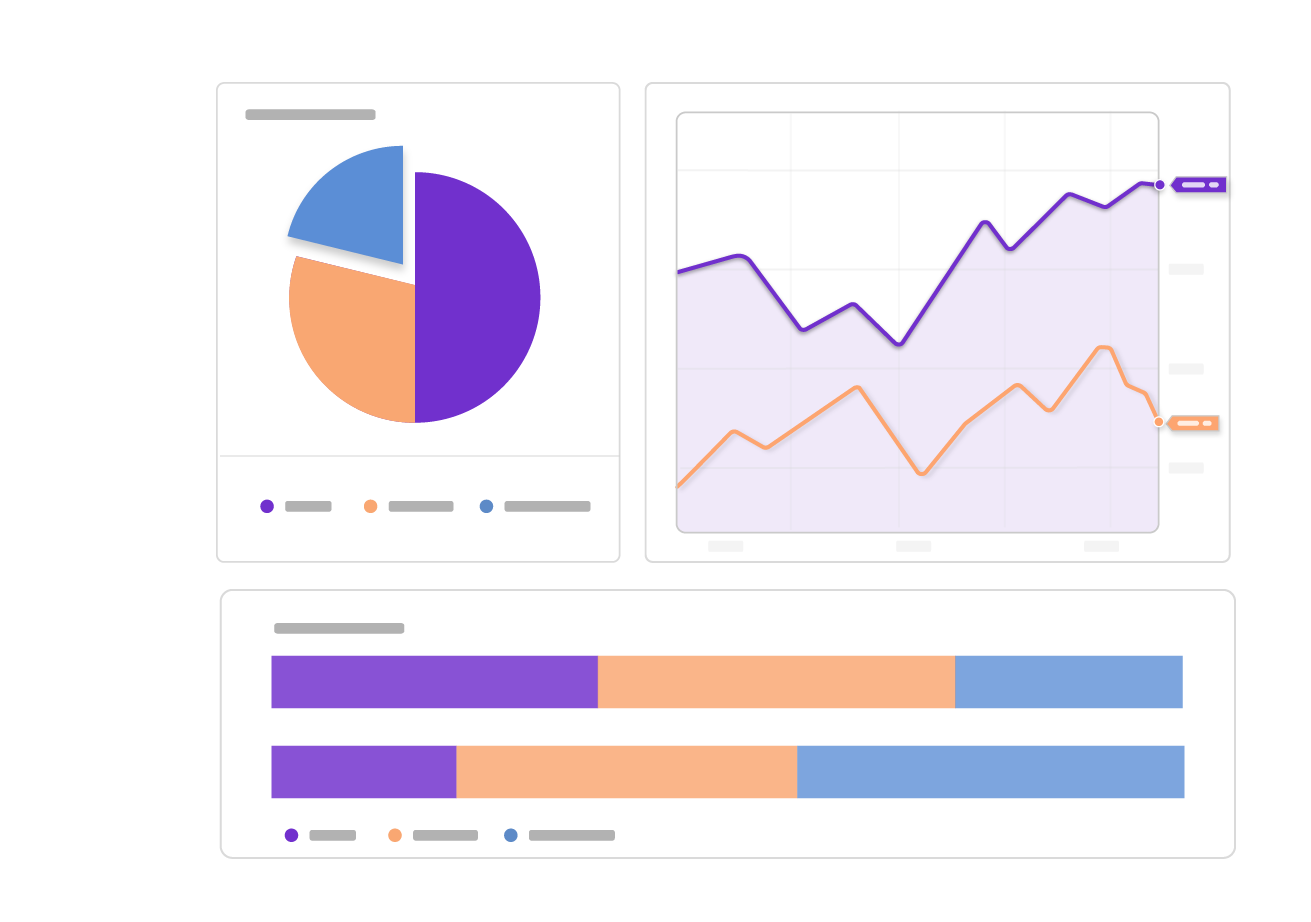
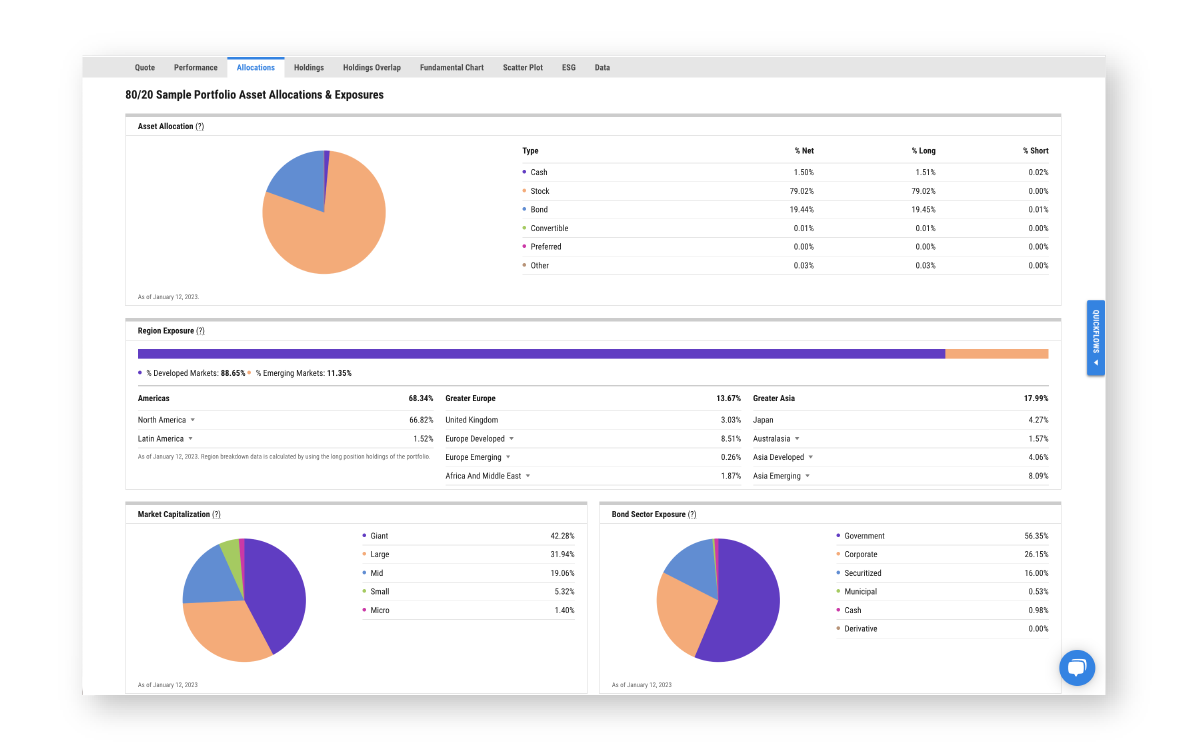
Use visuals to educate clients and prospects on concepts like performance, risk, holdings overlaps, attribution analysis, transition analysis, and exposures at the portfolio level. Build portfolio sleeves and blended benchmarks to pair with your models and further demonstrate the benefits of your strategy.
Compare your strategies to a prospect’s portfolio
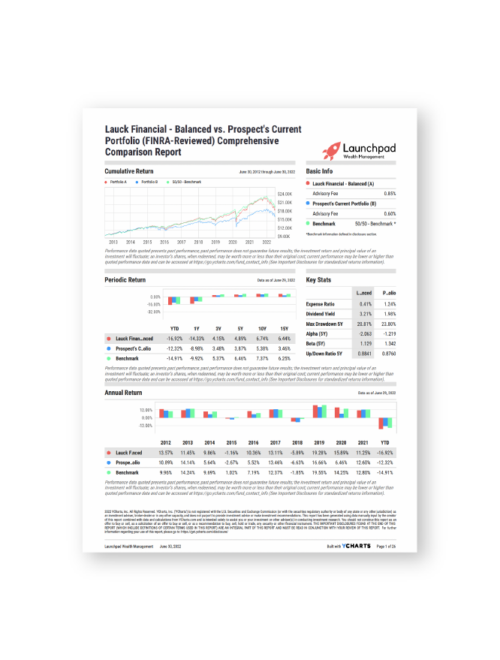
Win more new business with customizable reports that highlight the strengths of your model strategies compared to a prospect’s current portfolio, including FINRA-Reviewed Overview & Comparison reports. Include your firm’s logo, colors and disclosures to deliver a valuable and consistent experience to clients and prospects.
Learn How Portfolios Enhance Client Satisfaction
Manage proprietary strategies and custom benchmarks
Improve your investment committee’s efficiency and ensure every team member can access the latest key metrics with centralized portfolio management. By keeping all your client portfolios, models, and benchmarks under one roof, you’ll gain a holistic view of your investment strategies’ performance.
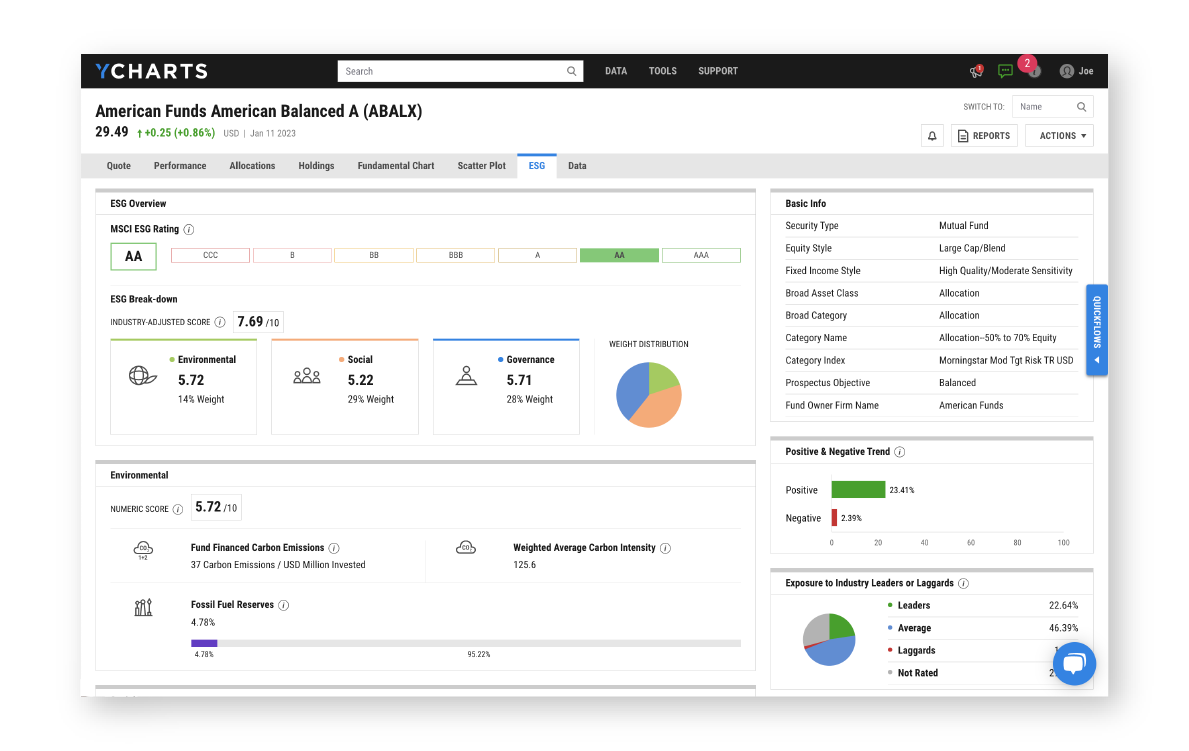
Add a layer of research with ESG Data
Dedicated Environmental, Social, and Governance (ESG) data tabs are available on Portfolio pages. Sourced directly from MSCI, more than 30 ESG data points indicate how well the combined holdings of a portfolio manages its overall ESG risks.
