
Technical Charts
Visualize new investment opportunities.
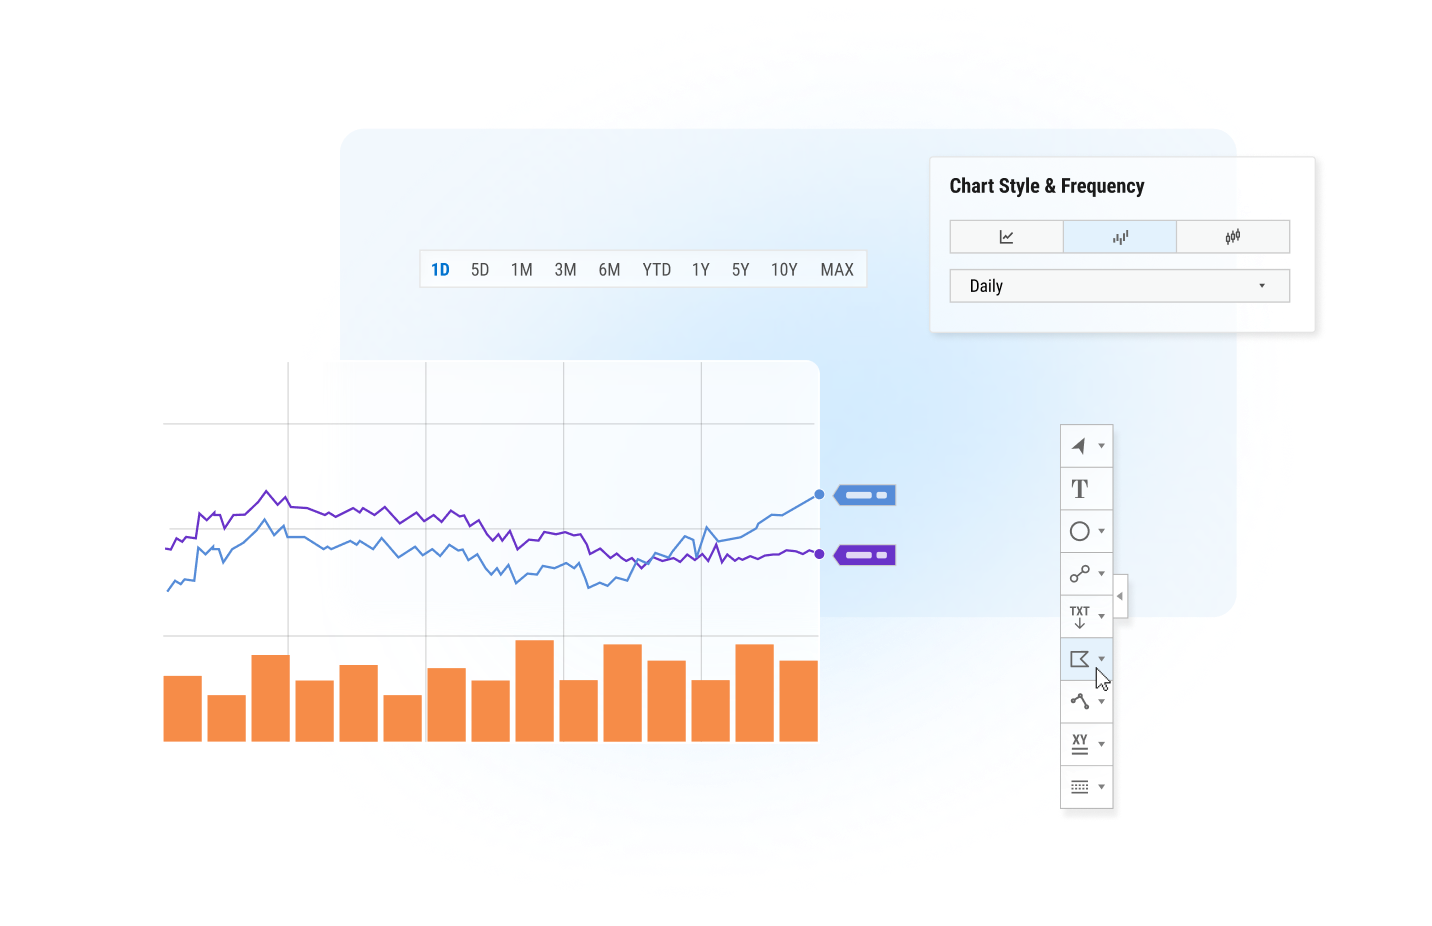
Interactive charting and technical analysis
Uncover technical insights and present them in real-time. Technical Charts makes it possible to answer any questions in the room with an interactive cursor mode, calendar date range selector, intuitive search bar functionality, and easy on/off toggling of technical indicators. Engage and enlighten colleagues about your findings with Technical Charts to turn ideas into actions on the spot.
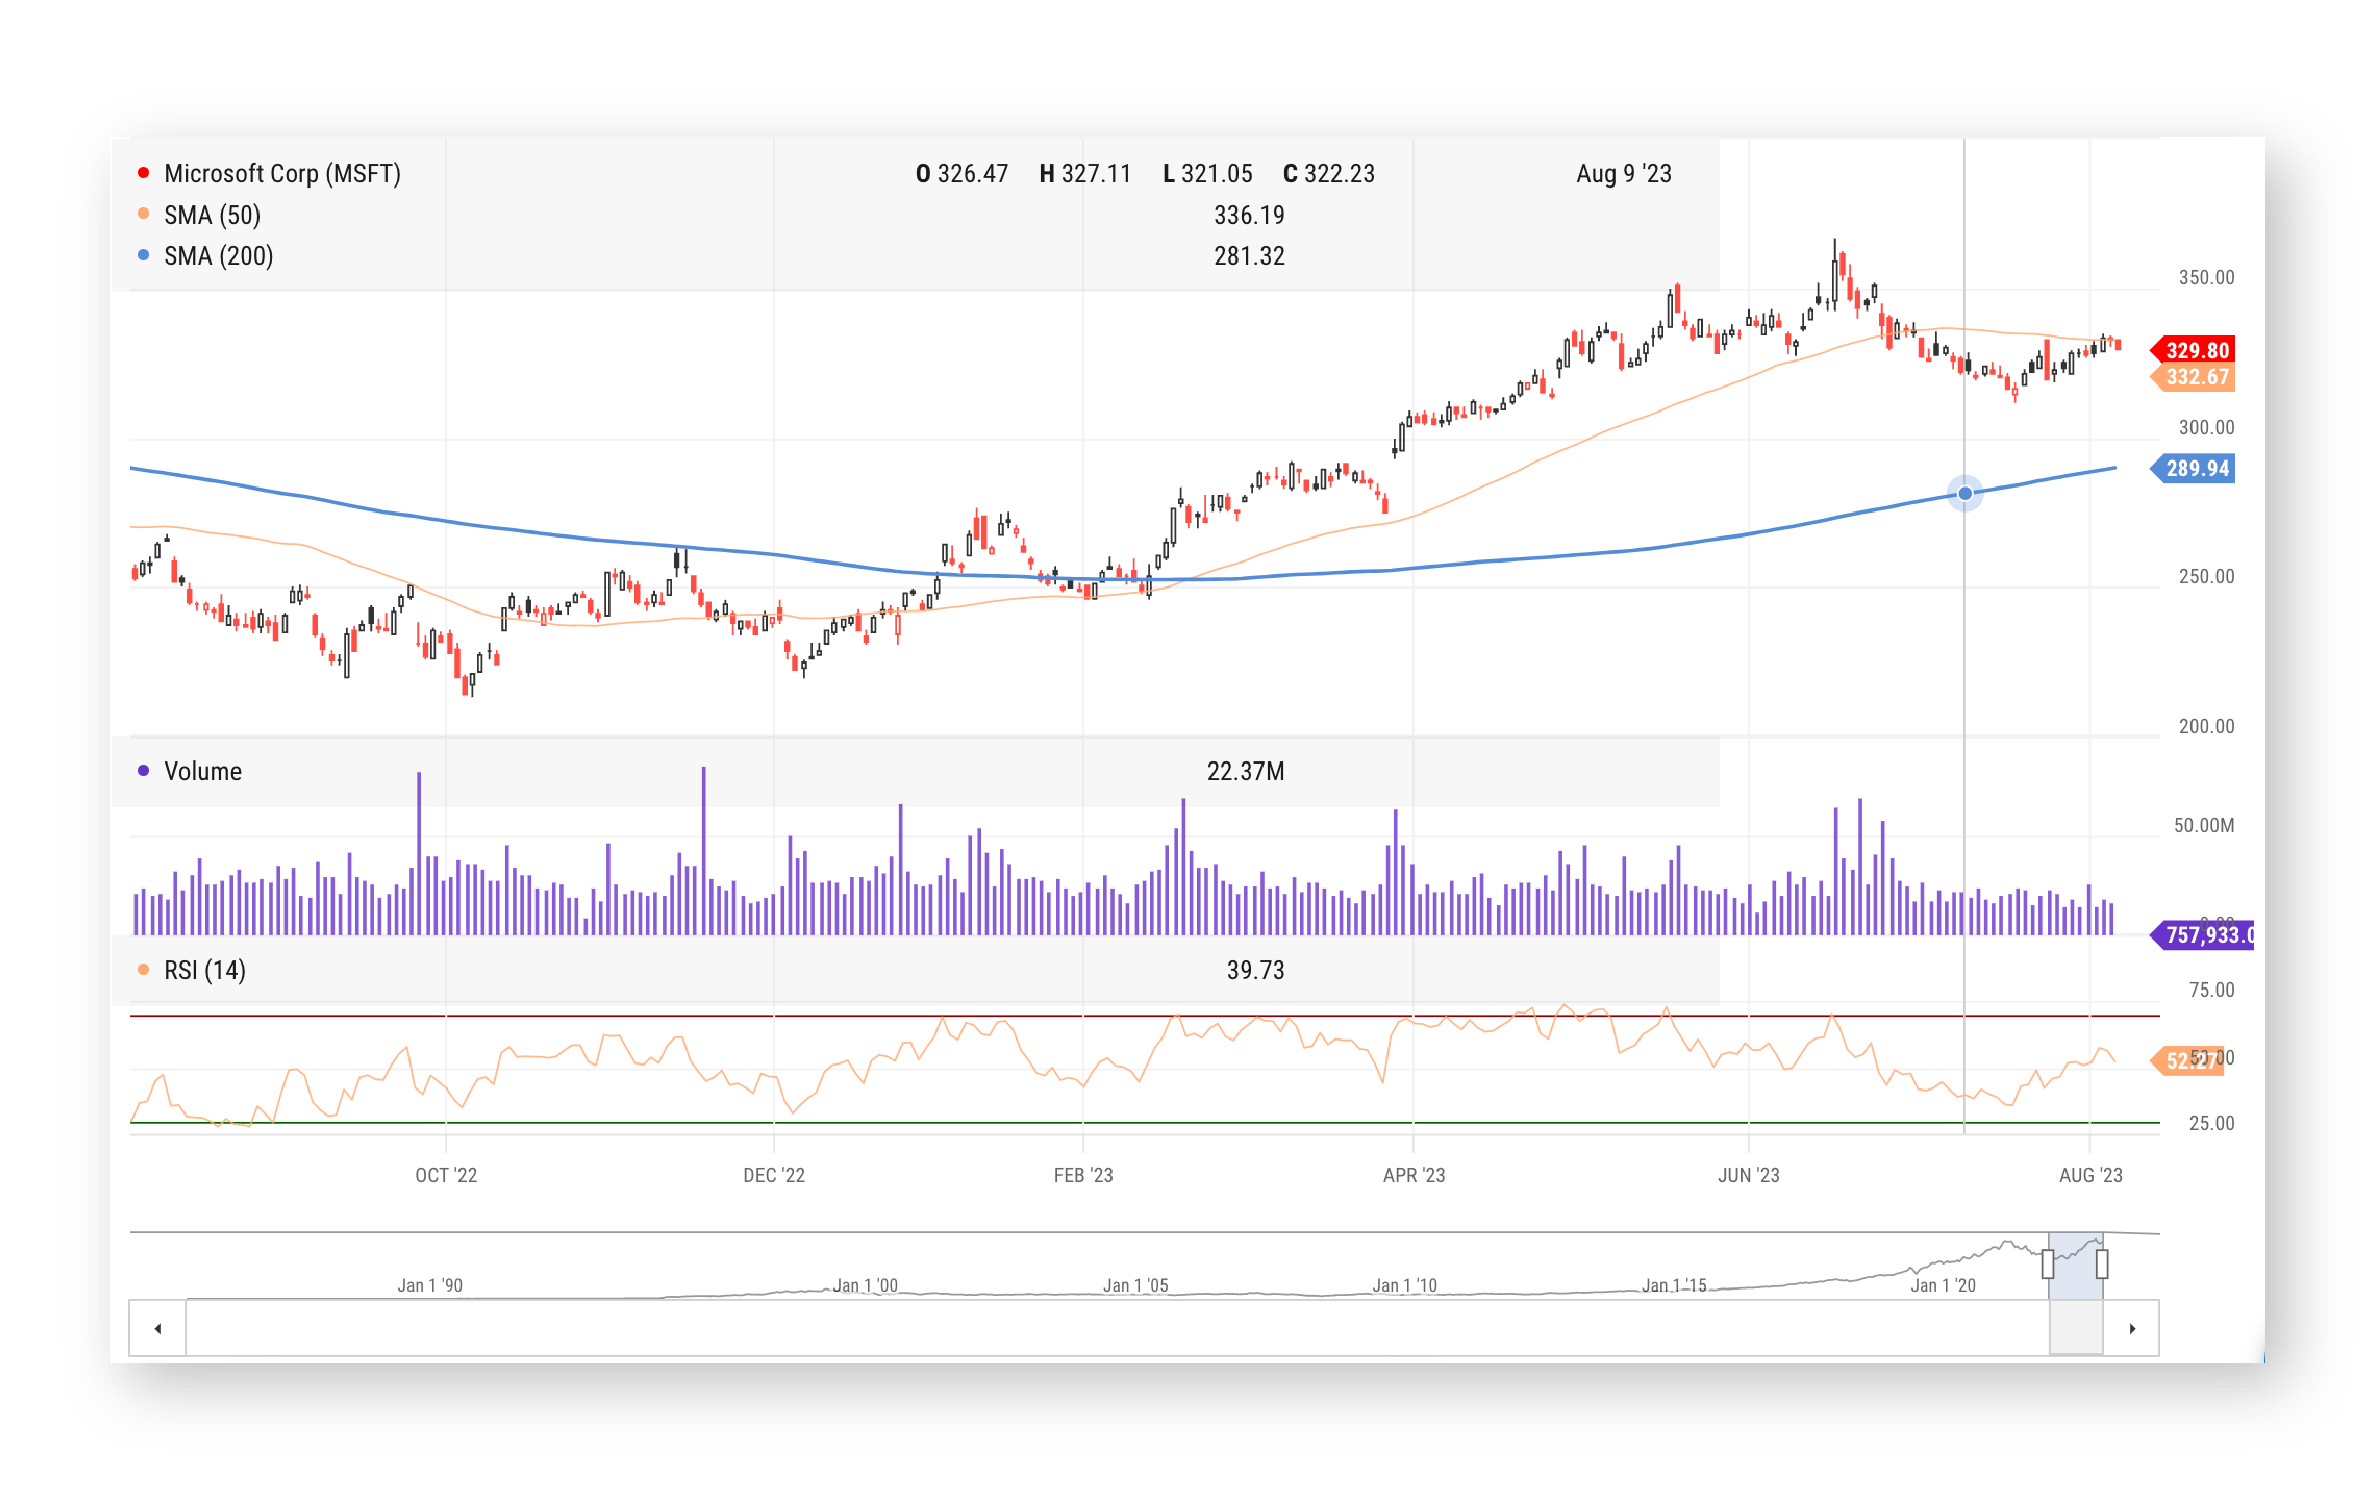
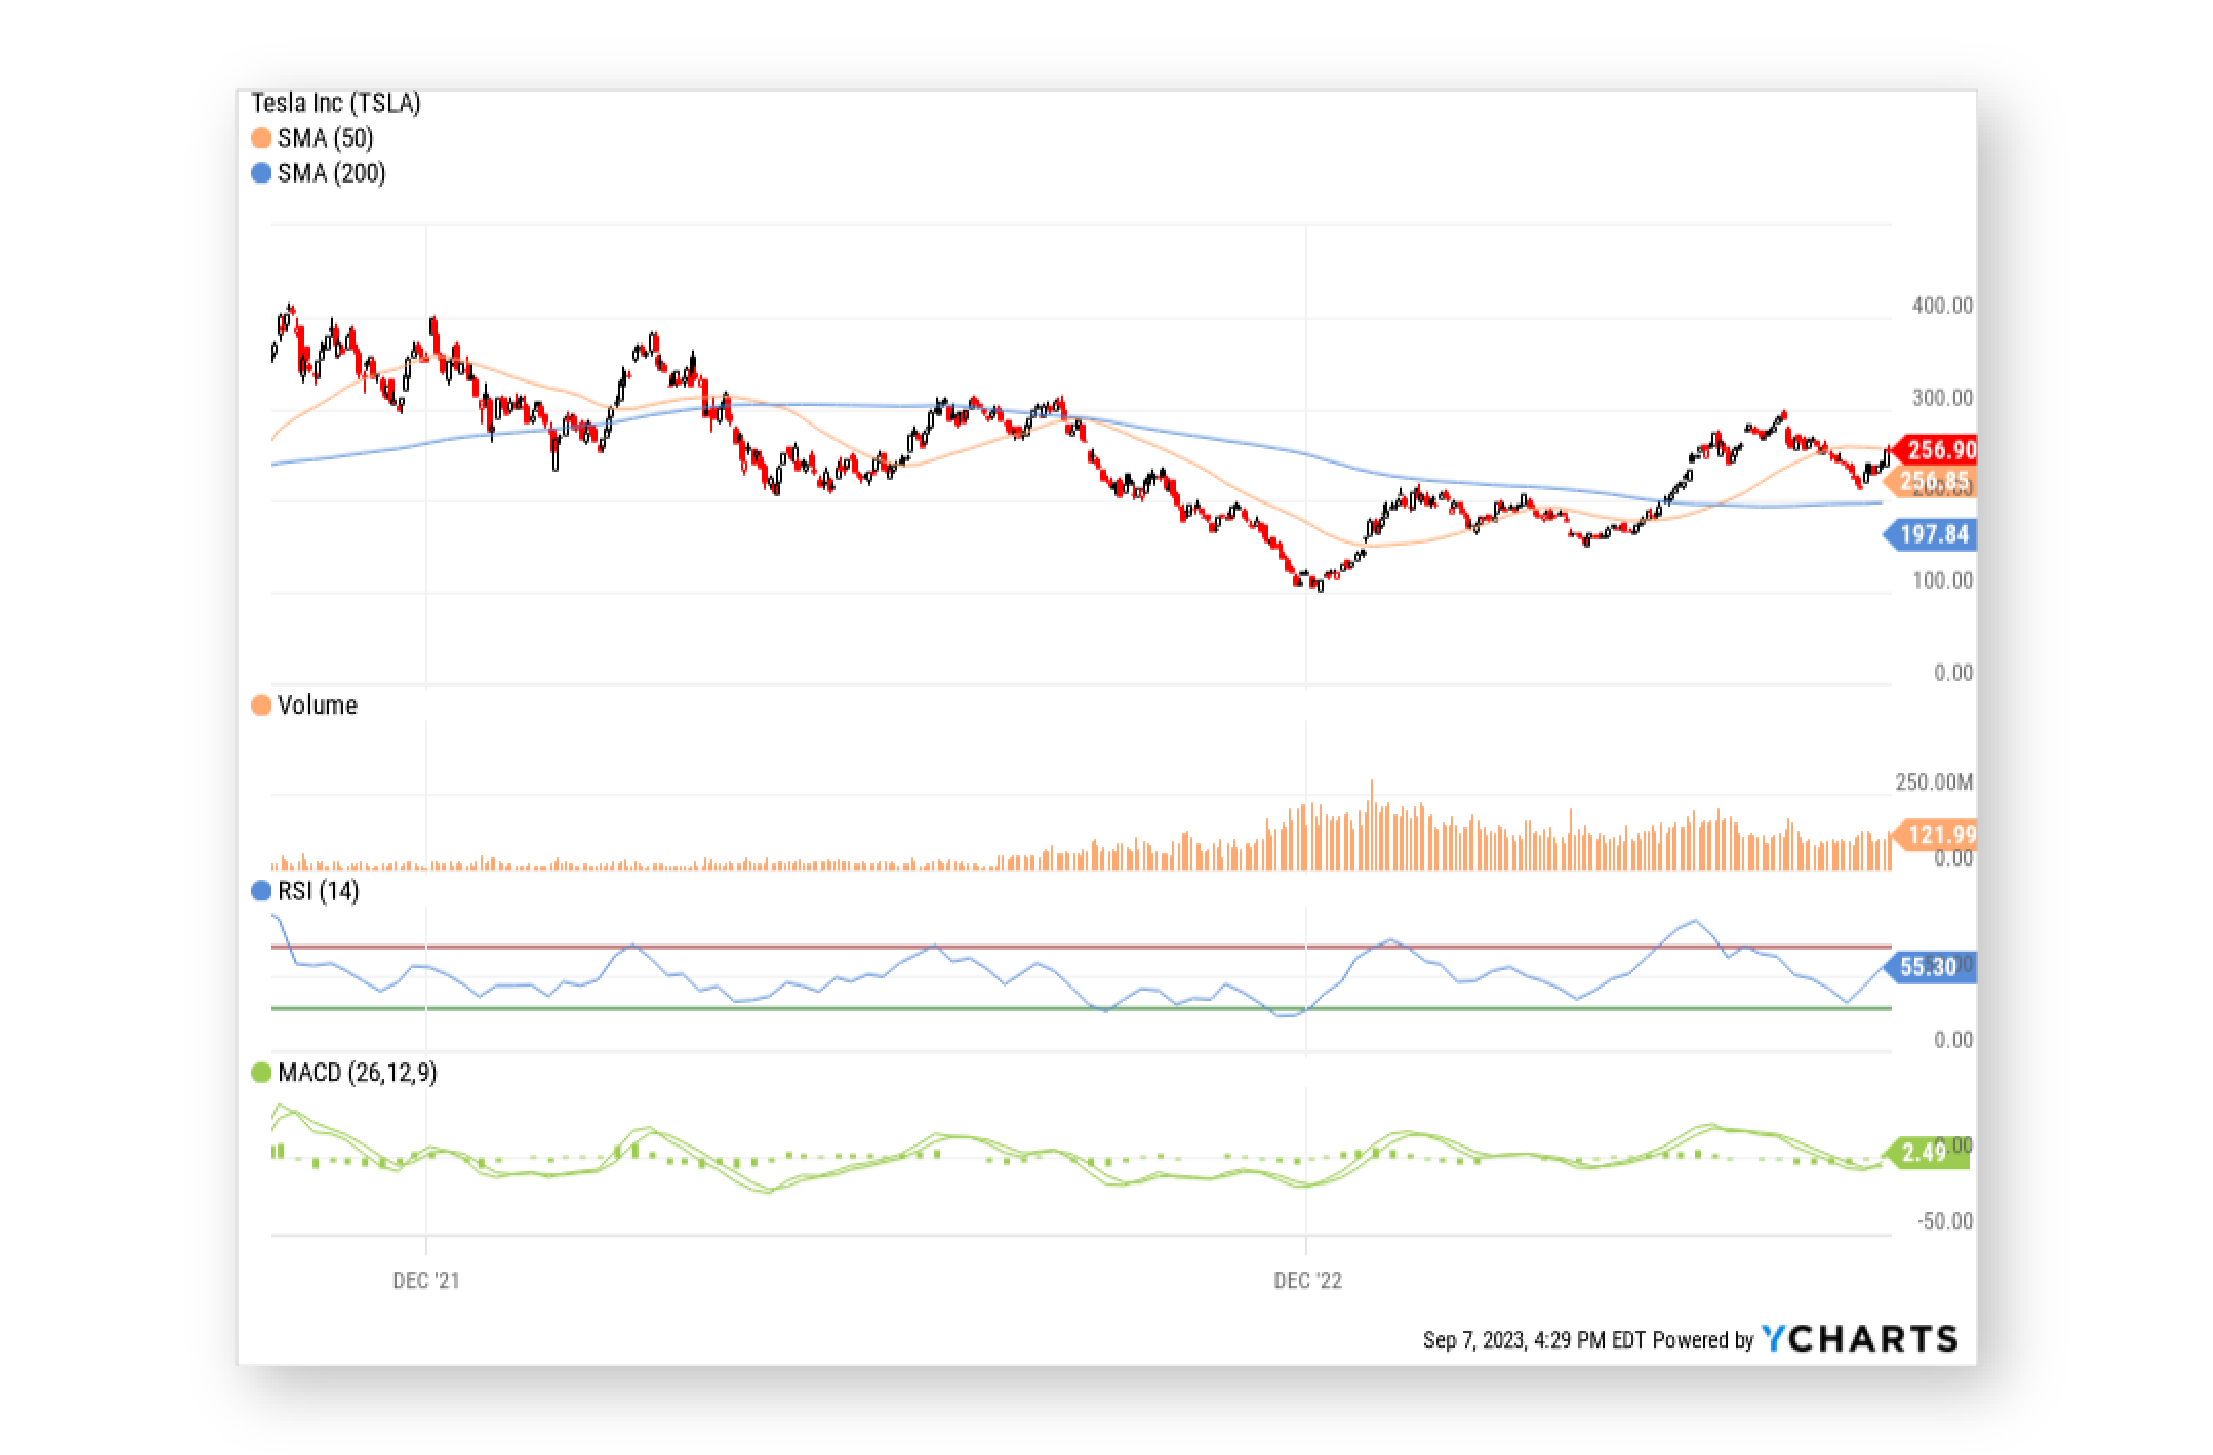
Technical indicators for every type of analyst
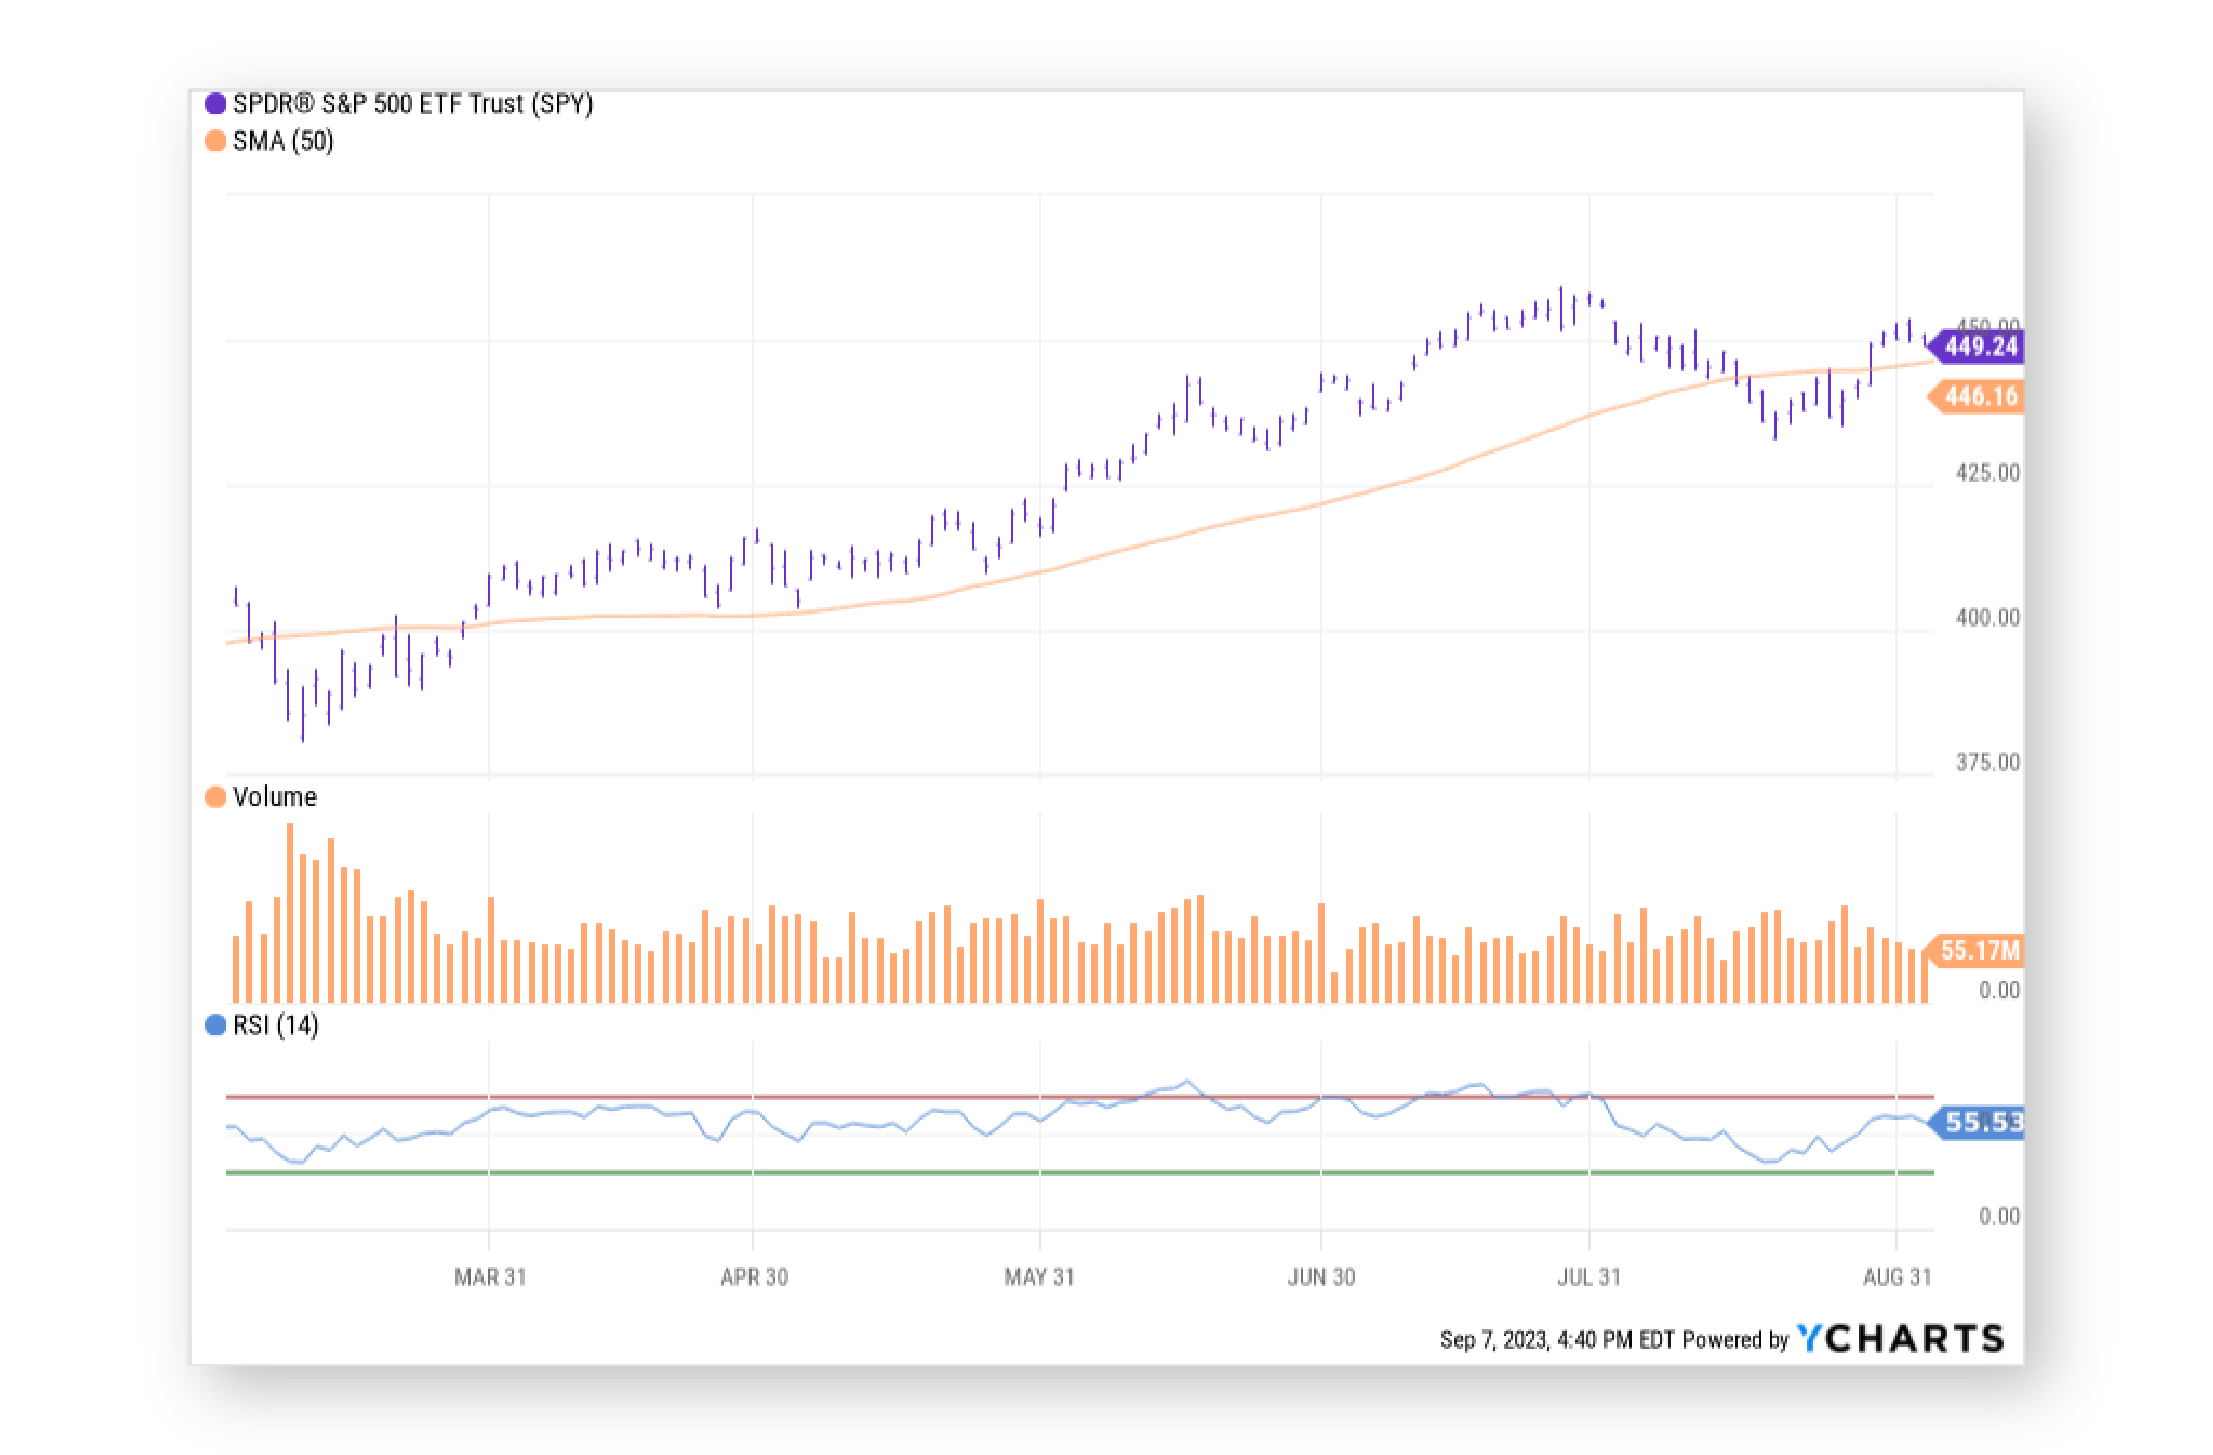
Technical Charts supports 30 different overlays and oscillators, including Simple Moving Average (SMA), Exponential Moving Average (EMA), MACD, Relative Strength Index (RSI), Momentum Oscillator and more. These technical indicators along with Line, Open-high-low-close, and Candlestick formats can be easily applied to any of YCharts’ 30,000+ equities, ETFs, and indices to illustrate the full breadth of your investment analysis.
See Technical Charts in Action
Save & share capabilities for offline analysis
Revisit those “aha!” ideas by saving Technical Charts to your YCharts account and coming back to them later. Want to send something of interest over to colleagues? The Share feature allows you to share saved charts with members of your team. Charts can also be downloaded as PNG images, perfect for attaching to emails or within a slide deck for an upcoming client meeting.
![]()