2025 Fixed Income ETF Market Share Recap
In a record-breaking year for ETF launches (along with flows and trading volume), fixed income was at the center of that momentum. As rates normalized and volatility re-entered portfolio construction conversations, issuers responded with a wave of new products designed to give allocators more precision across duration, credit, and income objectives.
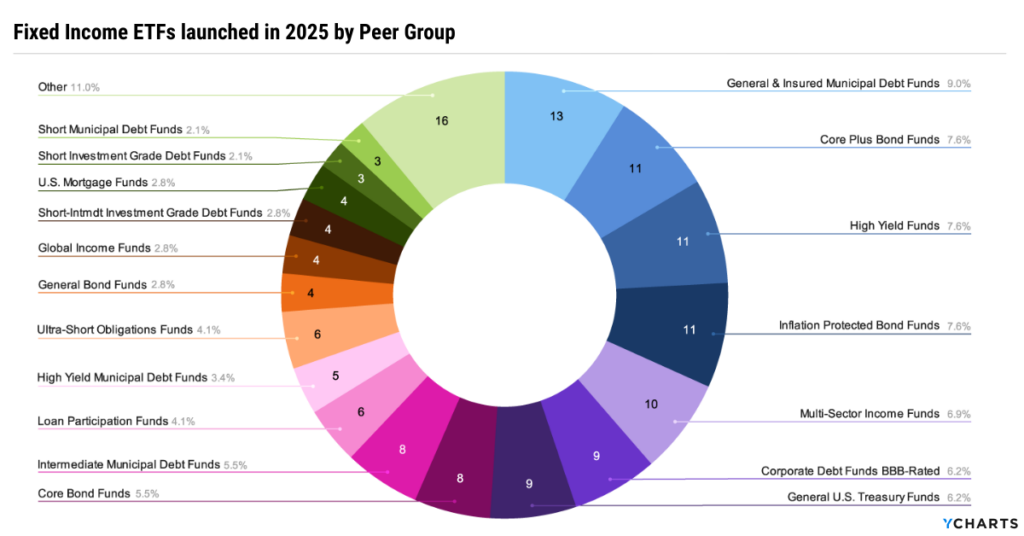
In total, 145 fixed-income ETFs were launched in 2025, reflecting both renewed investor demand and an increasingly sophisticated product ecosystem. General and insured municipal debt strategies led the way with 13 launches, followed closely by core-plus, high-yield, and inflation-protected bond strategies, each seeing 11 new funds. Meanwhile, multi-sector income added another 10 launches to the mix.
Subscribe to the Fund Flow Report
Sign up for our free monthly Fund Flow Report to stay updated on how assets are moving in and out of these strategies:
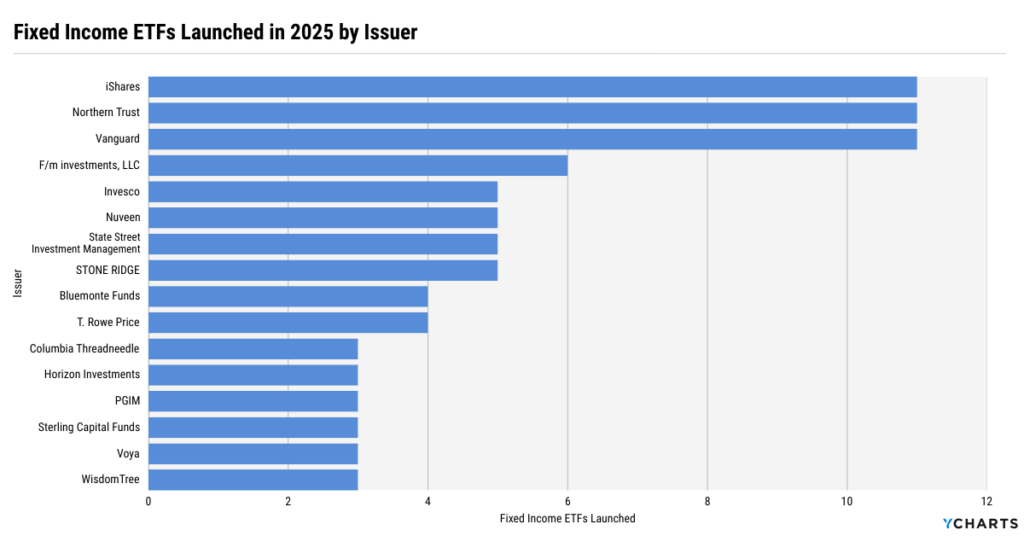
Product leadership was concentrated among the industry’s largest asset managers. iShares, Vanguard, and Northern Trust each introduced 11 fixed income ETFs to the market, with Fidelity close behind with six. Invesco, Nuveen, State Street, and Stone Ridge formed a tight second tier, each launching five new strategies, underscoring the strategic importance of fixed income for ETF issuers.
This surge in innovation coincided with a shifting macro backdrop. A return toward interest-rate “normalcy,” combined with a more globally dovish policy environment, has prompted advisors and institutional allocators to adopt barbell-style fixed income allocations, which blend low-cost passive exposure with actively managed strategies targeting income, flexibility, and risk mitigation (duration, reinvestment, etc.). And with ETF share-class announcements arriving late in 2025, that momentum appears poised to carry into 2026.
Before turning the page on 2025, however, it’s worth taking stock of how the fixed income ETF landscape actually looks today. Below, we break down market-share leaders by AUM across major fixed income peer groups and examine how each segment has evolved over the past three years. These insights show where dominance is being challenged, concentration remains entrenched, and where new winners are emerging.
Reach Out to Add Bond Data to Your AccountTable of Contents
Core Bond ETFs
The Core Bond ETF category grew from $275.8B at the end of 2023 to $414.5B by the end of 2025, reflecting renewed demand for duration exposure as rates normalized. Despite that growth, market share has slightly deconcentrated at the top. Vanguard Total Bond Market Index Fund ETF (BND) and iShares Core US Aggregate Bond ETF (AGG) remain the category anchors, but their combined share declined from nearly 75% in 2023 to under 68% in 2025.
That shift has supported a strengthening second tier. The Vanguard Intermediate-Term Bond Index Fund ETF (BIV) has remained stable near 6.5%, while the Fidelity Total Bond ETF (FBND) has been the clear standout, more than doubling its market share from 2.4% in 2023 to 5.7% in 2025, reflecting growing appetite for modest active flexibility within core allocations.

View the Timeseries in YCharts
Short U.S Treasury ETFs
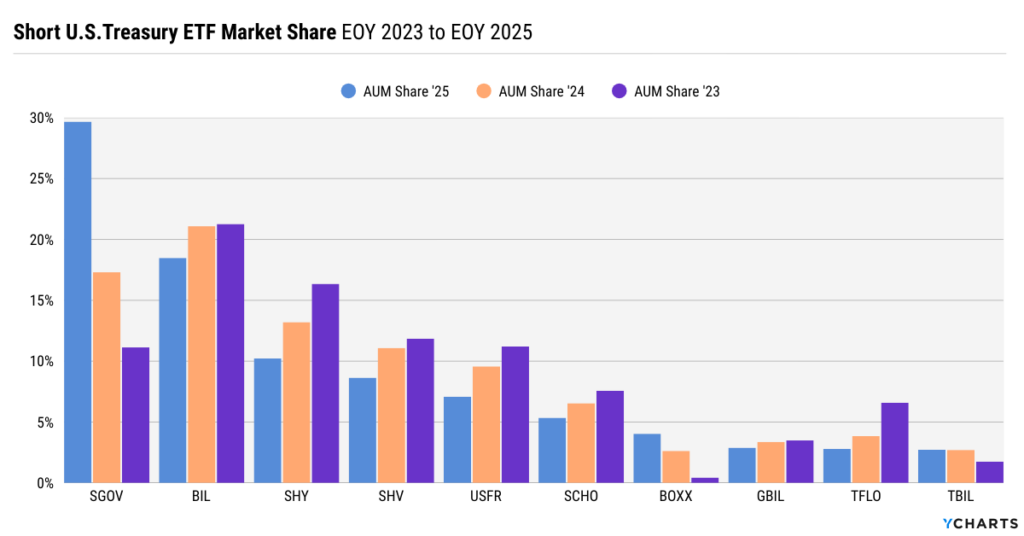
The iShares 0-3 Month Treasury Bond ETF (SGOV) has decisively reshaped leadership within the Short U.S. Treasury ETF category. In 2025, it not only surpassed the State Street SPDR Bloomberg 1-3 Month T-Bill ETF (BIL) to take the top spot but did so convincingly, nearly tripling its market share from 11.1% in 2023 to 29.7% in 2025.
Overall, the Short U.S. Treasury ETF category expanded from $157B at the end of 2023 to $231.1B by the end of 2025, as elevated cash balances and a higher-for-longer rate backdrop kept demand strong for low-duration exposure.
View the Timeseries in YCharts
General U.S Treasury ETFs
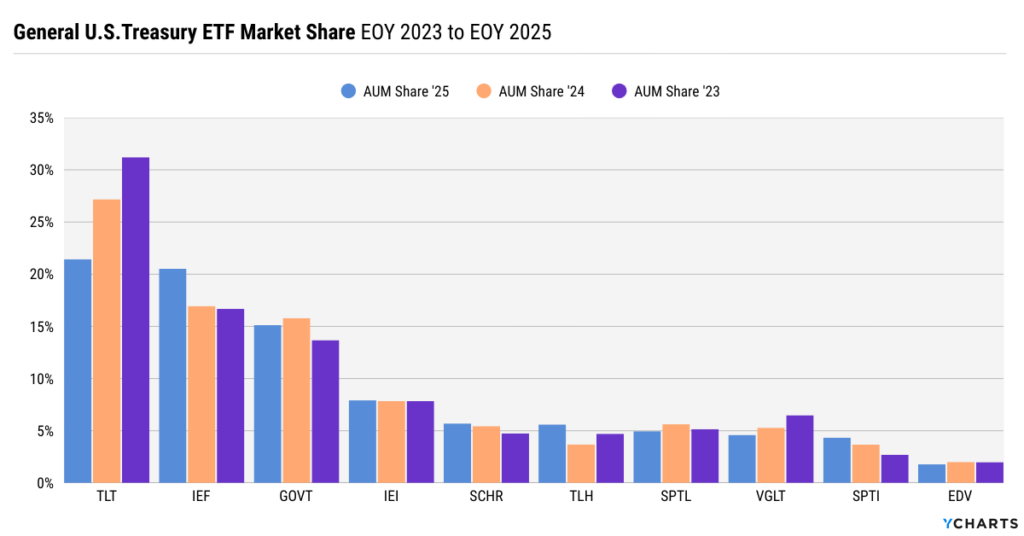
The General U.S. Treasury ETF category expanded from $165.5B at the end of 2023 to $221.4B by year-end, but that growth was accompanied by a clear rebalancing within the peer group. The iShares 7-10 Year Treasury Bond ETF (IEF) has moved into near parity with the iShares 20+ Year Treasury Bond ETF (TLT), rising to 20.5% market share as TLT’s share declined to 21.4%, down sharply from over 31% in 2023.
This convergence highlights a broader shift in allocator behavior, with investors increasingly favoring intermediate-duration exposure over long-duration strategies, emphasizing duration control and risk management within Treasury allocations.
View the Timeseries in YCharts
Corporate Debt Funds BBB-Rated ETFs
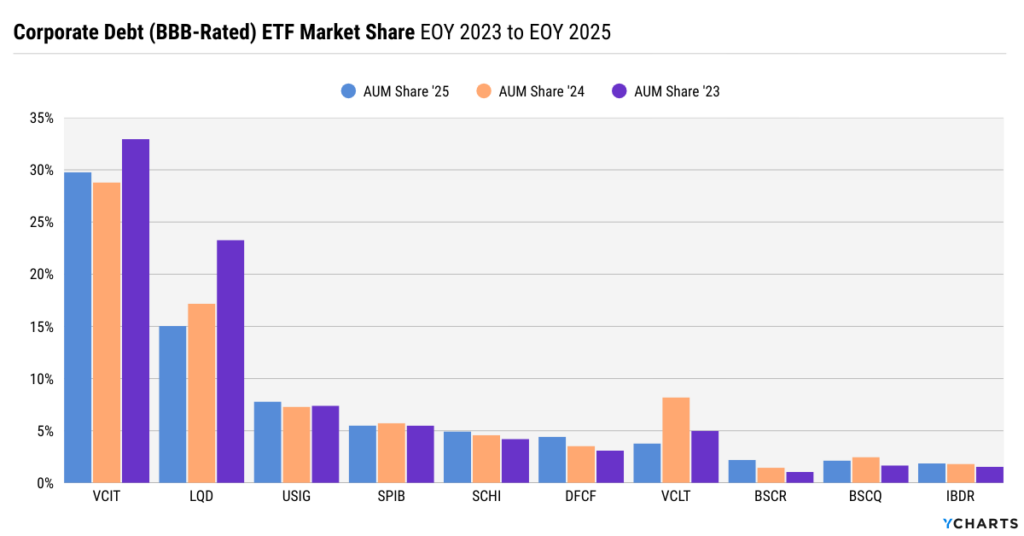
The BBB-rated corporate bond ETF category grew from $136.7B at the end of 2023 to $200B by the end of 2025, reflecting renewed demand for high-quality credit as spreads stabilized and income opportunities improved.
The Vanguard Intermediate-Term Corp Bond Index Fund ETF (VCIT) has consolidated its leadership position, increasing its share to 29.8% in 2025, while the iShares iBoxx $ Investment Grade Corporate Bond ETF (LQD) continued to cede ground, falling to 15%, down from over 23% in 2023. Elsewhere, funds such as USIG, SPIB, and SCHI held or modestly gained share, reinforcing a broader trend toward precision and risk control within investment-grade corporate allocations.
View the Timeseries in YCharts
High Yield ETFs
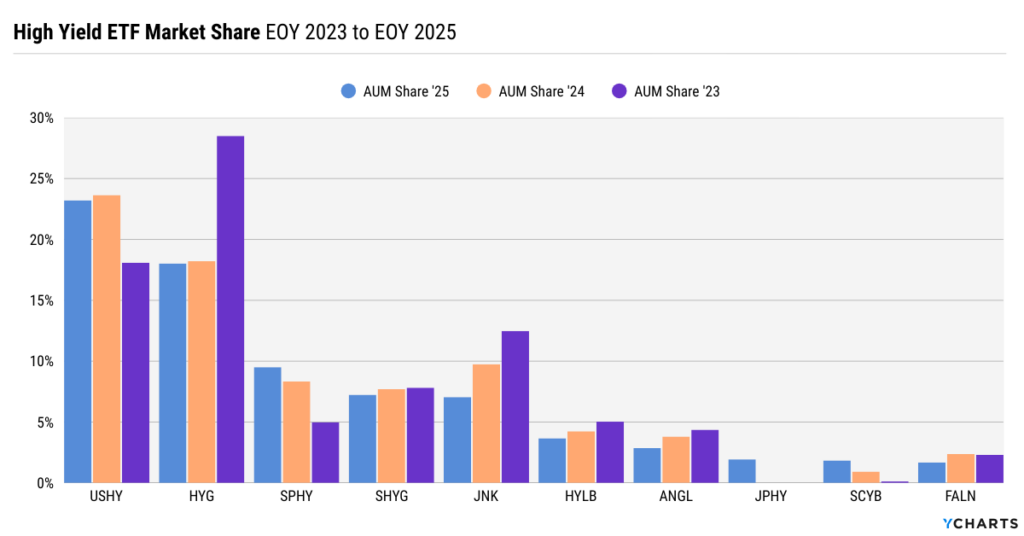
The High Yield ETF category expanded from $66.9B at the end of 2023 to $110B by the end of 2025, as resilient economic growth and contained default expectations supported investor demand for income. That growth, however, coincided with a notable reshuffling of market leadership within the peer group.
The iShares Broad USD High Yield Corporate Bond ETF (USHY) has emerged as the category leader, holding 23.2% market share in 2025, while the iShares iBoxx $ High Yield Corporate Bond ETF (HYG)’s dominance continued to erode, falling to 18%, down sharply from 28.5% in 2023. At the same time, SPHY nearly doubled its share over the period.
View the Timeseries in YCharts
U.S Mortgage ETFs
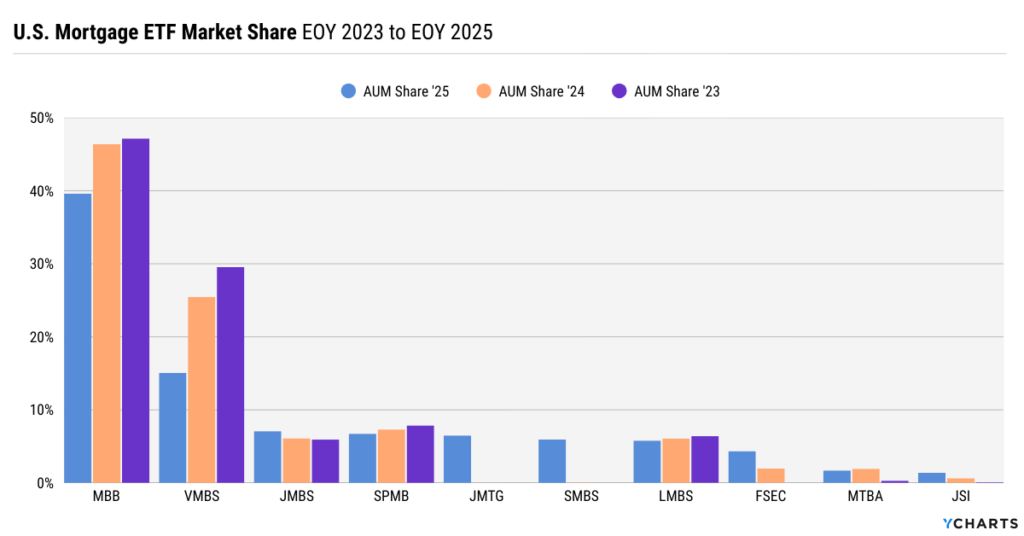
The U.S. Mortgage ETF category has been one of the fastest-growing areas within fixed income, expanding from $60.9B at the end of 2023 to $98.6B by the end of 2025, a high 20% annualized growth rate that reflects renewed confidence in agency MBS as rates stabilized and carry improved.
The iShares MBS ETF (MBB) remains the category anchor, but its share declined to 39.6% in 2025 from over 47% in 2023, while the Vanguard Mortgage-Backed Secs Index Fund ETF (VMBS) saw an even sharper pullback, falling to 15.1%. At the same time, newer entrants such as JMTG and SMBS gained traction.
View the Timeseries in YCharts
Ultra-Short Obligations ETFs
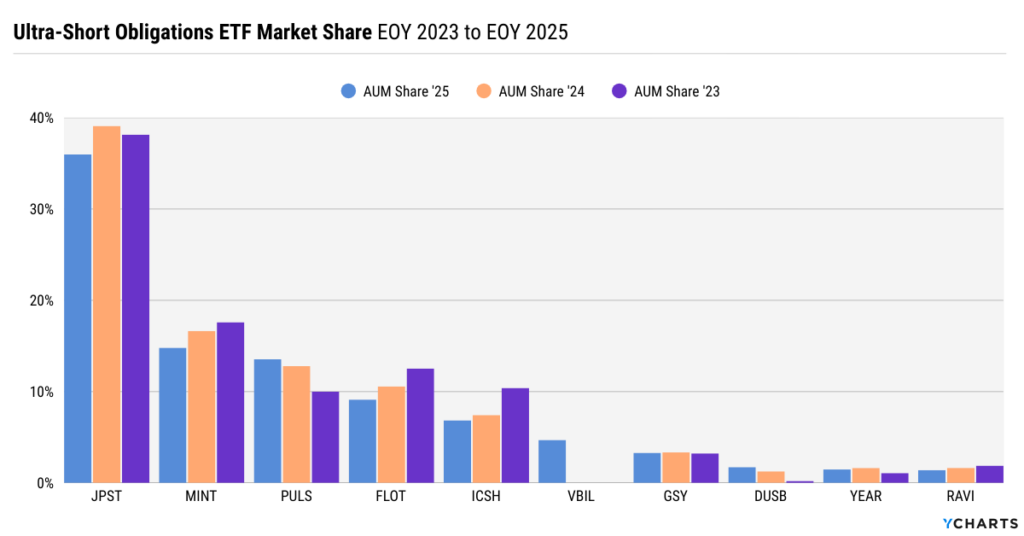
The Ultra-Short Obligations ETF category continued its rapid expansion, growing from $71.5B at the end of 2024 to $98.4B by the end of 2025, a ~38% year-over-year increase, as investors sought yield with minimal interest-rate sensitivity. While the category scaled quickly, leadership at the top became more competitive.
The JPMorgan Ultra-Short Income ETF (JPST) remains the dominant anchor, holding 36% market share in 2025, though its share has gradually declined from prior years. The PIMCO Enhanced Short Maturity Active ETF (MINT) also continued to cede ground, falling to 14.8%, as allocators diversified ultra-short exposure across a broader mix of strategies. The biggest disruption came from the Vanguard 0-3 Month Treasury Bill ETF (VBIL), which captured nearly 5% market share in its first year, underscoring strong demand for new, differentiated cash-management solutions.
View the Timeseries in YCharts
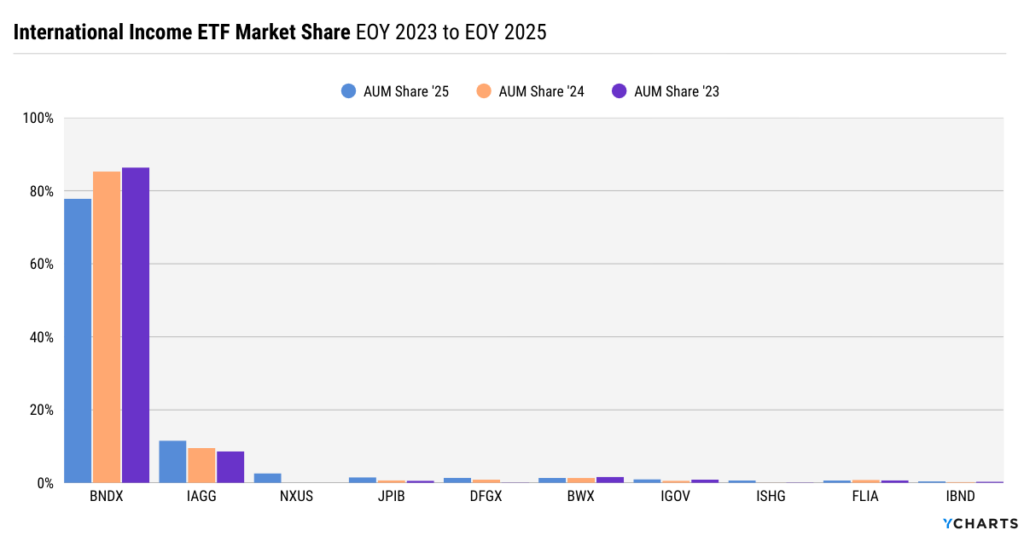
International Income ETFs
The international income ETF space grew 31.4% in 2025 to exceed $95B in assets, but it remains largely a one-fund race. The Vanguard Total International Bond Index Fund ETF (BNDX) continues to dominate the category, representing approximately 78% of total AUM, although its share has declined materially from over 85% in 2024.
The iShares Core International Aggregate Bond ETF (IAGG) has clearly established itself as the number-two option, now accounting for over 11% of category assets. Meanwhile, the Nuveen International Aggregate Bond ETF (NXUS) has quickly taken the third position, capturing nearly 3% of the market share in its first year on the market.
View the Timeseries in YCharts
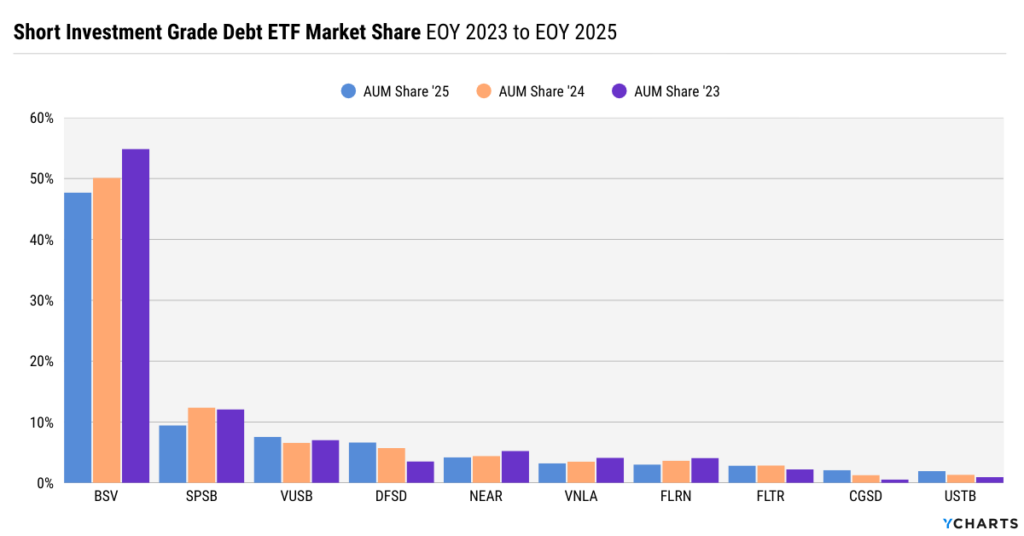
Short Investment Grade Debt ETFs
The Short Investment Grade ETF category grew from $66.7B at the end of 2024 to $88.9B by the end of 2025, a 33% year-over-year increase.
The Vanguard Short-Term Bond Index Fund ETF (BSV) continues to anchor the category, representing 47.7% of AUM in 2025, but its share has declined steadily from nearly 55% in 2023. SPSB also ceded share, while funds such as DFSD and VUSB gained ground, signaling a growing appetite for alternative short-duration credit implementations.
View the Timeseries in YCharts
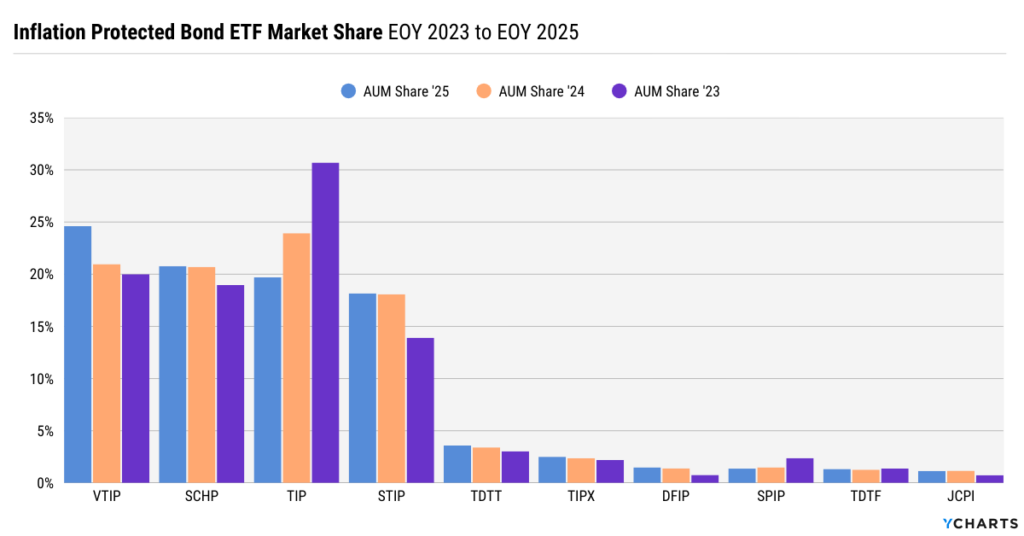
Inflation Protected Bond ETFs
After contracting in 2024, the Inflation-Protected Bond ETF category rebounded in 2025, growing from $57.1B to $70.4B, surpassing its 2023 AUM level of $60.6B as inflation sensitivity re-entered portfolio construction discussions. That recovery, however, was accompanied by a significant reshuffling at the top of the category.
The Vanguard Sht-Term Inflation-Protected Sec Idx ETF (VTIP) has emerged as the new market-share leader, rising to 24.6% in 2025, followed closely by the Schwab US TIPS ETF (SCHP) at 20.8%. Both have overtaken TIP, which fell to 19.7% after holding over 30% market share as recently as 2023.
View the Timeseries in YCharts
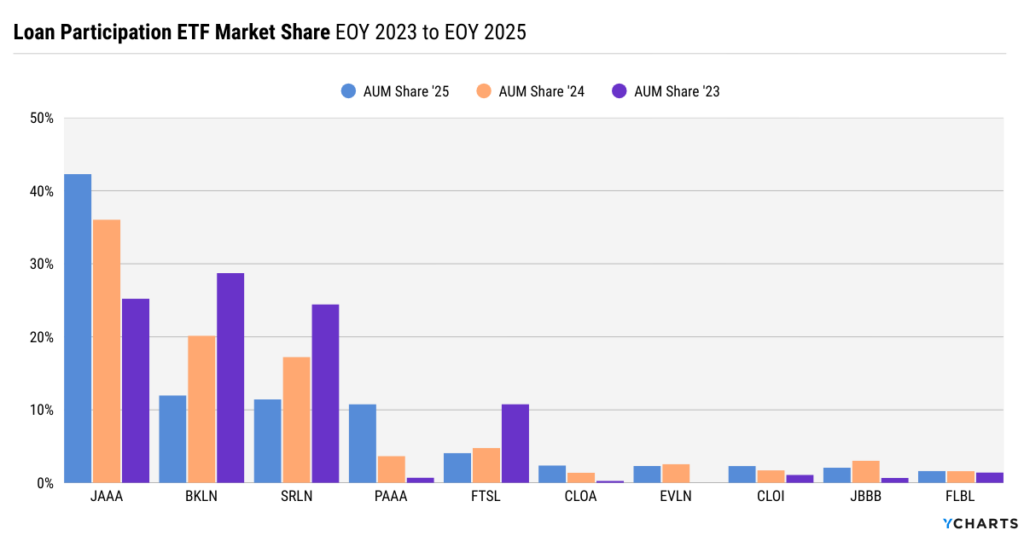
Loan Participation ETFs
The Loan Participation ETF category continued to grow in 2025, expanding from $46.1B at the end of 2024 to $57.5B by year-end, following its breakout year in 2024, when assets more than doubled. While overall growth moderated, market leadership became more concentrated.
The Janus Henderson AAA CLO ETF (JAAA) extended its dominance, increasing its market share to 42.3% in 2025, up from 36.1% the prior year and just 25.2% in 2023. Those gains came largely at the expense of the Invesco Senior Loan ETF (BKLN) and the State Street SPDR Blackstone Senior Loan ETF (SRLN), both of which saw their share decline materially from near 20% to 12% and 11%, respectively. At the same time, the PGIM AAA CLO ETF (PAAA) emerged as a credible challenger, increasing from a sub-4% share in 2024 to nearly 11% in 2025.
View the Timeseries in YCharts
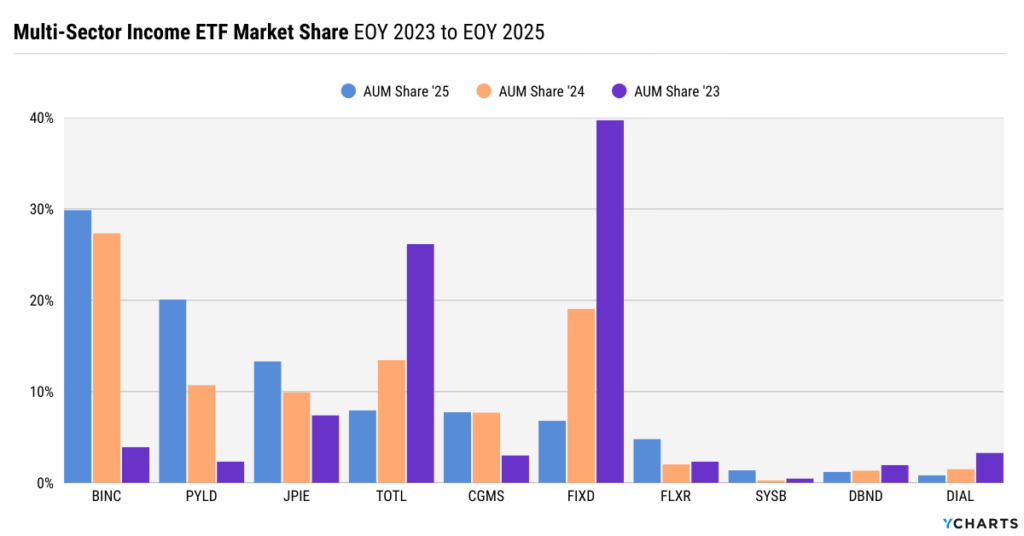
Multi-Sector Income ETFs
The Multi-Sector Income ETF category has doubled in back-to-back years, growing from $12.2B at the end of 2023 to over $50.7B by the end of 2025, making it one of the fastest-growing segments within fixed income.
This rapid expansion reflects one of the clearest areas where active managers have found sustained success within the growing active fixed income ETF ecosystem. As advisors and allocators have increasingly adopted an active/passive barbell approach in fixed income sleeves, they have leaned on the depth and sophistication of large fixed income desks such as iShares/BlackRock, PIMCO, and J.P. Morgan to fill the active allocation.
Within the category, the iShares Flexible Income Active ETF (BINC) has emerged as the clubhouse leader, capturing approximately 30% of total AUM. The PIMCO Multisector Bond Active ETF (PYLD) has followed closely, posting one of the strongest gains in 2025 as its market share climbed from nearly 11% at the end of 2024 to over 20% by year-end.
View the Timeseries in YCharts
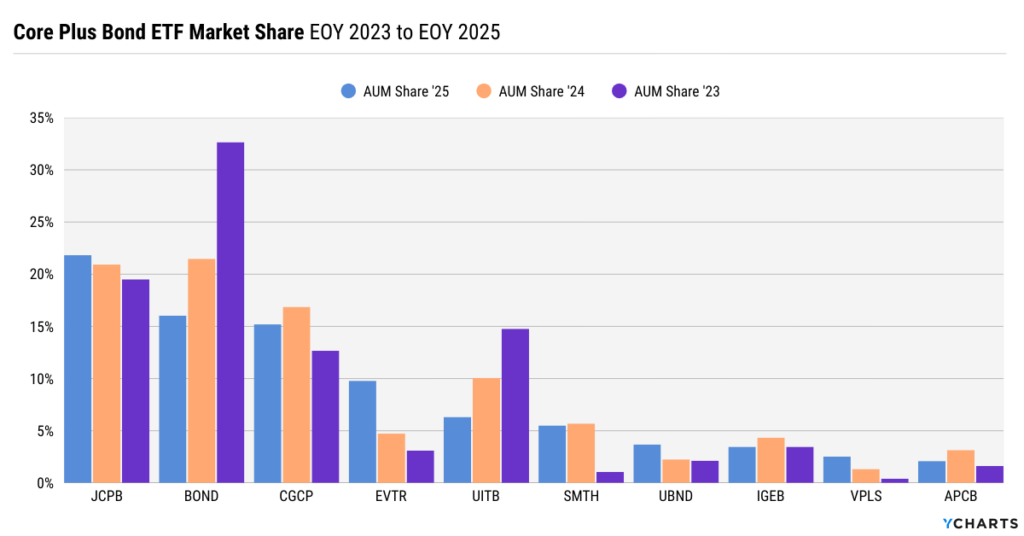
Core Plus Bond ETFs
The Core Plus Bond ETF category continued its rapid expansion in 2025, growing from $23.5B at the end of 2024 to $42.7B by year-end, following a near-doubling the prior year. That growth reflects sustained demand for flexible core allocations as allocators looked to balance income generation with active risk management.
Within the category, the JPMorgan Core Plus Bond ETF (JCPB) has overtaken the PIMCO Active Bond Exchange-Traded Fund (BOND) to become the market-share leader, now representing 1/5 of assets in the category, while BOND’s share has continued to decline, falling to 16% from over 32% in 2023. At the same time, the Eaton Vance Total Return Bond ETF (EVTR) emerged as one of the fastest-growing challengers, more than doubling its share from 4.7% in 2024 to 9.8% in 2025.
View the Timeseries in YCharts
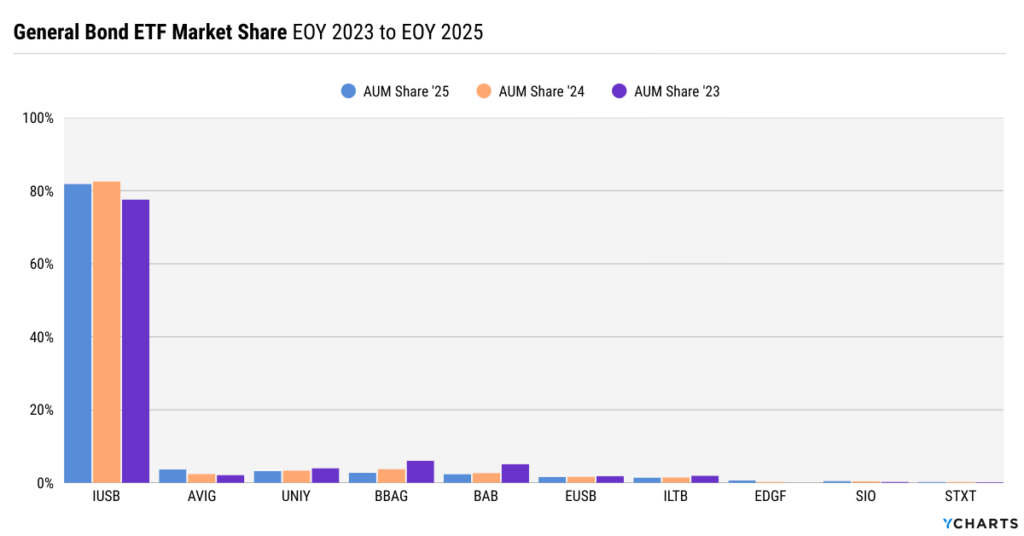
General Bond ETFs
The General Bond ETF category continued to grow in 2025, expanding from $38.5B at the end of 2024 to $42.1B by year-end. Unlike several other fixed income segments, growth in this category has been incremental rather than transformative.
Market leadership remains highly concentrated. the iShares Core Universal USD Bond Market ETF (IUSB) continues to dominate the space, representing nearly 82% of total category AUM, a share that has remained remarkably stable over the past three years. Smaller challengers such as AVIG and UNIY have made modest gains, but the overall structure of the category remains largely unchanged.
View the Timeseries in YCharts
Conclusion
Across every fixed income segment in 2025, market-share shifts reveal a common theme: advisors are demanding more precision, flexibility, and clarity as portfolios adapt to a normalized, but largely dovish, rate environment.
YCharts helps asset managers and distribution teams translate these shifts into clear, data-backed narratives, enabling faster sales cycles and deeper advisor engagement by grounding fixed income conversations in timely market-share trends, peer comparisons, and client-ready visuals that resonate at the point of decision.
Whenever you’re ready, here’s how YCharts can help you:
Book time with our asset management specialists
Sign up for a copy of our Fund Flows Report:
Sign up for our free monthly Fund Flow Report:YCharts offers individual bond data. Curious what’s included? Visit our FAQ page or reach out to add bond data to your account.
Reach Out to Add Bond Data to Your AccountDisclaimer
©2026 YCharts, Inc. All Rights Reserved. YCharts, Inc. (“YCharts”) is not registered with the U.S. Securities and Exchange Commission (or with the securities regulatory authority or body of any state or any other jurisdiction) as an investment adviser, broker-dealer or in any other capacity, and does not purport to provide investment advice or make investment recommendations. This report has been generated through application of the analytical tools and data provided through ycharts.com and is intended solely to assist you or your investment or other adviser(s) in conducting investment research. You should not construe this report as an offer to buy or sell, as a solicitation of an offer to buy or sell, or as a recommendation to buy, sell, hold or trade, any security or other financial instrument. For further information regarding your use of this report, please go to: ycharts.com/about/disclosure
Next Article
Monthly Market Wrap: December 2025Read More →