
5 Ways Advisors Are Using AI Across YCharts

Advisors are expected to deliver personalized insight quickly and clearly. From meeting prep to client follow-ups to market analysis, every task benefits from smarter tools and fewer roadblocks.
That’s why AI is woven into every corner of YCharts, with a range of purpose-built tools and Y, our AI agent, at the center. Together, they help you save time, enhance communication, and surface insights so you can deliver more value, faster.
What sets Y apart is how it works within YCharts. It can see the page you’re on, read the portfolio in front of you, and act on what it finds. Let Y execute tasks, build deliverables, and run reports on a schedule so you can focus on clients while it works in the background.
Here are five ways advisors are putting AI to work across the platform, and how you can put these tools to work today.
1. Surface insights and create content on demand
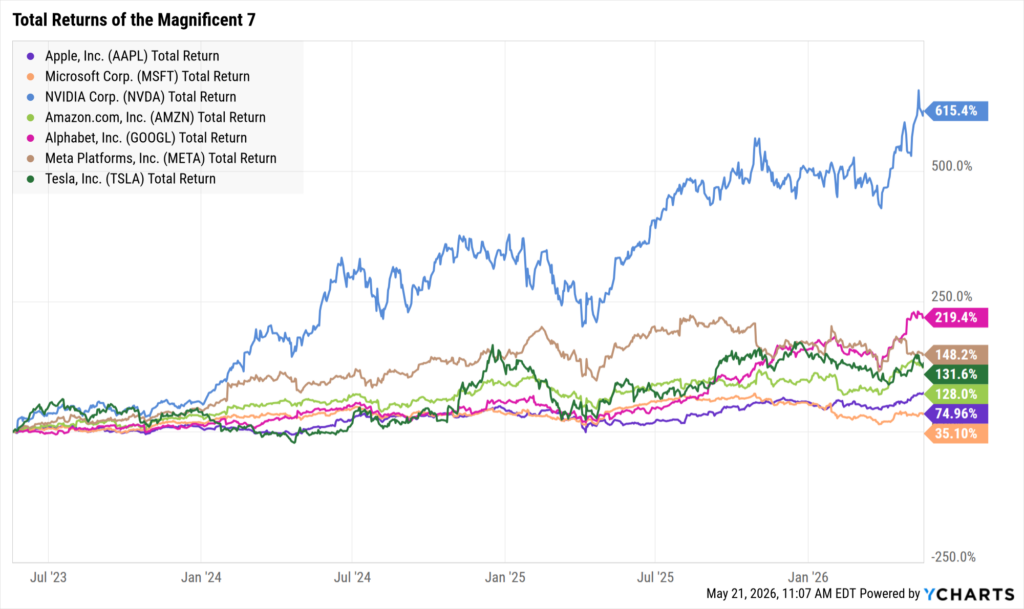
From charts to market data to draft client commentary, Y brings the information you need into your workflow without the manual legwork. Describe what you need and Y builds it, linking to any chart directly in Fundamental Charts for further customization or sharing.
Example prompts:
• “Build me a chart of the Magnificent 7 Stocks over the last 3 years.”
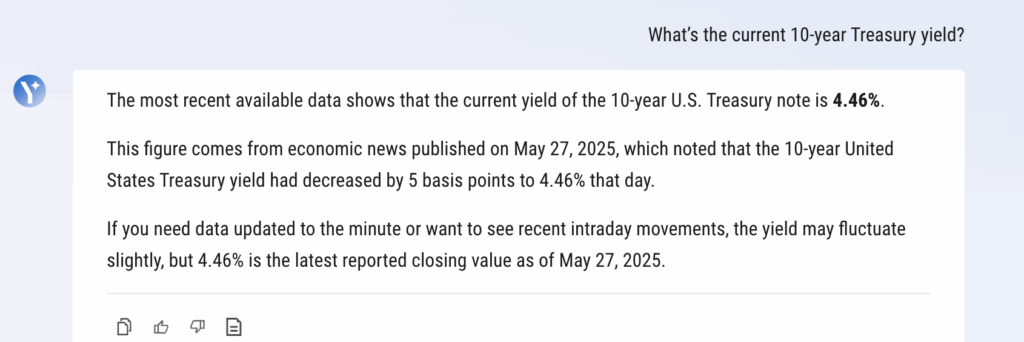
• “What’s the current 10-year Treasury yield?”
• “Write a 150-word summary highlighting current market risks and opportunities.”
Y is available from any page in YCharts via the sparkle icon in the right side rail, so you never have to leave your workflow.
2. Compare investment options with Smart Compare
Comparing investment options is a major part of portfolio construction, but it doesn’t have to be a major part of your workload. With Smart Compare, select the securities you want to evaluate and Y immediately returns relevant metrics and analysis.
Results are presented clearly, with supporting visuals and charts available directly within the same conversation.
Use it to:
• Quickly evaluate multiple securities side by side
• Access key comparison metrics without manual research
• Provide clients and prospects with timely, data-backed answers
Example prompt:
• “Compare SCHD and VYM on yield, expense ratio, and 5-year return.”
Spend less time pulling data and more time having the conversation.
3. Model long-term scenarios with Fast Track
Building long-term scenarios is essential for illustrating financial plans and setting client expectations. With Fast Track, describe a scenario in plain language and receive a fully modeled outcome with supporting visuals and data in seconds.
You can ask follow-up questions to refine assumptions or explore alternative outcomes without starting over.
Example prompts:
• “Create a scenario starting 25 years ago with a $25,000 initial investment in SPY. Add contributions of $500 per month until year 18, then withdraw $25,000 per year for four years to cover tuition.”
• “Start a scenario 30 years ago with a $1,000,000 investment in SPY. Beginning in year six, withdraw $60,000 per year and increase that withdrawal by 2% annually for inflation.”
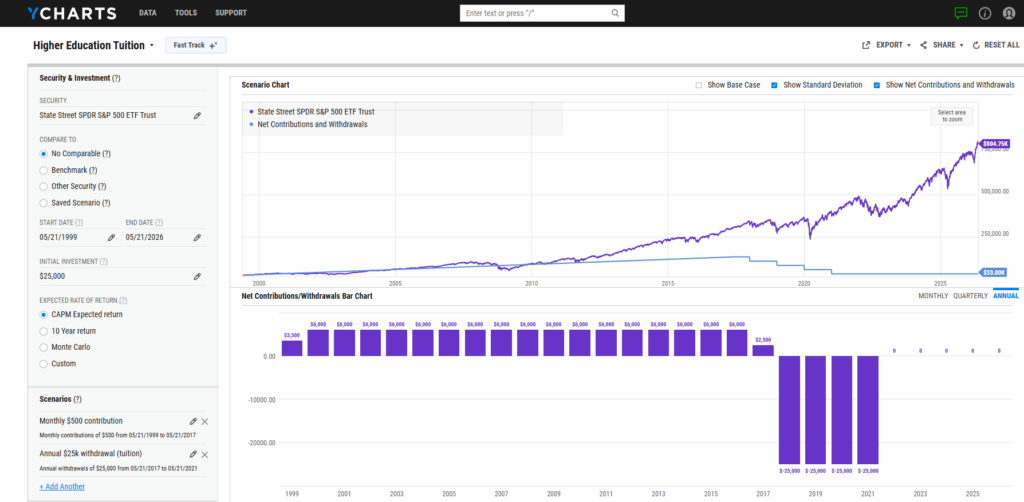
Complex planning conversations become a lot more straightforward when the model is already built.
4. Turn client documents into portfolios
With Quick Extract, you can turn client documents such as account statements, brokerage PDFs, or screenshots into fully functional portfolios in YCharts. Once uploaded, the portfolio is ready for performance tracking, benchmarking, and analysis.
This streamlines onboarding and review workflows, especially when working with held-away assets or across multiple custodians.
Use it to:
• Eliminate manual data entry
• Build shareable, data-rich portfolios
• Support personalized conversations with real holdings
Advisors say Quick Extract helps them move from static documents to impactful insights in less time.
Reach Out to Add Quick Extract to Your Account5. Stay informed with the AI Market Commentary module
The AI Market Commentary module provides high-level insights into your workflow by highlighting recent market activity, standout performers, and macroeconomic trends. It updates automatically throughout the day every 15 minutes and can be added to any YCharts dashboard.
Use it to:
• Monitor key movements across stocks, sectors, or major market indices
• Stay aligned with broader market developments
• Support client meetings with timely, relevant context
It’s a faster path to context that helps support more informed, timely discussions.
Final Takeaway
AI in YCharts isn’t a separate step. It’s built into the workflows you use every day, from surfacing insights to modeling scenarios to keeping you informed on market movements. Whether you’re preparing for a client meeting or running reports in the background, the tools are ready when you are. The only step left is yours.
Whenever you’re ready, here’s how YCharts can help you:
1. Want to reduce time spent researching stocks, funds, or macro trends?
Explore how Y can accelerate your workflow.
2. Want to test out YCharts for free?
Start a no-risk 7-Day Free Trial.
Disclaimer
©2026 YCharts, Inc. All Rights Reserved. YCharts, Inc. (“YCharts”) is not registered with the U.S. Securities and Exchange Commission (or with the securities regulatory authority or body of any state or any other jurisdiction) as an investment adviser, broker-dealer or in any other capacity, and does not purport to provide investment advice or make investment recommendations. This report has been generated through application of the analytical tools and data provided through ycharts.com and is intended solely to assist you or your investment or other adviser(s) in conducting investment research. You should not construe this report as an offer to buy or sell, as a solicitation of an offer to buy or sell, or as a recommendation to buy, sell, hold or trade, any security or other financial instrument. For further information regarding your use of this report, please go to: ycharts.com/about/disclosure
Next Article
Streamline Portfolio Creation & Analysis with YCharts Quick ExtractRead More →