6 Reasons the Fed Would Hold Rates

Published: September 2, 2025 | Analysis by YCharts Research Team
Following the Federal Open Market Committee’s (FOMC) latest meeting, Fed Chair Jerome Powell emphasized that “we will proceed carefully” in assessing whether further policy adjustments are warranted. This cautious stance represents the inverse perspective from our previous analysis of 6 Reasons That Would Lead to the Fed Cutting Rates. With the federal funds rate at 4.25-4.50%, well above the estimated neutral rate of 2.5%, monetary policy remains firmly restrictive, reaffirming the possibility the fed would hold rates in September.
The case for holding rates steady has strengthened as services inflation proves stubbornly persistent while the broader economy demonstrates remarkable resilience to higher borrowing costs. Understanding what inflation is doing to the market provides crucial context for why the Fed’s focus has shifted from combating recessionary risks to managing persistent price pressures. Financial markets have begun pricing in an extended pause, with futures markets suggesting only a 40% probability of rate cuts before year-end 2025, reflecting growing recognition that the “last mile” of returning inflation to the Fed’s 2.5% target may prove more challenging than anticipated.
| Reason | Current Status | Key Indicator | Supporting Threshold | Probability |
|---|---|---|---|---|
| Persistent Services Inflation | 4.1% (elevated) | Services CPI YoY | >3.5% | High (75%) |
| Resilient Labor Market | 4.2% unemployment | Job Openings/Unemployed | >1.2 ratio | High (70%) |
| Strong Consumer Spending | +3.2% real growth | Retail Sales YoY | >2.5% | Medium (65%) |
| Financial Conditions Easing | Stocks near highs | Financial Conditions Index | <100 (loose) | High (70%) |
| Global Central Bank Divergence | ECB/BOE hawkish | DXY Index | >103 | Medium (60%) |
| Avoiding Policy Whiplash | Recent pivot concerns | Policy Stability | 6-month minimum | Medium (65%) |
|
Powered by
|
||||
Table of Contents
Current Economic Landscape
Understanding the Federal Reserve’s decision-making framework requires a comprehensive examination of the full spectrum of economic indicators that inform monetary policy deliberations. The current economic landscape presents a fascinating study in contrasts, with some metrics suggesting the economy has absorbed higher interest rates remarkably well while others hint at emerging vulnerabilities.
Economic Dashboard (September 2025)
| Indicator | Current Level | 3-Month Trend | 1-Year Ago | Historical Context |
|---|---|---|---|---|
| Fed Funds Rate | 4.25-4.50% | Unchanged | 5.25% | Above neutral (~2.5%) |
| Core PCE Inflation | 2.8% | ↓ Declining | 3.4% | Target: 2.0% |
| Unemployment Rate | 4.2% | ↑ Rising slowly | 3.7% | Full employment: ~4.0% |
| GDP Growth (Q2 2025) | 3.0% | ↑ Accelerating | 2.1% | Trend: ~2.0% |
| 10-Year Treasury | 4.15% | ↓ Declining | 4.65% | Real rate: ~1.35% |
| S&P 500 YTD | +18.5% | ↑ Rising | 3850 | Near all-time highs |
|
Powered by
|
||||
The term structure of interest rates has evolved to reflect a “higher for longer” narrative, with the yield curve recently turning positive after an extended inversion, suggesting markets are beginning to price in a sustainable equilibrium at current policy rates. The 10-Year Treasury yield at 4.23% reflects this new equilibrium, while the 2-Year Treasury remains anchored by Fed policy expectations.
1. Persistent Services Inflation Remains Sticky
While goods inflation has moderated significantly from its pandemic peaks, services inflation continues to run hot, presenting what many economists describe as the “last mile” problem in the Fed’s inflation-fighting journey.
This persistent elevation in services prices reflects fundamental structural factors that prove resistant to monetary policy interventions:
- Tight labor markets continue to drive wage pressures above levels consistent with 2% inflation
- Shelter costs respond to interest rate changes with notorious lags often extending 12-18 months
- Medical care services inflation has shown renewed acceleration after a period of moderation
- Transportation services prices remain elevated as airlines benefit from robust travel demand
The stickiness of services inflation creates a particularly vexing challenge for policymakers because it encompasses roughly 65% of the consumer price index and includes many necessities that households cannot easily substitute or defer.
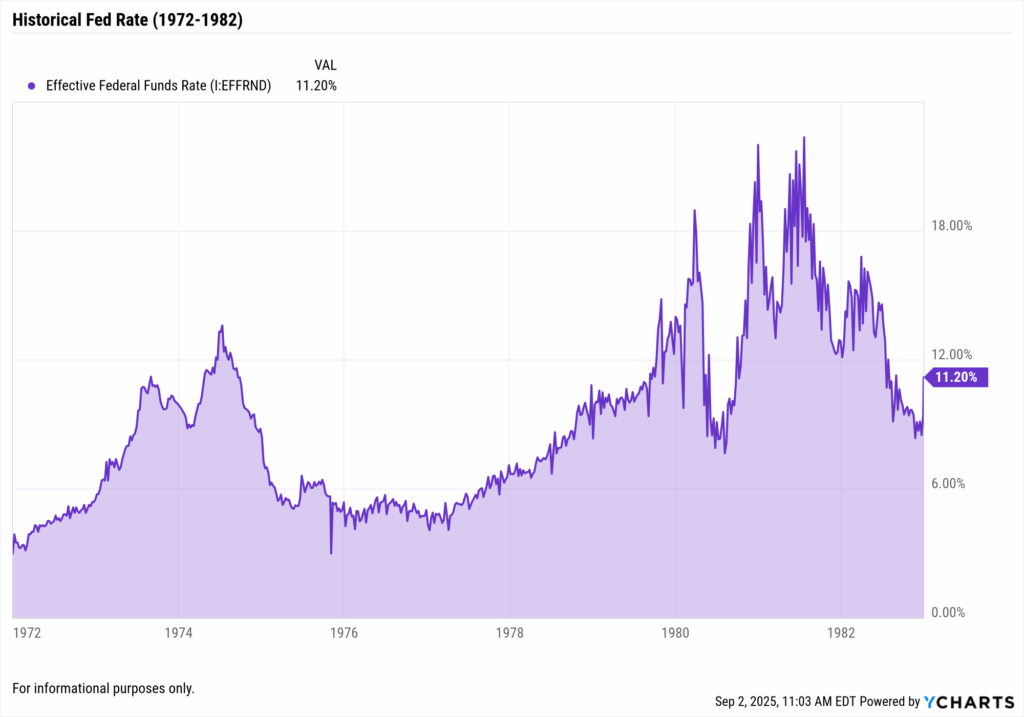
Historical precedent from the 1970s and early 1980s provides a cautionary tale about the dangers of declaring victory over inflation prematurely. During that period, the Fed eased policy multiple times when inflation showed initial signs of moderating, only to see price pressures resurge with greater intensity.
2. Labor Market Shows Mixed Signals But Remains Historically Tight
Despite recent volatility in monthly job creation numbers, the unemployment rate at 4.2% remains near what most economists consider full employment, reflecting an economy that continues to operate with limited slack.
Key Labor Market Indicators
| Labor Market Metric | Current Level | Pre-Pandemic (2019) | Recession Indicator | Assessment |
|---|---|---|---|---|
| Unemployment Rate | 4.2% | 3.7% | >5.5% | Strong |
| Job Openings Ratio | 1.3 | 1.2 | <0.8 | Tight |
| Quits Rate | 2.4% | 2.3% | <1.8% | Confident Workers |
| Wage Growth YoY | 4.3% | 3.0% | <2.0% | Inflationary |
| Prime-Age EPOP | 80.9% | 80.3% | <78% | Very Strong |
| Initial Claims (4-wk avg) | 215,000 | 218,000 | >350,000 | Historically Low |
| Continuing Claims | 1.72 million | 1.75 million | >2.5 million | Below Normal |
|
Powered by
|
||||
While the July 2025 jobs report showed some softening with only 73,000 jobs added and significant downward revisions to prior months, the broader labor market context remains one of relative strength. The unemployment rate has remained in a narrow range between 4.0% and 4.2% for over a year, suggesting stability rather than deterioration.
The persistence of wage pressures across industries suggests fundamental supply-demand imbalances rather than temporary disruptions. This wage pressure appears broadly distributed across sectors, indicating that achieving the labor market softening necessary to bring inflation sustainably to target may require maintaining restrictive policy for longer than markets currently anticipate.
Forward-looking labor market indicators present a mixed picture but don’t yet signal imminent weakness. The quits rate, often interpreted as a measure of worker confidence, remains elevated, indicating employees feel secure enough to voluntarily leave positions in search of better opportunities.
3. Consumer Spending Shows Unexpected Strength
Real consumer spending grew at a robust 3.2% annualized rate in the second quarter of 2025, significantly exceeding economists’ consensus forecast of 2.1% and defying predictions that higher interest rates would meaningfully curtail household consumption.
This resilience reflects multiple supporting factors:
- Elevated pandemic savings for higher-income households continue to support spending
- Strong wage growth has helped maintain purchasing power despite inflation
- Wealth effect from home prices and positive equity returns
- Healthy consumer balance sheets despite some emerging stress points in lower-income segments
The durability of consumer spending poses a particular challenge for monetary policy because it represents roughly 70% of gross domestic product. Current data suggests consumers have adapted to the higher rate environment through various mechanisms.
Travel and leisure spending patterns provide particularly compelling evidence of consumer resilience, with airline passenger volumes exceeding 2019 levels and hotel occupancy rates remaining robust despite significantly higher prices. Restaurant spending continues to grow at a healthy clip, defying predictions that consumers would cut back on dining out as one of the first responses to financial pressure.
This spending strength argues strongly against Fed easing, as adding monetary accommodation to an already robust consumer sector risks reigniting demand-driven inflation. Historical episodes demonstrate that consumer spending momentum, once established, tends to persist until faced with significant negative shocks such as job losses or wealth destruction.
4. Financial Conditions Have Loosened Considerably
Despite the Federal Reserve maintaining the federal funds rate in restrictive territory, broader financial conditions have paradoxically eased considerably over the past six months:
- S&P 500 has gained 8.75% year-to-date despite rate uncertainty
- Credit spreads have compressed to relatively tight levels
- Mortgage rates have declined from recent peaks
- Dollar Index has weakened approximately 10% in 2025
Despite the Federal Reserve maintaining the federal funds rate in restrictive territory at 4.25-4.50%, broader financial conditions have paradoxically eased considerably over the past six months, potentially undermining the transmission of monetary policy. Equity markets have surged with the S&P 500 gaining over 8%, creating a powerful wealth effect that supports consumer spending, while credit spreads have compressed dramatically to just 95 basis points for investment-grade and 320 basis points for high-yield bonds, well below stress levels.
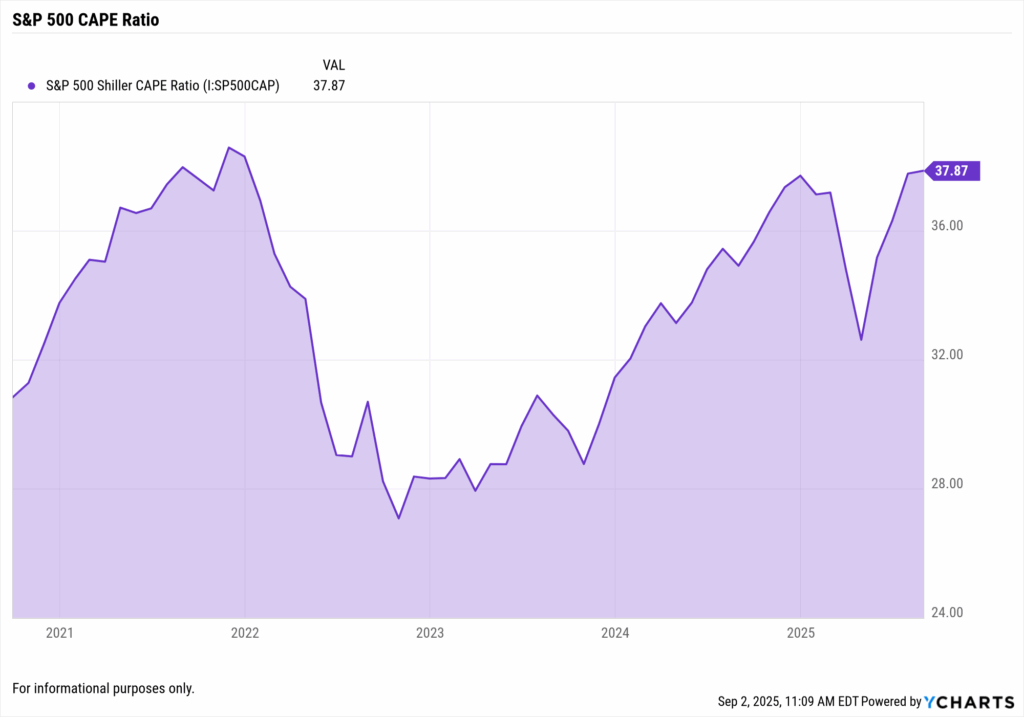
This disconnect presents a significant challenge for the Fed’s efforts to cool the economy and bring inflation back to target, as the traditional channels through which monetary policy operates appear partially blocked by investors’ risk appetite. Corporate bond issuance remains robust, equity valuations have stretched to a forward P/E ratio of 20.5x versus a 10-year average of 17.8x, and companies continue accessing capital easily, all of which work against the Fed’s restrictive stance and argue for maintaining current rates rather than adding further accommodation to already loose financial conditions.
The dollar’s weakening over the past months, with the Dollar Index (DXY) declining approximately 10% in 2025, represents another form of financial condition easing that works against the Fed’s objectives. A weaker dollar makes imports more expensive, potentially adding to inflationary pressures, while also providing a competitive advantage to U.S. exporters that supports economic growth.
5. Global Central Banks Remain Hawkish
The international monetary policy landscape creates significant complications for potential Federal Reserve easing, with major developed market central banks maintaining restrictive policy stances that would make unilateral U.S. rate cuts potentially destabilizing for currency markets.
Global Central Bank Positioning
| Central Bank | Current Rate | Recent Action | 2025 Outlook | Impact on Fed |
|---|---|---|---|---|
| ECB | 4.00% | Hold (July) | 2-3 more hikes possible | Euro strength pressure |
| Bank of England | 5.25% | Hold (August) | Extended pause | Pound stability concerns |
| Bank of Japan | 0.25% | Hiked (July) | Gradual normalization | Yen carry unwind risk |
| Bank of Canada | 4.75% | Hold (July) | Data dependent | North American alignment |
| Reserve Bank of Australia | 4.35% | Hold (August) | Higher for longer | Commodity currency strength |
| Swiss National Bank | 1.75% | Hold (June) | Gradual approach | Safe haven flows |
|
Powered by
|
||||
This global hawkishness creates a complex web of considerations for Fed policymakers who must weigh domestic economic conditions against international spillovers and feedback effects.
Currency market implications of premature Fed easing could prove particularly problematic. With the Dollar Index already down approximately 10% in 2025, a unilateral Fed rate cut while other major central banks maintain restrictive stances could trigger further sharp dollar depreciation, potentially reigniting imported inflation just as domestic price pressures show signs of moderation.
The Bank of Japan’s ongoing policy normalization deserves special attention given the enormous size of Japanese investor holdings of U.S. assets and the potential for significant repatriation flows if interest rate differentials narrow further.
6. Avoiding Policy Whiplash and Credibility Risks
The Federal Reserve’s credibility as an inflation-fighting institution represents one of its most valuable assets, painstakingly rebuilt over decades following the inflation debacles of the 1970s and early 1980s.
Having already suffered reputational damage from initially dismissing inflation as “transitory” in 2021, the Fed cannot afford another policy error that might further undermine market confidence in its commitment to price stability.
Key credibility considerations include:
- Forward guidance consistency – The Fed has emphasized “higher for longer”
- Political independence – Avoiding perception of bowing to political pressure
- Policy optionality – Holding preserves flexibility for future responses
- International confidence – Dollar’s reserve currency status requires prudent policy
The concept of policy optionality argues strongly for patience in the current environment. Cutting rates prematurely limits future policy options if inflation reaccelerates, potentially requiring an embarrassing reversal that would damage credibility.
Historical analysis reveals that central bank credibility, once lost, proves extraordinarily difficult and costly to rebuild. The Volcker Fed’s experience in the early 1980s provides a stark illustration, as interest rates had to reach nearly 20% to convince markets of the Fed’s inflation-fighting resolve after years of stop-and-go policies had destroyed confidence.
Historical Context
Examining previous Fed holding periods provides valuable perspective:
1995-1996: The Fed successfully held rates steady for twelve months, achieving a “soft landing” as the economy gradually cooled without recession.
2006-2007: The Fed maintained 5.25% for over a year while housing excesses built, illustrating the challenges of identifying brewing problems.
2018-2019: The central bank paused for eleven months amid trade war uncertainty before delivering “insurance” cuts, demonstrating evolved communication.
The Bottom Line
The convergence of elevated services inflation, resilient economic growth with Q2 GDP at 3.3%, loosened financial conditions, and global policy dynamics creates a compelling case for the Federal Reserve to maintain its current policy stance.
While market participants may anticipate rate cuts, the evidence presented across six distinct dimensions consistently points toward patience as the optimal strategy, allowing time for previous rate increases to fully transmit through the economy while preserving optionality to respond to future developments.
The next rate cut is coming! See how YCharts can help you prepare:
Follow YCharts Social Media to Unlock More Content!
Disclaimer
©2025 YCharts, Inc. All Rights Reserved. YCharts, Inc. (“YCharts”) is not registered with the U.S. Securities and Exchange Commission (or with the securities regulatory authority or body of any state or any other jurisdiction) as an investment adviser, broker-dealer or in any other capacity, and does not purport to provide investment advice or make investment recommendations. This report has been generated through application of the analytical tools and data provided through ycharts.com and is intended solely to assist you or your investment or other adviser(s) in conducting investment research. You should not construe this report as an offer to buy or sell, as a solicitation of an offer to buy or sell, or as a recommendation to buy, sell, hold or trade, any security or other financial instrument. For further information regarding your use of this report, please go to: ycharts.com/about/disclosure.
Next Article
NVIDIA Q2 Fiscal 2026 Earnings: AI Dominance Continues Despite Export HeadwindsRead More →