
7 Charts Framing the Market Ahead of the September FOMC Meeting
Updated as of: September 12, 2026
The Federal Open Market Committee (FOMC) meets September 15 and 16, and it is the first meeting in years where the market is overwhelmingly expecting a rate hike. The July meeting ended in a 9-3 vote to hold the target range at 3.50% to 3.75%, with all three dissents favoring a quarter-point increase. At Jackson Hole in August, Fed Chair Kevin Warsh said underlying inflation trends had not meaningfully improved.
Advisors heading into client conversations this week are working against a specific backdrop: gas above $4 a gallon, a Middle East supply shock in its seventh month, and a bond market that has repriced sharply since January. The seven charts below frame where the data sits going into Wednesday. All figures are as of the dates noted.
Table of Contents
Retail Gas Prices
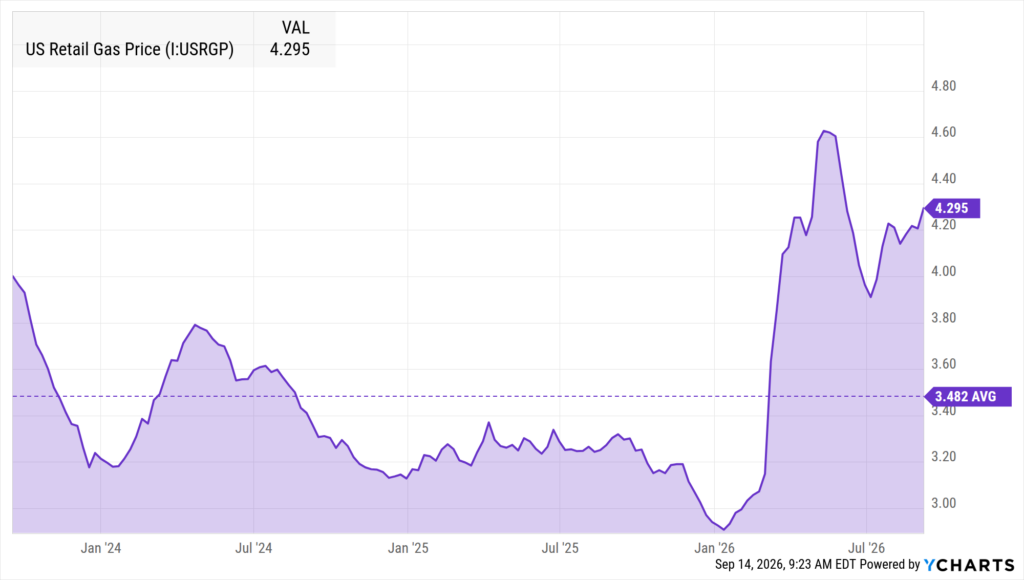
Gas prices reached $4.30 per gallon as of September 7, 2026. For most clients, this is the inflation chart that matters, because it is the one they see twice a week without opening a statement.
Pump prices also feed the conversation in a way headline CPI does not. When a client says inflation feels worse than the official number, this is usually what they mean. Starting a review here rather than with a CPI print tends to shorten the distance between what the client is experiencing and what the portfolio is doing.
Diesel and Crude Oil
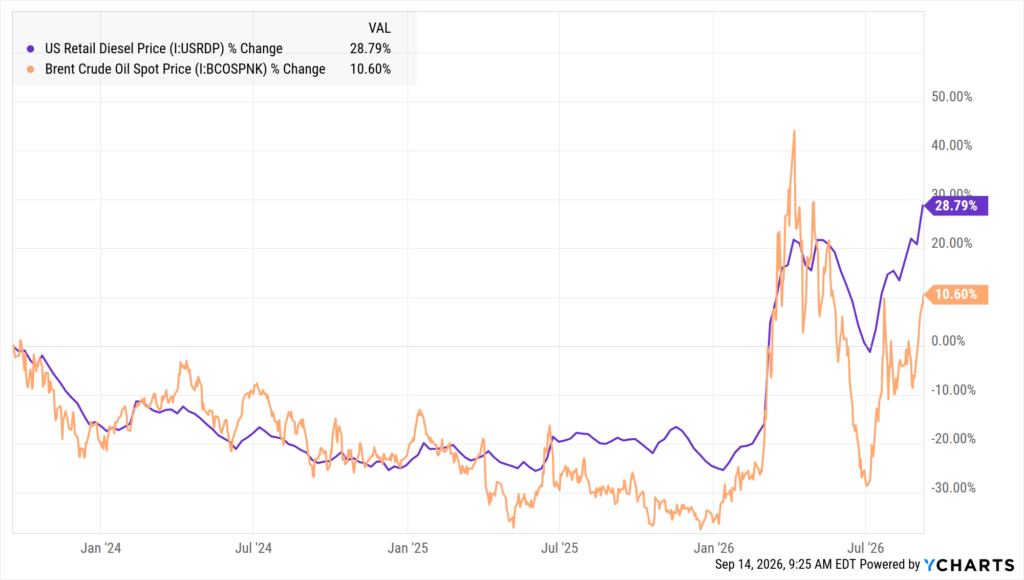
US retail diesel reached $5.97 per gallon on September 7, 2026, the highest level in the series. Brent crude sat at $106.12 on September 8.
The more useful detail is the gap between the two lines. Over the past three years diesel is up roughly 31% while Brent is up roughly 15%. Diesel has moved about twice as far as the crude it is refined from, which points to refining capacity rather than barrel supply as the binding constraint.
That distinction matters for where the cost lands. Diesel is the fuel for freight, rail, agriculture, and construction equipment, so it enters the price of goods before it enters anyone’s household budget. Retail gasoline, by contrast, remains meaningfully below its June 2022 peak. The energy shock in this cycle is arriving through distribution costs rather than through the consumer’s tank, which is why it shows up in a CPI print more readily than in a client’s monthly spending.
The US Inflation Rate
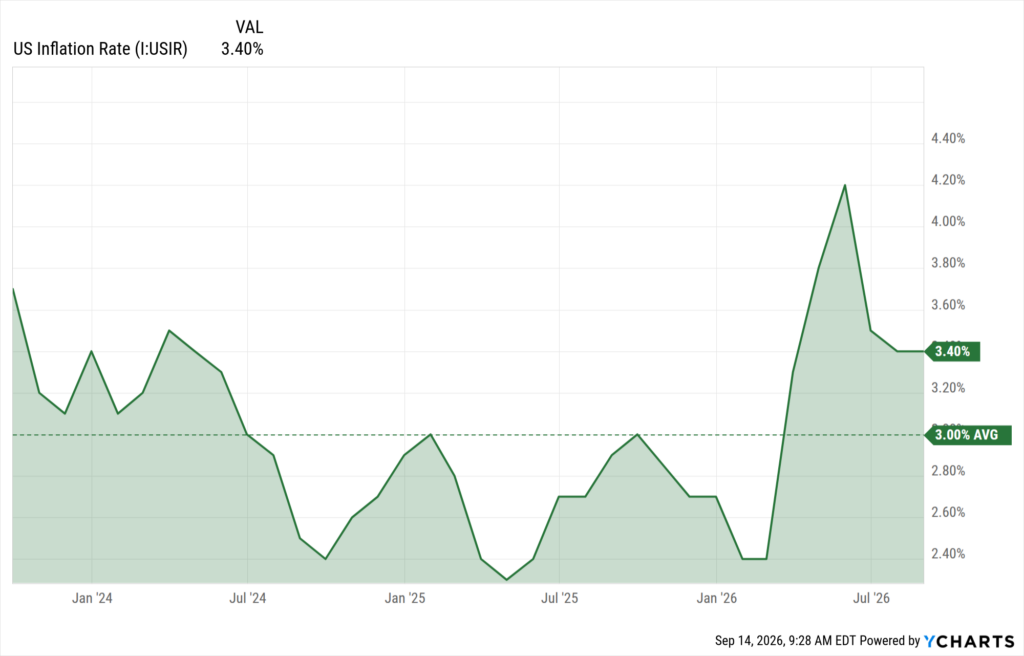
The US Inflation Rate reached 3.4% in August 2026, up from 2.7% at the end of December 2025. After two years of gradual progress toward the Fed’s 2% objective, the trend has reversed over the course of 2026 alongside energy costs.
A reversal of this size complicates the standard client message that inflation has been handled. It has not been handled, and the portfolio conversation is different when the direction of travel changes.
The Fed Funds Rate Against Inflation
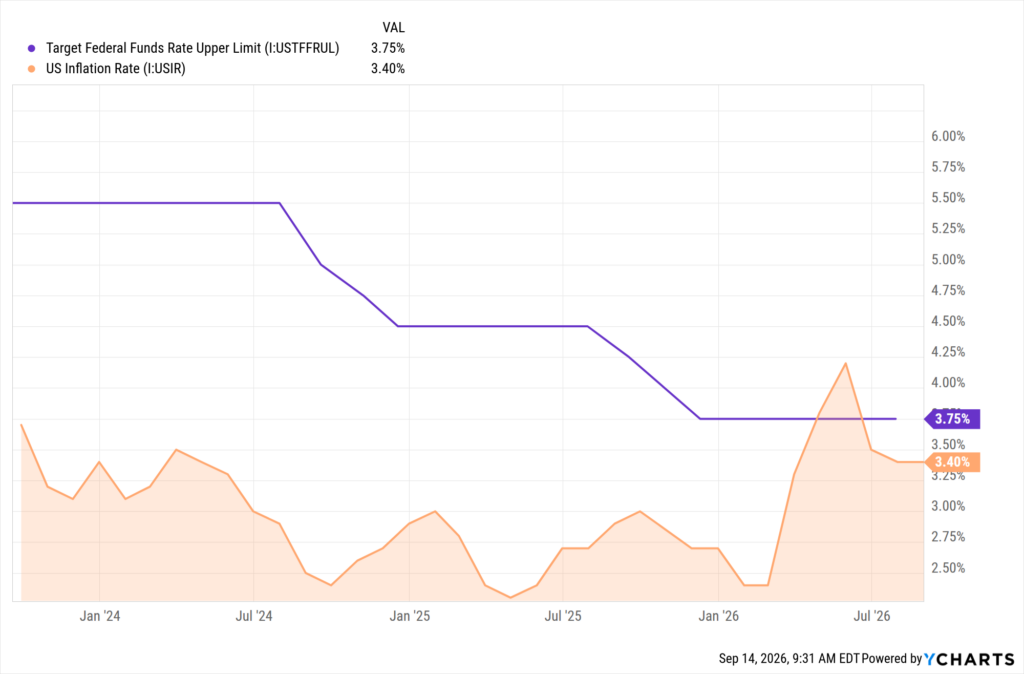
This is the chart that explains why September is a live meeting.
The target range upper limit stands at 3.75%. Inflation stands at 3.4%. The gap between them is roughly a third of a percentage point, which means the policy rate is barely restrictive in real terms. When the Fed was cutting through 2024 and 2025, that gap was substantially wider, and the cuts were a normalization from restrictive territory rather than a move toward accommodation.
At current levels, the committee has very little room between the policy rate and the inflation rate. That is the arithmetic behind the three July dissents.
The 10-Year Treasury Rate
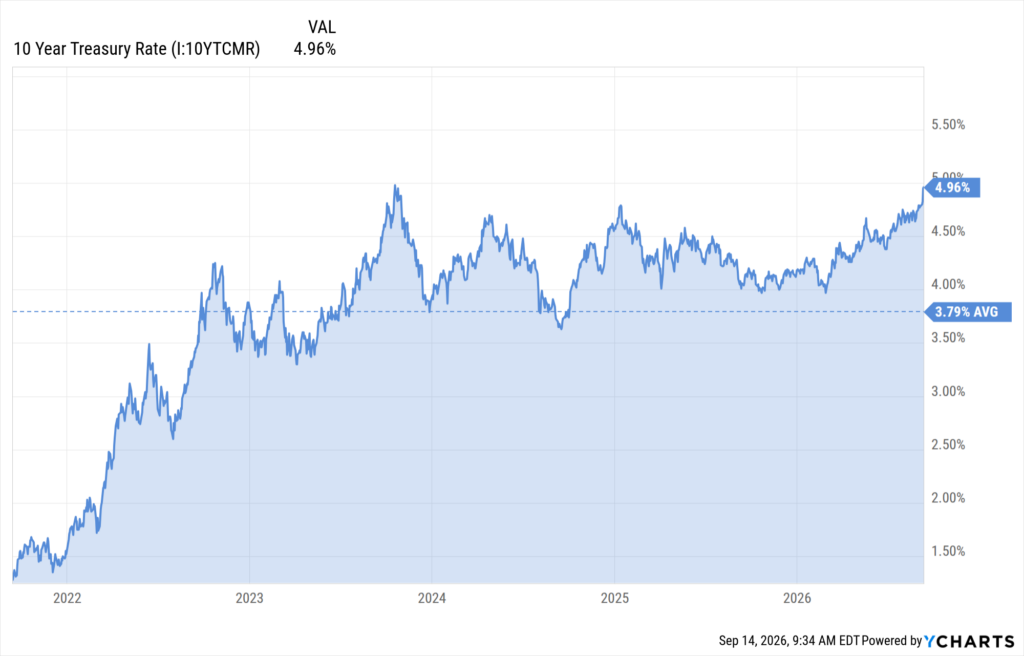
The 10-year Treasury rate closed at 4.95% on September 10, 2026, up from 4.18% at the end of December 2025. That is a move of 77 basis points over roughly eight months.
The 10-year sits underneath most of what a client portfolio does. It is the reference rate for mortgages, the discount rate embedded in equity valuations, and the anchor for corporate
borrowing costs. A move of this size in a single year shows up in bond fund prices, in refinancing math, and in the relative appeal of cash.
The 10-Year Breakeven Inflation Rate
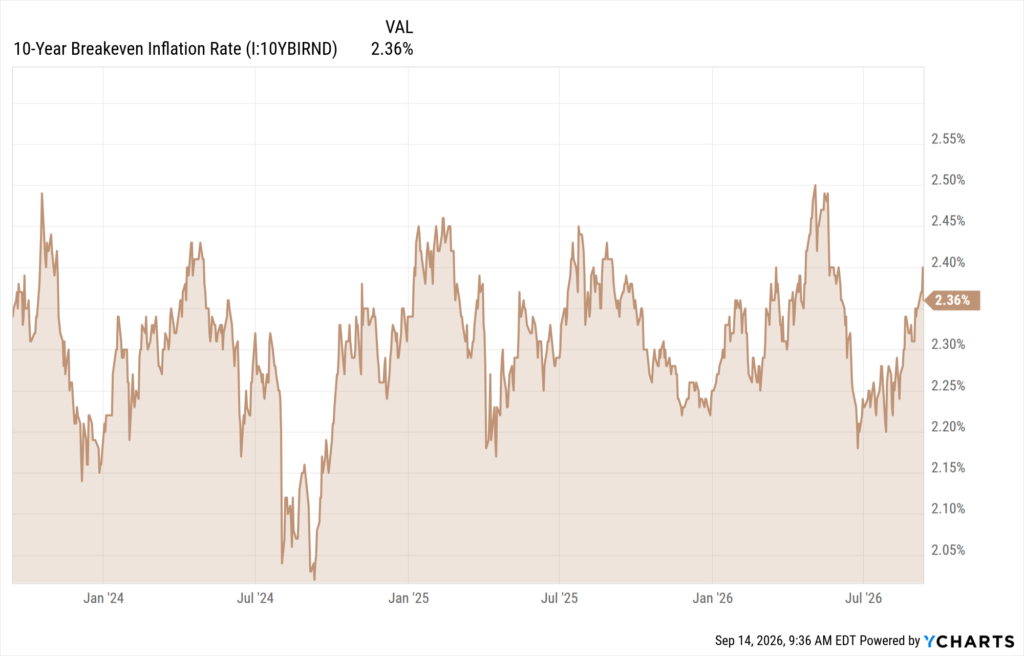
The 10-year breakeven inflation rate, the difference between nominal and inflation-protected Treasury yields, stood at 2.29% on August 31, 2026. At the end of December 2025, it stood at 2.24%.
Set that next to the previous chart. The 10-year Treasury rate rose 77 basis points this year. Long-run inflation expectations rose five.
That gap is the most useful thing on this page for a client conversation. The intuitive read on higher gas prices and higher yields is that inflation is structurally back and bonds are facing a repeat of 2022. The breakeven series does not support that read. The bond market is repricing real rates, not its long-run inflation view. The July FOMC minutes made the same observation, noting that longer-term inflation compensation remained stable and consistent with the 2% objective even as oil prices rose sharply.
A client who believes inflation expectations have broken loose and a client who understands that yields moved on real rates will make different decisions about duration.
The Treasury Yield Curve
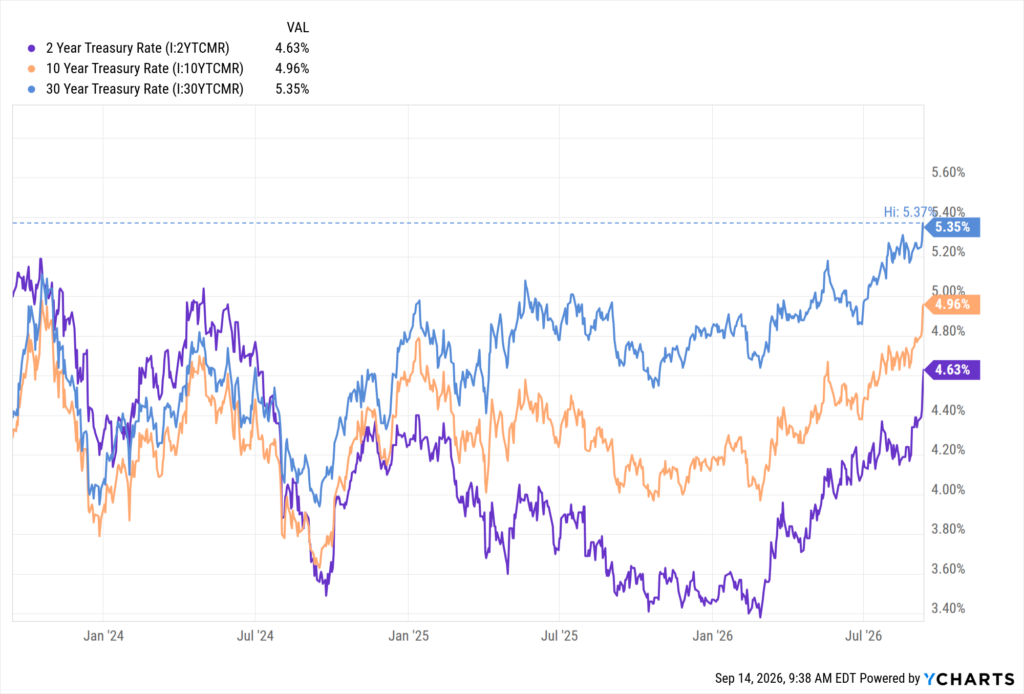
As of September 10, 2026, the 2-year sat at 4.56%, the 10-year at 4.95%, and the 30-year at 5.37%.
The curve is positively sloped, with the steepest segment at the long end. The 39 basis points between the 2-year and the 10-year is modest. The 42 basis points between the 10-year and the 30-year is the part worth noting, because it reflects where term premium is being demanded.
For portfolios that moved to the short end during the inversion, this shape raises a question that has not been worth asking for several years: what is being given up by staying there.
What Wednesday Actually Produces
September is a Summary of Economic Projections meeting, which means the committee publishes updated forecasts and the dot plot alongside the rate decision. Three things will be visible by Wednesday afternoon:
- The decision itself, and the vote split. The July split was 9-3.
- The dot plot, showing how many members project further moves through the end of 2026 and into 2027.
- The projection revisions, particularly the inflation path, which will show how much of the energy shock the committee expects to persist.
Yields have moved on real rates while long-run inflation expectations have stayed anchored near the Fed’s target. That is the distinction worth carrying into client meetings this week.
Disclaimer
©2026 YCharts, Inc. All Rights Reserved. YCharts, Inc. (“YCharts”) is not registered with the U.S. Securities and Exchange Commission (or with the securities regulatory authority or body of any state or any other jurisdiction) as an investment adviser, broker-dealer or in any other capacity, and does not purport to provide investment advice or make investment recommendations. This report has been generated through application of the analytical tools and data provided through ycharts.com and is intended solely to assist you or your investment or other adviser(s) in conducting investment research. You should not construe this report as an offer to buy or sell, as a solicitation of an offer to buy or sell, or as a recommendation to buy, sell, hold or trade, any security or other financial instrument. For further information regarding your use of this report, please go to: ycharts.com/about/disclosure.
Next Article
How Gas and Diesel Prices Feed Into InflationRead More →