A Closer Look at January Fund Flows: Active ETFs, Bitcoin, and Beyond

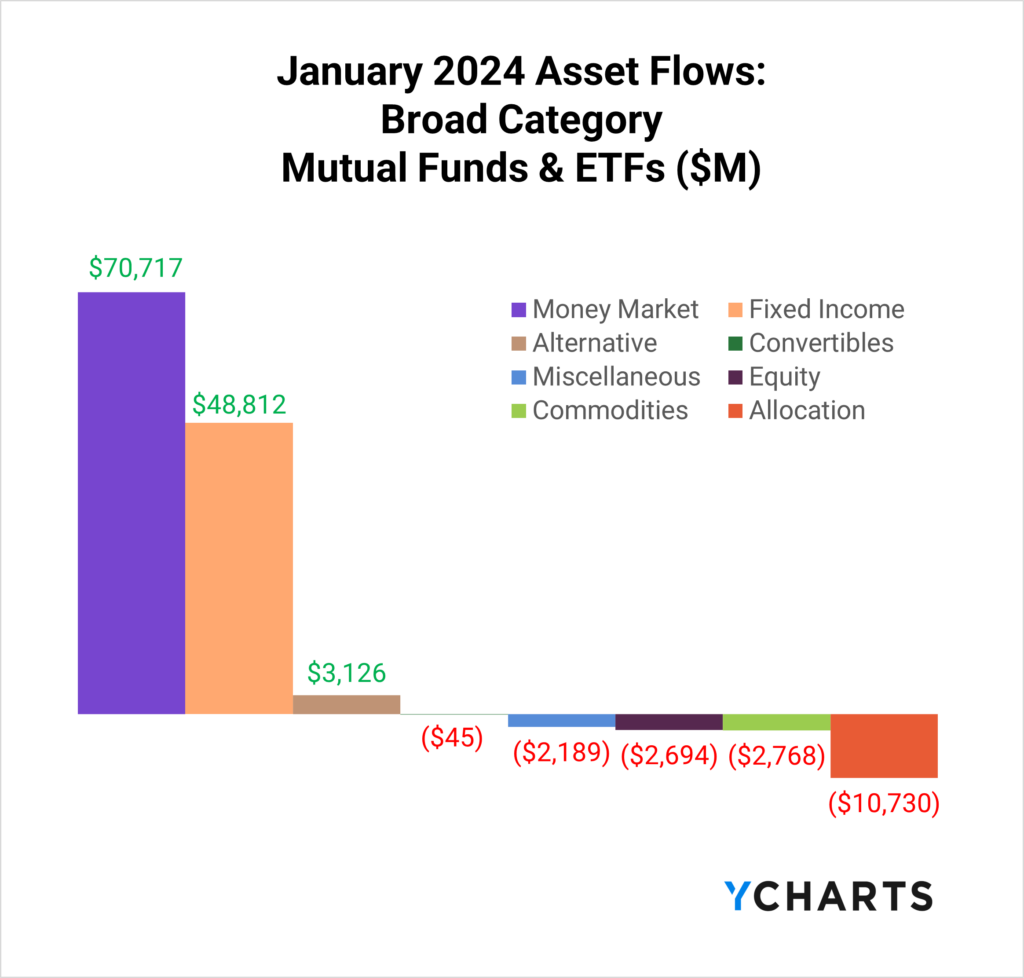
In many ways, January 2024 continued several trends from throughout 2023. Most notably, money market funds led all broad category flows, attracting $70.7B in January. Fixed Income funds also had a good month, with $48.8B in inflows.
Active ETFs Continue to Gain Market Share vs Passive ETFs
Based on a 2023 survey conducted by the Money Management Institute, 42% of asset managers currently support active ETFs, while an additional 33% plan to do so soon. Moreover, among those asset managers who already offer active ETFs, 75% have plans to increase their support for this type of investment vehicle.
One reason behind this trend is the growing demand for active ETFs from wealth managers, with 89% already using these vehicles. Among those currently using active ETFs, 42% have expressed their intention to increase their focus on this investment option.
Of the $16.9B that went into Fixed Income ETFs in January, $3.9B (or 23%) came from active strategies despite only making up 10% of Fixed Income ETF AUM. Furthermore, from January 2023 until January 2024, $30.5B went into active fixed-income ETFs, representing 16% of the $191.5B that went into these strategies.
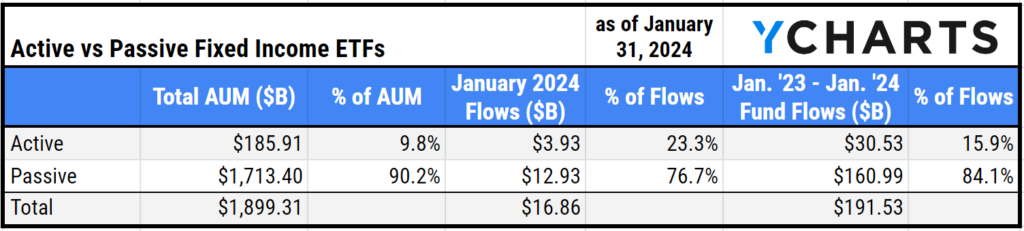
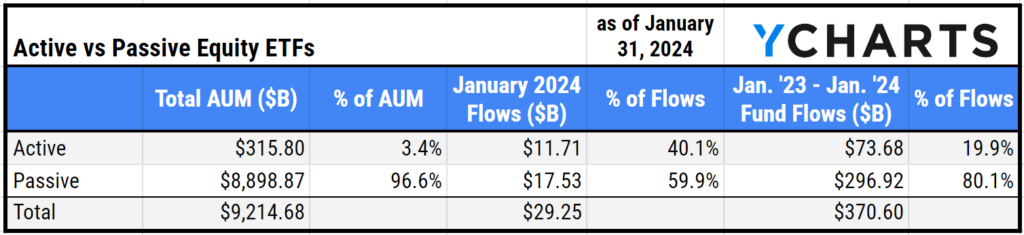
This dynamic is even more staggering in equity ETFs, where despite making up 3% of AUM, active equity ETFs accounted for 40% of inflows in January and 20% of flows from January 2023 through January 2024.
Topic of the Moment: Bitcoin ETF Flows
On January 11, 2024, the SEC gave spot-price Bitcoin ETFs the go-ahead, and since then, these 11 funds have accumulated $37.8B in AUM (including the GBTC after its ETF conversion).
Thanks to low fees and brand recognition, iShares Bitcoin Trust ETF (IBIT), Fidelity Wise Origin Bitcoin ETF (FBTC), and ARK 21Shares Bitcoin ETF (ARKB) brought in the most assets since these funds launched, attracting $2.6B, 2.5B, and $637M respectively.
Meanwhile, $5.6B left Grayscale Bitcoin Trust (GBTC) due to the new avenues advisors can give their clients exposure to Bitcoin. Despite the outflows, there is still $23.2B of AUM in GBTC, more than three times more than the next biggest Bitcoin ETF.
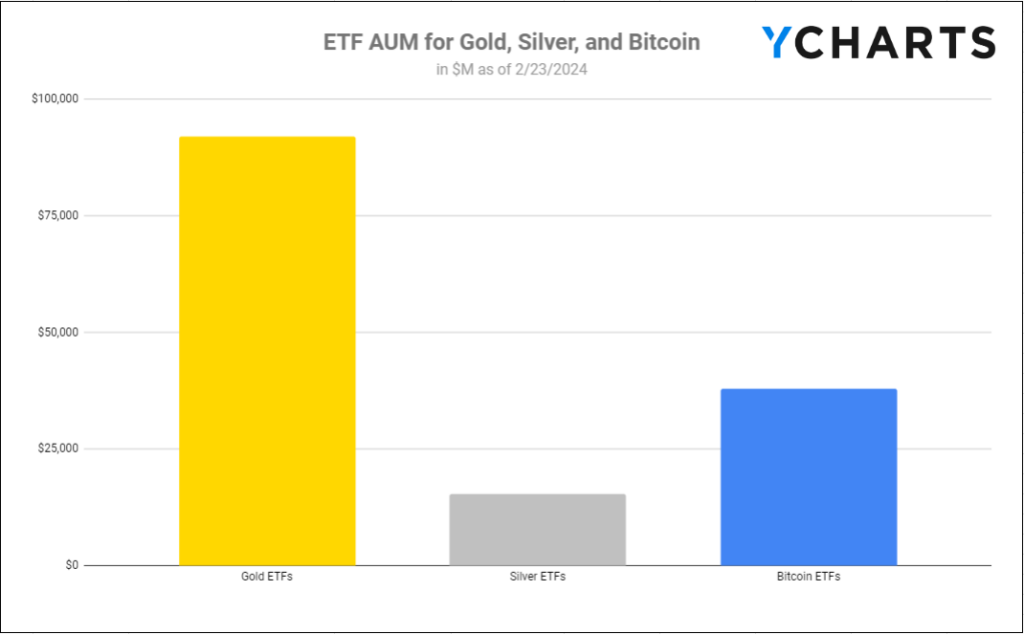
To put this category’s size into perspective, the overall AUM of Bitcoin ETFs is now higher than Silver ETFs ($15B) and more than a third of the size of Gold ETFs ($92B) after 29 trading days.
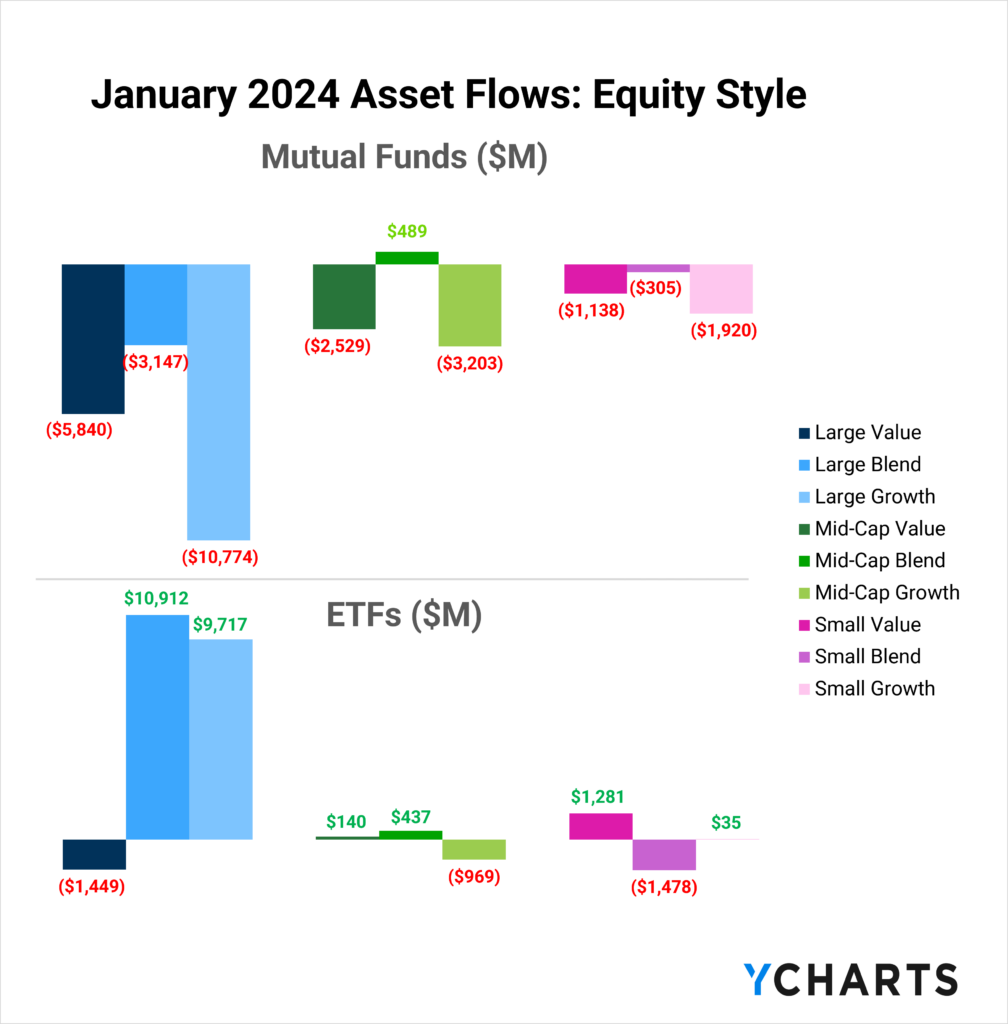
January Inflows and Outflows for Equity Funds
Equity ETFs had fewer outflows than mutual funds in January. All style boxes except Mid-Cap Blend mutual funds saw outflows, whereas just three ETF types saw assets leave last month.
Here are some of January’s most popular and unpopular ETF and mutual fund categories and individual strategies:
Inflows in Diversified Emerging Market Mutual Funds
One of the few equity mutual fund categories to see positive flows in January was Diversified Emerging Markets. These funds brought in $2.6B or less than 1% of the category’s $2.6T total AUM. The fund that attracted the most assets was American Funds New World R6 (RNWGX), with $1.3B, 9.4% of its $14B Share Class AUM and 2.4% of its total $55.7B AUM.
Outflows in Large Growth Mutual Funds
Large Growth mutual funds saw the most significant departure of assets in January, with $10.8B leaving the category. Despite those outflows, there’s still $13.49T in total AUM in Large Growth mutual funds. Below is a table of the funds that saw the most outflows in the category in January.
Inflows in Large Blend ETFs
Large Blend ETFs brought in $10.9B, or less than 1% of the category’s $4.1T AUM in January. The fund that attracted the most assets was iShares Core S&P 500 ETF (IVV), whose $11.9B inflow is 2.7% of its $432.3B AUM, and Vanguard S&P 500 ETF (VOO) receiving $10.9B that is 1.1% of its $1T AUM.
It is worth noting that upon an initial glance at the table above, one might wonder how the two top funds in the category were able to accumulate over $21B in inflows, while the category as a whole only has $10.9B in net inflows. This is due to a $15B outflow from SPDR® S&P 500 ETF Trust (SPY), which can be used disproportionately as a trading tool, unlike IVV or VOO.
The funds that saw the biggest flows are those that track the S&P 500 in some regard. The fund that brought in the sixth most funds in the category was VanEck Morningstar Wide Moat ETF (MOAT), whose holdings have less overlap than some of the S&P index funds, brought in $410.7M, 2.9% of its $14.1B AUM.
Outflows in Small Blend ETFs
Small Blend ETFs saw $1.6B leave the category. Despite those outflows, Small Blend ETFs contain $342.6B in AUM . Below is a table of the Small Blend ETFs that saw the most outflows in January.
January Inflows and Outflows for Fixed Income Funds
Inflows in Intermediate Core Bond Mutual Funds
Intermediate Core Bond Mutual Funds brought in $10.1B or less than 1% of the category’s $1.1T AUM. The fund that attracted the most assets was the Vanguard Total Bond Market II Index (VTBNX), with $1.9B, which is 1.3% of its $140.2B Share Class AUM.
Outflows in Long Government Mutual Funds
Long Government Mutual Funds saw $1.8B leave the category. Despite those outflows, there’s still $96.2B in Total AUM in Long Government mutual funds. Below, you’ll find a table of the funds that saw the biggest outflows in the category in January.
Inflows in Corporate Bond ETFs
Corporate Bond ETFs brought in $6.2B, or 4.9% of the category’s $128.5B AUM. The fund that attracted the most assets was iShares iBoxx $ Investment Grade Corporate Bond ETF (LQD), with $3.3B, which is 10.1% of its $33.1B AUM, and Vanguard Intermediate-Term Corporate Bond ETF (VCIT) with $1.9B, which is 3.9% of its $48.6B AUM.
Outflows in Ultrashort Bond ETFs
Ultrashort Bond ETFs saw $3.5B leave the category. Despite those outflows, there’s still $197.2B in AUM in Ultrashort Bond ETFs. Below is a table of the funds that saw the biggest outflows in the category in January.
Whenever you’re ready, there are three ways YCharts can help you:
Have questions about how YCharts can help you grow AUM and prepare for meetings?
Email us at hello@ycharts.com or call (866) 965-7552. You’ll get a response from one of our Chicago-based team members.
Sign up for a copy of our Fund Flows Report and Visual Deck (clients only):
Unlock access to our Fund Flows Report and Visual Deck by becoming a client.
Dive into YCharts with a no-obligation 7-Day Free Trial now.
Disclaimer
©2024 YCharts, Inc. All Rights Reserved. YCharts, Inc. (“YCharts”) is not registered with the U.S. Securities and Exchange Commission (or with the securities regulatory authority or body of any state or any other jurisdiction) as an investment adviser, broker-dealer or in any other capacity, and does not purport to provide investment advice or make investment recommendations. This report has been generated through application of the analytical tools and data provided through ycharts.com and is intended solely to assist you or your investment or other adviser(s) in conducting investment research. You should not construe this report as an offer to buy or sell, as a solicitation of an offer to buy or sell, or as a recommendation to buy, sell, hold or trade, any security or other financial instrument. For further information regarding your use of this report, please go to: ycharts.com/about/disclosure
Next Article
Monthly Market Wrap: January 2024Read More →