A Closer Look at Q2 2024 Fund Flows: Active ETF Growth and Money Market Outflows

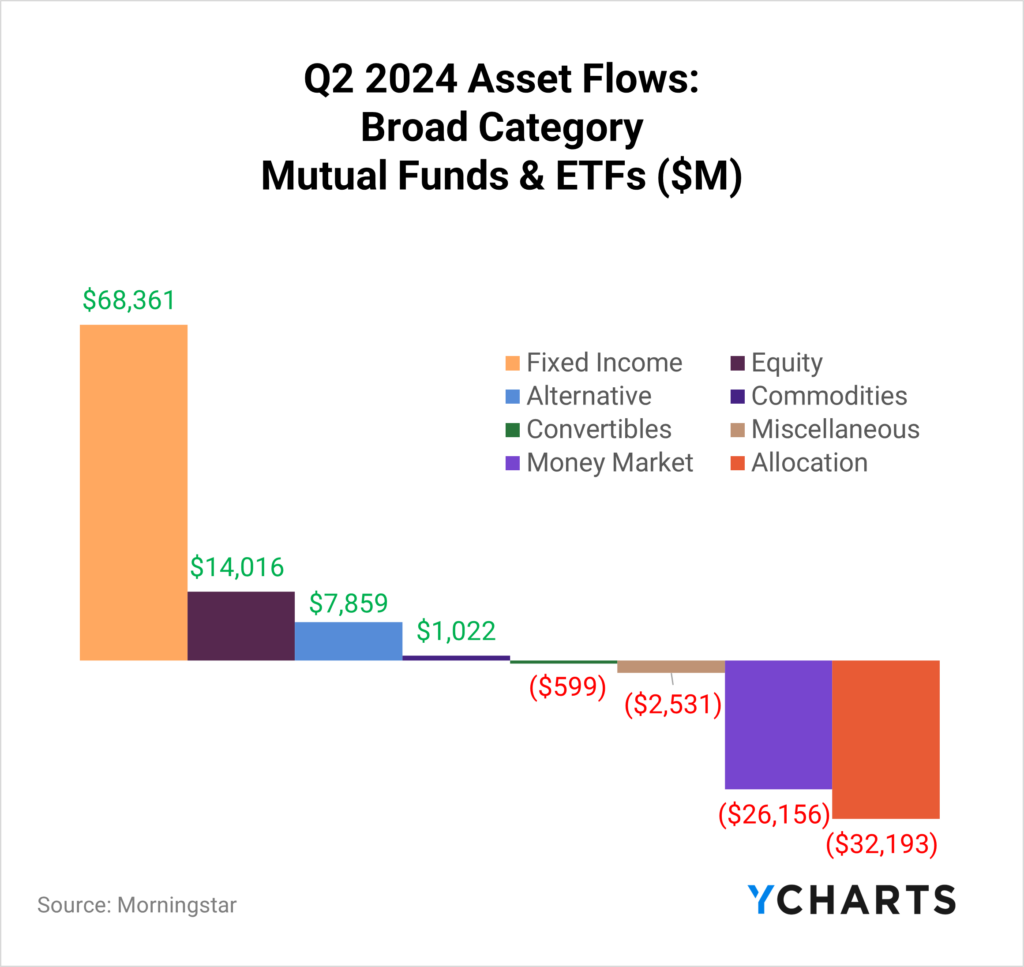
It may be hard to believe, but we are already in the second half of 2024. And the $26B in outflows from money market funds in Q2 may have been the signal that wholesalers were waiting for—investors were finally moving money from the sidelines to either extend duration or rejoin the equity market.
The big winners in the quarter were Fixed Income funds, which, following a tremendous first quarter, attracted another $68.4B in Q2. Equity funds also had a good quarter, with over $14B pouring into those strategies.
Read on to see how money moved in and out of strategies in more specific categories, as defined by our data providers.
Clients, sign up for YCharts’ full Fund Flow Report sent directly to your inbox.
For a more nuanced look at monthly flows, sign up for a copy of our Fund Flows Report and Visual Deck (clients only):Active ETFs vs Passive ETFs in Q2
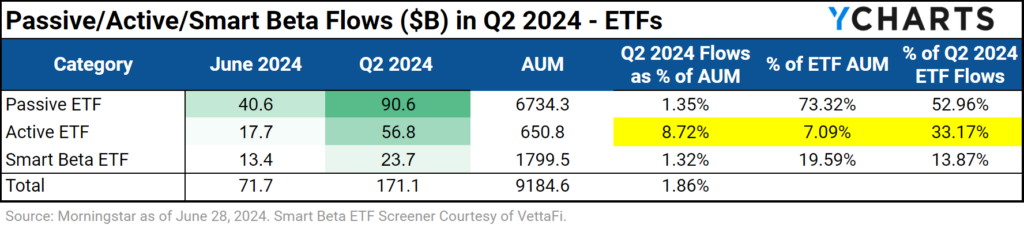
According to a 2023 survey conducted by the Money Management Institute, 42% of asset managers currently support active ETFs, and an additional 33% plan to do so soon.
One reason behind this trend is the growing demand for active ETFs from wealth managers, with 89% already using these vehicles. Of those currently using active ETFs, 42% have expressed their intention to increase their focus on this investment option.
Advisor demand for active ETFs has been highlighted throughout the first half of 2024. In Q2, the demand for these strategies came to fruition, with almost 33% of ETF flows going into active funds despite only making up 7% of ETF AUM.
Download Visual | Get in Touch to Access the Smart Beta Screen
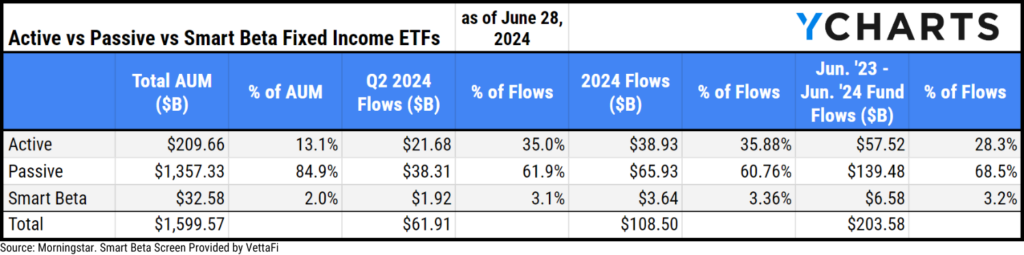
Of the $61.9B that went into Fixed Income ETFs in Q2, $21.7B (or 35%) came from active strategies despite only making up 13% of Fixed Income ETF AUM (as of June 28th). Furthermore, from June 2023 until June 2024, $57.5B went into active fixed income ETFs, representing 28.3% of the $203.6B that went into fixed-income strategies.
Download Visual | Get in Touch to Access the Smart Beta Screen
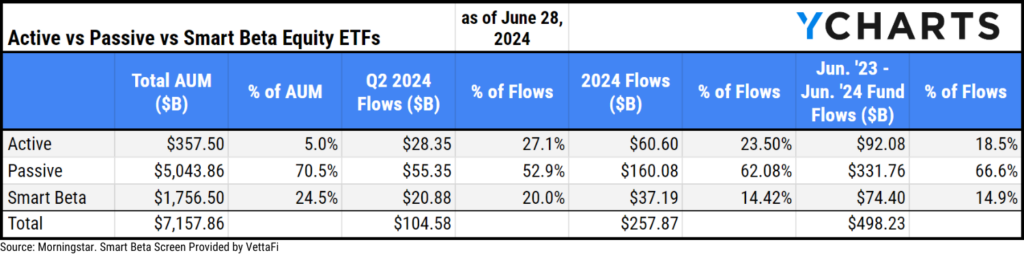
In equity ETFs, where despite making up 5% of AUM, active equity ETFs accounted for 27% of inflows in Q2 2024 and 18.5% of flows from June 2023 through June 2024.
Download Visual | Get in Touch to Access the Smart Beta Screen
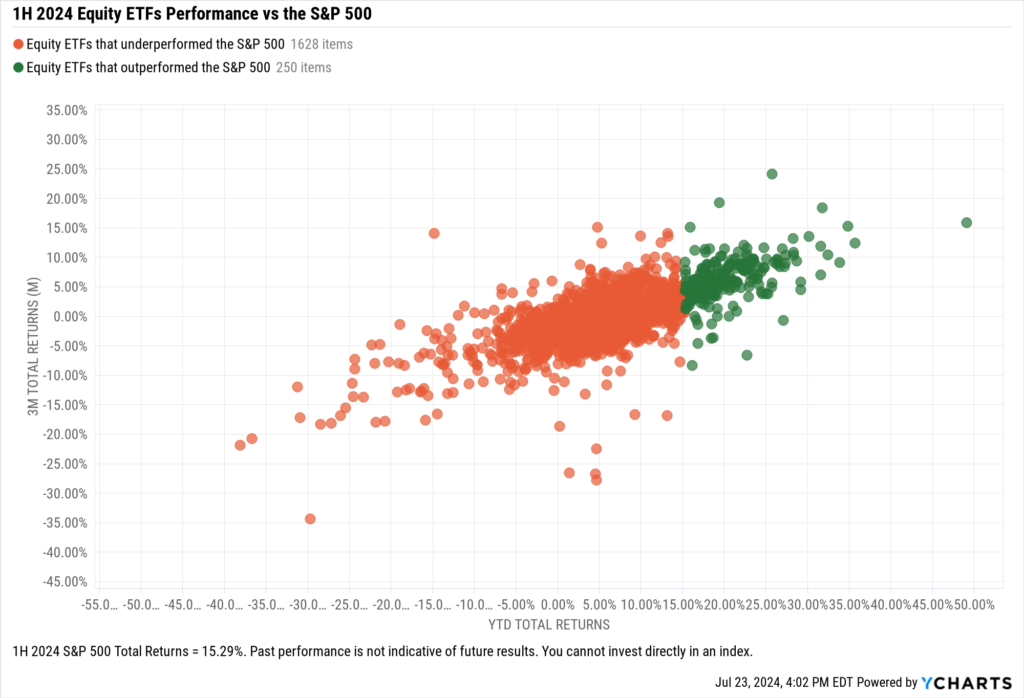
Which ETFs are Beating the S&P 500 (and other benchmarks)?
The S&P 500 posted a 15.29% total return in the first half of 2024, a mark that only 250 (or 13.3%) equity ETFs surpassed in the period.
The lack of outperformers is largely due to the concentration of big technology names at the top of the index, where 3 names powered 49% of its gains.
Regardless of how it achieved its performance, the high standards set by the S&P reinforces why, according to State Street’s 2024 ETF Impact survey, 98% of institutional investors use the S&P 500 as a benchmark for most or some investments.
Download Visual | Get in Touch to Access this Chart
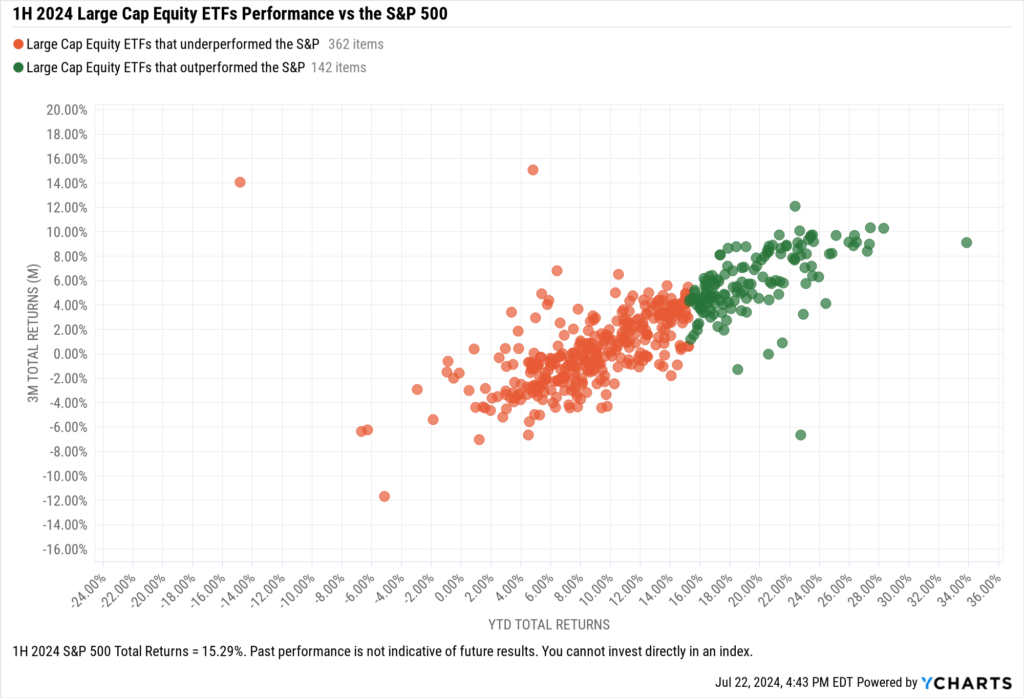
Large Cap ETFs vs the S&P 500
When looking at large-cap ETFs exclusively, over a quarter of strategies (28.2%) outperform the S&P 500. However, that’s still far from the majority.
Some of the large-cap strategies with the best performance through the first half of the year are the Invesco S&P 500® Momentum ETF (SPMO), Direxion HCM Tactical Enhanced US Equity Strategy ETF (HCMT), and Fidelity Blue Chip Growth ETF (FBCG) with 33.9%, 28.3%, and 27.4% returns, respectively, as of June 28, 2024.
Download Visual | Get in Touch to Access this Chart
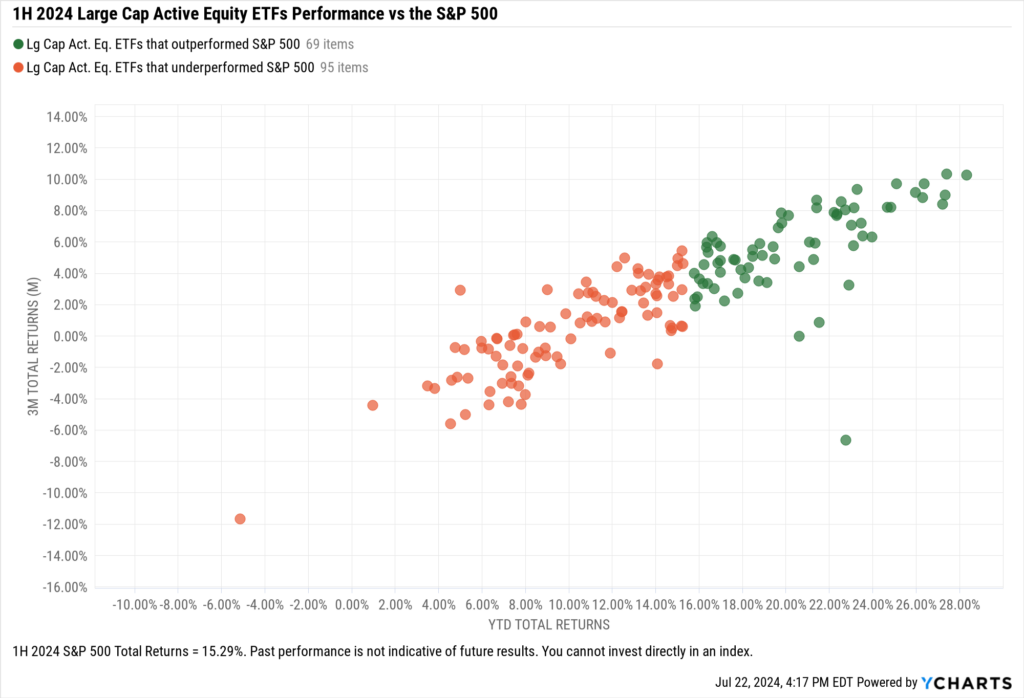
Active ETFs vs the S&P 500
After excluding income-centric or defined outcome ETFs that use options to achieve their goals (based on Morningstar categorization), large-cap active managers fared pretty well against the S&P in the first half of the year. As 42.3% of these ETFs surpassed the 15.29% total return mark in the first half.
To successfully attract assets, active managers must not only try to beat the S&P but, in most cases, they need to differentiate themselves from it. This means they’re faced with the tall task of finding stocks outside of names like NVIDIA (NVDA), Microsoft (MSFT), and Alphabet (GOOG, GOOGL), which have done much of the heavy lifting for equity markets over the last year and a half.
Some of the large-cap active strategies with the best performance through the first half of the year are the Direxion HCM Tactical Enhanced US Equity Strategy ETF (HCMT), Fidelity Blue Chip Growth ETF (FBCG), and IQ Winslow Focused Large Cap Growth ETF (IWFG) with 28.3%, 27.4%, and 27.3% returns, respectively.
Download Visual | Get in Touch to Access this Chart
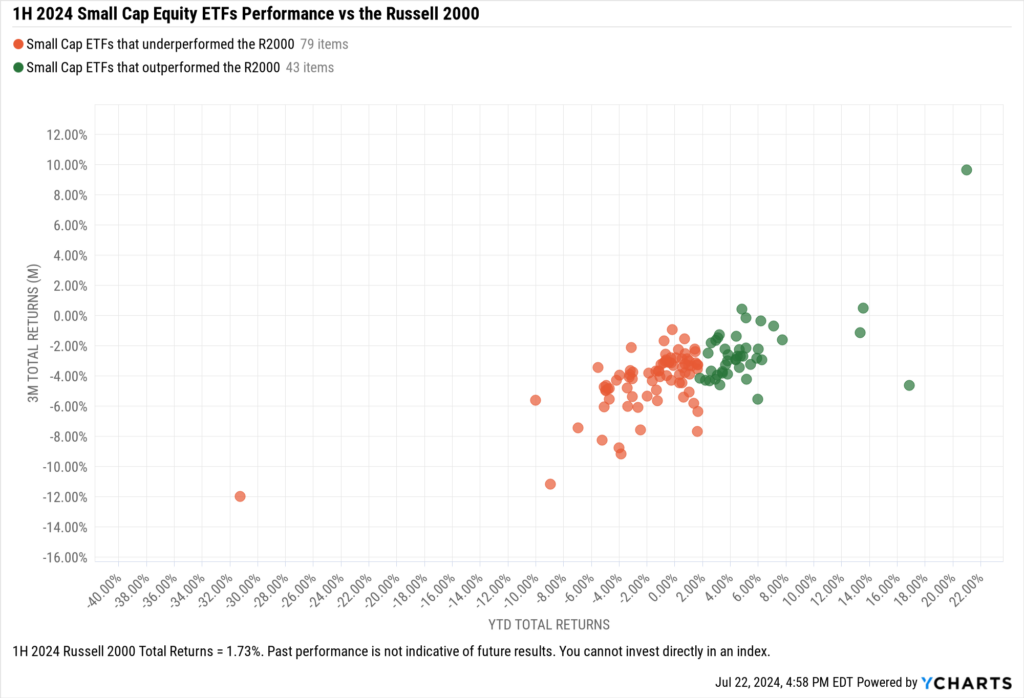
Small Caps vs the Russell 2000
Through the first half of 2024, 43, or 35%, of the 122 small-cap ETFs analyzed outperformed the Russell 2000 (1.7%).
Some of the small-cap strategies with the best performance through the first half of the year are the Clough Select Equity ETF (CBSE), Invesco S&P MidCap 400® GARP ETF (GRPM), and Inspire Faithward Mid Cap Momentum ETF (GLRY) with 21%, 16.9%, and 13.6% returns, respectively.
Download Visual | Get in Touch to Access this Chart
Inflows and Outflows for Equity ETFs through 1H 2024
Only three equity styles saw positive inflows in Q2: Large Growth, Large Blend, and Mid-Cap Blend. That was primarily due to the massive exodus from equity mutual funds, where only Small Blend strategies saw positive inflows. On the ETF side, all but one style box had a net-positive month attracting assets, with Small Blend as the exception.
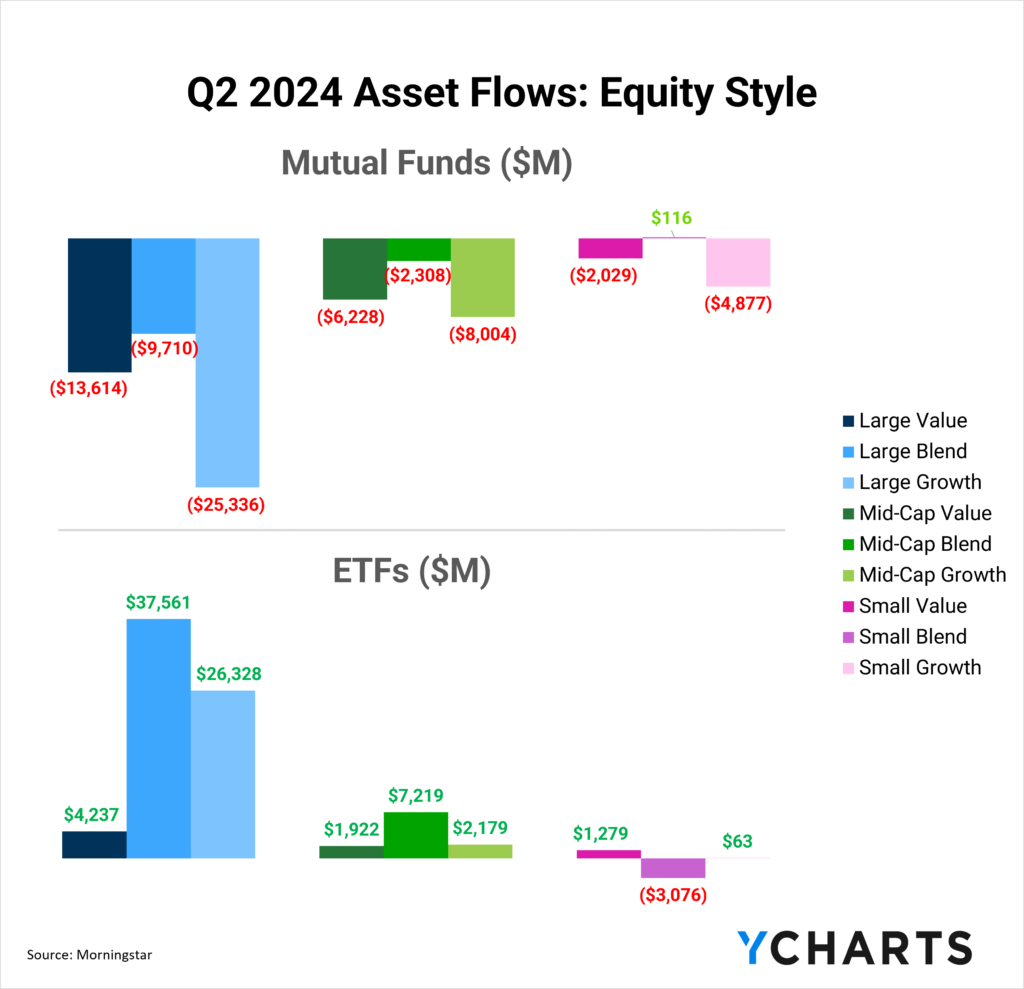
Inflows in Large Blend ETFs
Large Blend ETFs attracted $37.6B in Q2 and $101.4B through the first half of the year, helping propel the category’s assets to $2.8T.
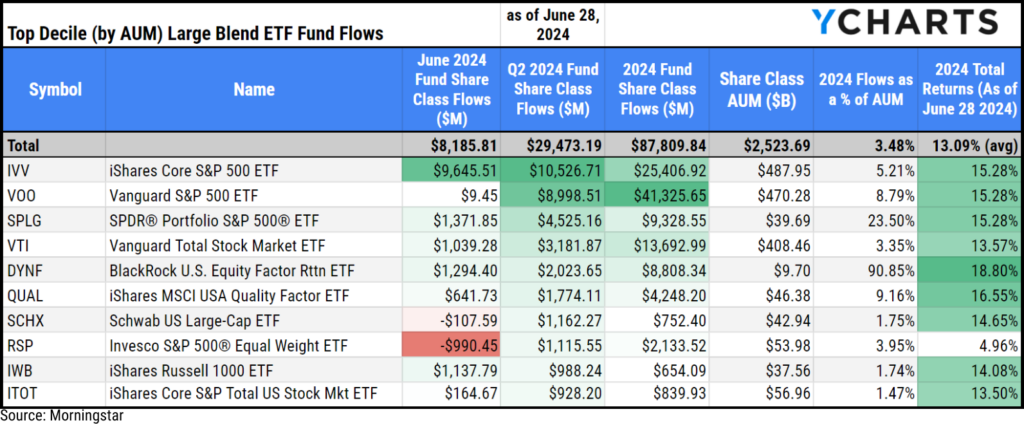
Biggest Large Blend ETFs Fund Flows
To avoid the monotony of presenting the same large blend ETFs month after month, we’ve broken this category up by AUM size. Starting with the top decile of funds (by aum), which includes 28 ETFs, the iShares Core S&P 500 ETF (IVV) reeled in $10.5B in Q2, and the $25.4B the strategy has attracted YTD represents 5.2% of the fund’s AUM as of June 28, 2024.
Trailing closely behind, the Vanguard S&P 500 ETF (VOO) brought in $9B in Q2, and the $41.3B it has attracted since January (the most in the category) represents 8.8% of its AUM. The SPDR® Portfolio S&P 500® ETF (SPLG) rounded out the top three, netting $4.5B on the quarter, and its $9.3B in YTD inflows represent 23.5% of its AUM.
Download Visual | Modify in Comp Tables in YCharts
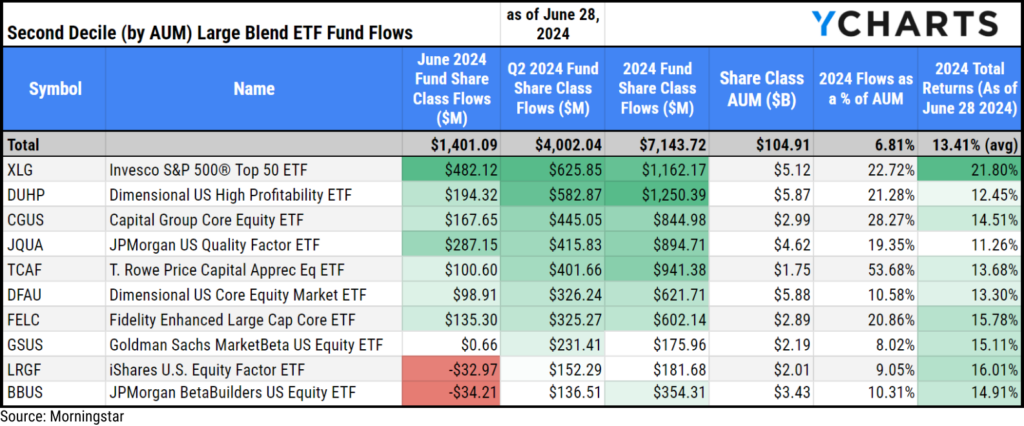
Second Biggest Large Blend ETFs Fund Flows
In the second decile (by AUM) of large blend ETFs, which contains 29 ETFs, the Invesco S&P 500® Top 50 ETF (XLG) led the heat with $625.9M in inflows in Q2.
The Dimensional US High Profitability ETF (DUHP) and the Capital Group Core Equity ETF (CGUS) rounded out the top three, bringing in $582.8M and $445.1M in Q2, respectively.
The $1.2B XLG brought in so far in 2024 is second in the heat to DUHP, which brought in $1.3B this year, or 21.3% of its AUM. The T. Rowe Price Capital Appreciation Equity ETF (TCAF)’s $941M in YTD flows ranked third in the group.
Download Visual | Modify in Comp Tables in YCharts
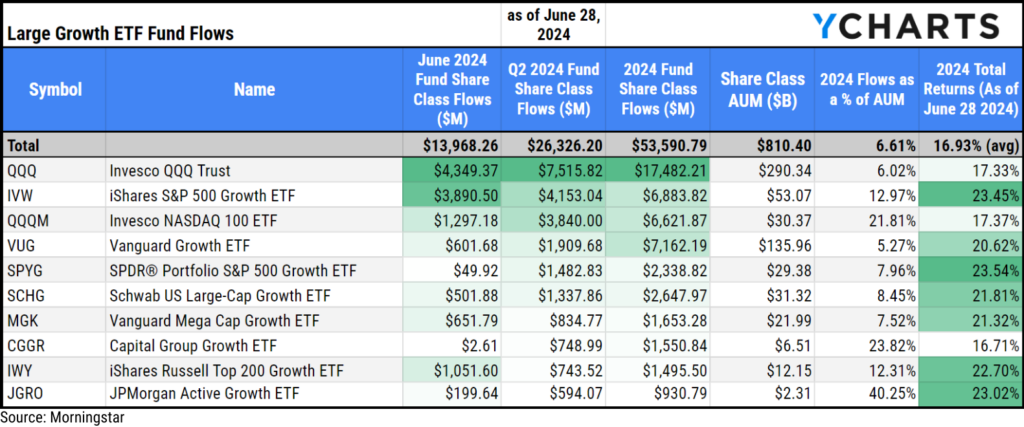
Inflows in Large Growth ETFs
Large Growth ETFs saw over $26.3B in inflows in Q2 and $53.6B YTD in 2024. These flows and strong performance from the strategies’ underlying holdings have propelled the category to over $810B in assets.
The fund that attracted the most assets in Q2 was Invesco QQQ Trust (QQQ), with $7.5B in inflows. The strategy has attracted $17.5B so far in 2024, which represents 6% of its AUM.
The iShares S&P 500 Growth ETF (IVW) and Invesco NASDAQ 100 ETF (QQQM) brought in $4.2B and $3.8B, respectively, in Q2 to round out the top three.
Download Visual | Modify in Comp Tables in YCharts
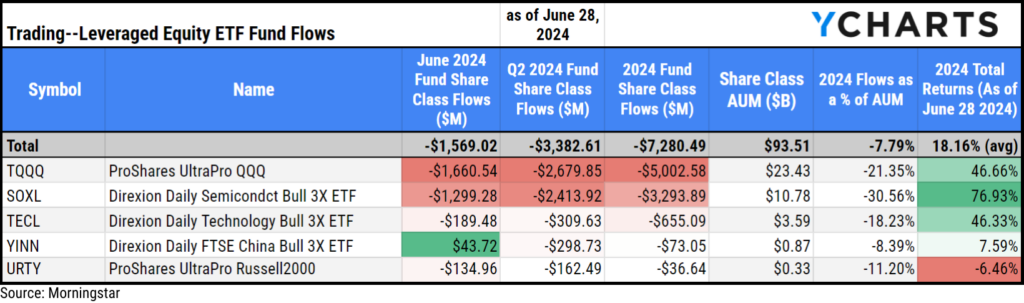
Outflows in Trading–Leveraged Equity
Trading—Leveraged Equity ETFs shed $7.3B in the first half of 2024 as investors flocked away from double-and triple-leveraged index, sector, and thematic strategies.
ProShares UltraPro QQQ (TQQQ), Direxion Daily Semicondct Bull 3X ETF (SOXL), and ProShares UltraPro S&P500 (UPRO) saw the biggest departures. Meanwhile, funds like GraniteShares 2x Long NVDA Daily ETF (NVDL), Direxion Daily TSLA Bull 2X Shares (TSLL), and GraniteShares 2x Long COIN Daily ETF (CONL) had a net positive first half of the year, attracting assets.
This suggests that if investors elect to use leverage in their portfolio, they opt to do it with single stock strategies rather than diversified themes or indexes.
Below is a table of the Trading—Leveraged Equity ETFs that saw the most outflows in the first half of 2024:
Download Visual | Modify in Comp Tables in YCharts
Q2 2024 ETF Fixed Income Fund Flows
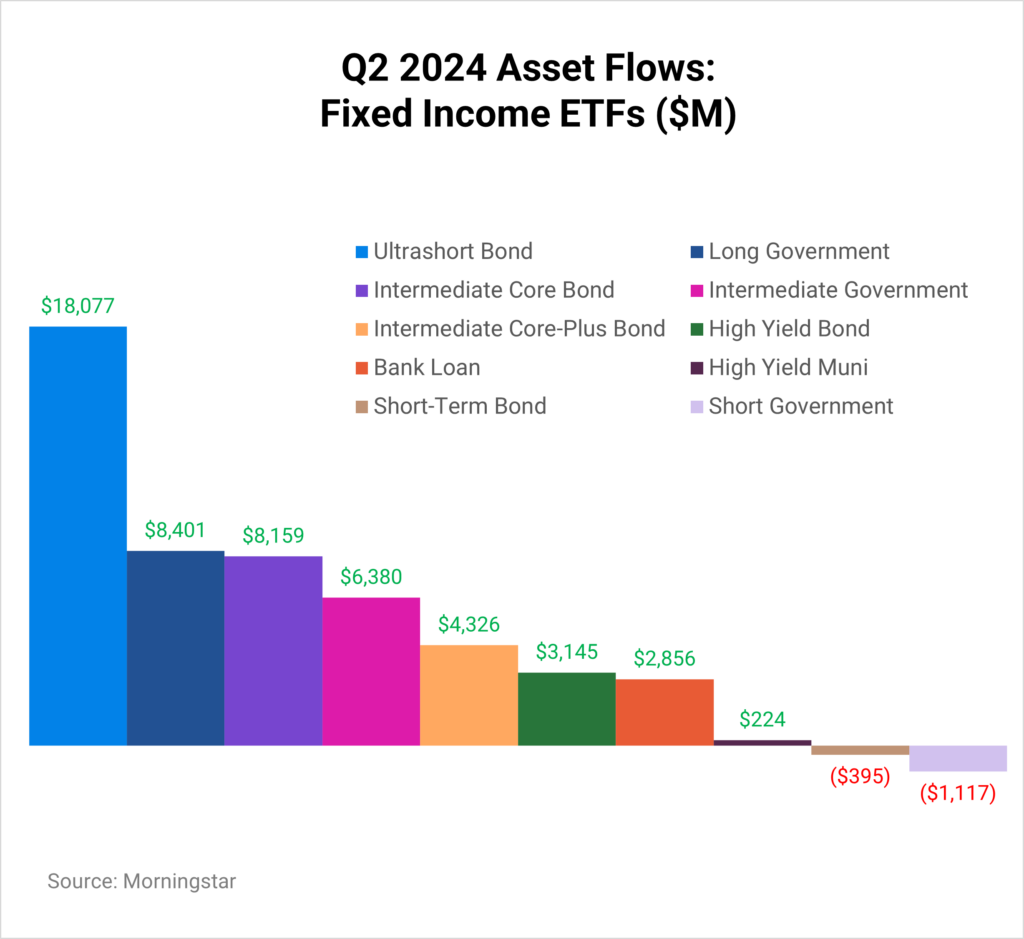
Inflows in Ultrashort Bond ETFs
Ultrashort Bond ETFs attracted $18.1B in Q2, offsetting some of the outflows from Q1. So far in 2024, the net $17.2B in inflows has propelled the category’s AUM to over $215B.
The two most popular strategies in Q2 were the iShares® 0-3 Month Treasury Bond ETF (SGOV) and the Janus Henderson AAA CLO ETF (JAAA), attracting $3.6B and $3B, respectively.
SGOV saw $4.8B in inflows this year, representing 21.1% of its AUM as of June 28, 2024, while the $5B in inflows this year into JAAA represent 47% of its AUM.
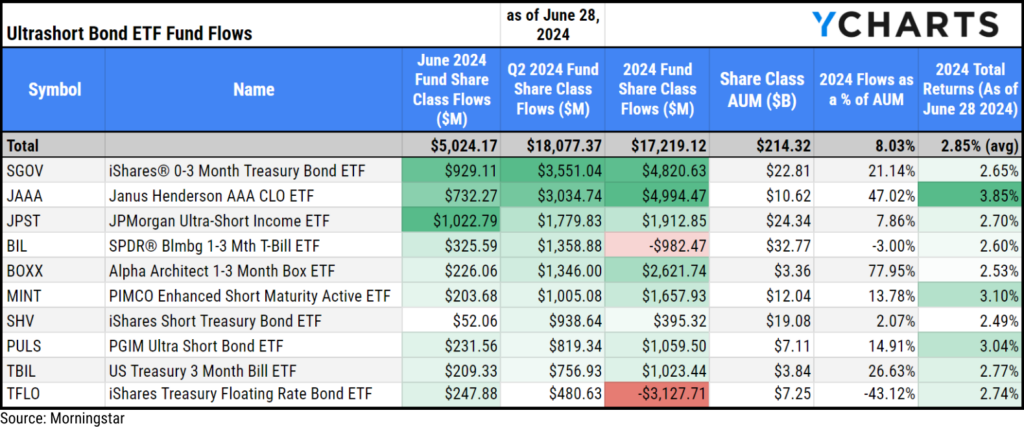
Download Visual | Modify in Comp Tables in YCharts
Outflows in Short Government ETFs
Short Government Bond ETFs saw $1.1B leave the category in Q2, adding to the net-negative flows it witnessed in Q2. Despite the $6.4B in outflows this year, there’s still over $65B in AUM in Short Government ETFs. Below is a table of the funds that saw the biggest outflows in the category in the first half of 2024.
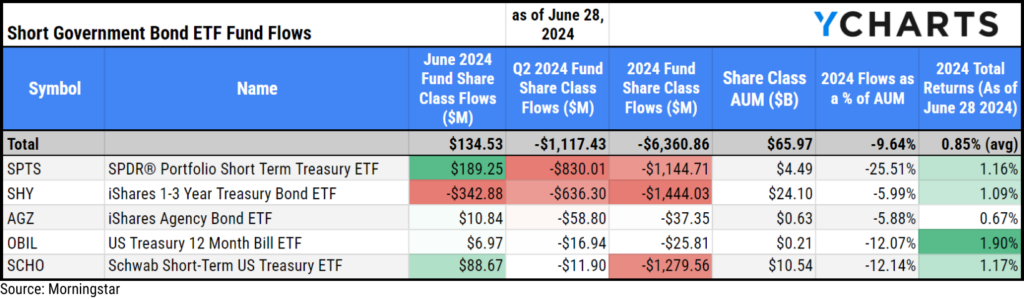
Download Visual | Modify in Comp Tables in YCharts
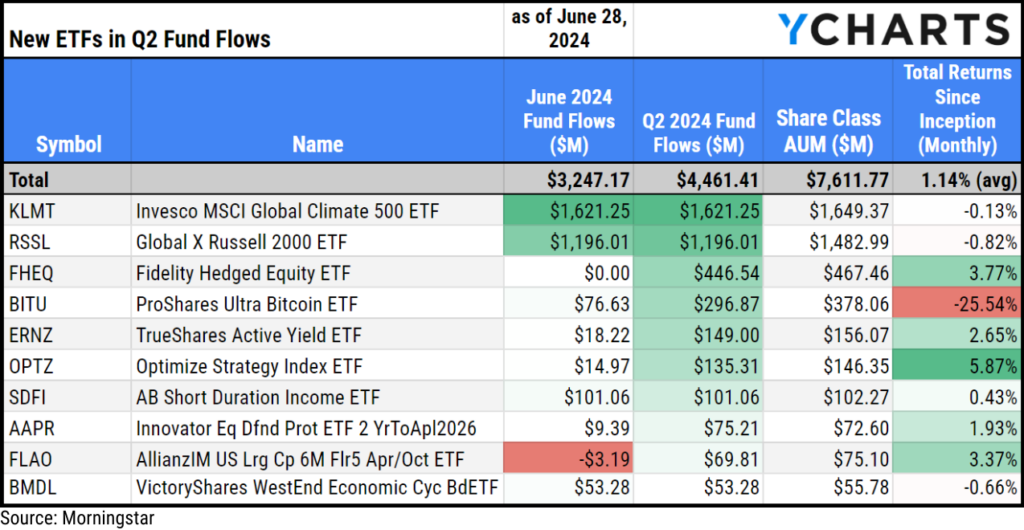
New ETF Launches in Q2 2024
Before entirely putting H1 in the rearview, we want to acknowledge the 150 new ETFs that began trading in Q2 2024, attracting $4.5B in flows.
During this period, 120 of the 150 ETFs launched (or 80%) were active strategies, and 48 (32%) were in the derivative income or options trading category. This shift demonstrates asset managers’ strategic move to leverage the growing demand for active management and specialized buffered or income strategies.
Invesco MSCI Global Climate 500 ETF (KLMT), Global X Russell 2000 ETF (RSSL), and Fidelity Hedged Equity ETF (FHEQ) were the leaders in attracting assets among Q2 launches, pulling in $1.6B, $1.2B, and $446.5M respectively.
Download Visual | Modify in Comp Tables in YCharts
Data used in this article is sourced from Morningstar data.
Whenever you’re ready, there are three ways YCharts can help you:
Have questions about how YCharts can help you grow AUM and prepare for meetings?
Email us at hello@ycharts.com or call (866) 965-7552. You’ll get a response from one of our Chicago-based team members.
Unlock access to our Fund Flows Report and Visual Deck by becoming a client.
Dive into YCharts with a no-obligation 7-Day Free Trial now.
Sign up for a copy of our Fund Flows Report and Visual Deck (clients only):
Disclaimer
©2024 YCharts, Inc. All Rights Reserved. YCharts, Inc. (“YCharts”) is not registered with the U.S. Securities and Exchange Commission (or with the securities regulatory authority or body of any state or any other jurisdiction) as an investment adviser, broker-dealer or in any other capacity, and does not purport to provide investment advice or make investment recommendations. This report has been generated through application of the analytical tools and data provided through ycharts.com and is intended solely to assist you or your investment or other adviser(s) in conducting investment research. You should not construe this report as an offer to buy or sell, as a solicitation of an offer to buy or sell, or as a recommendation to buy, sell, hold or trade, any security or other financial instrument. For further information regarding your use of this report, please go to: ycharts.com/about/disclosure
Next Article
Economic Update: Reviewing Q2 2024Read More →